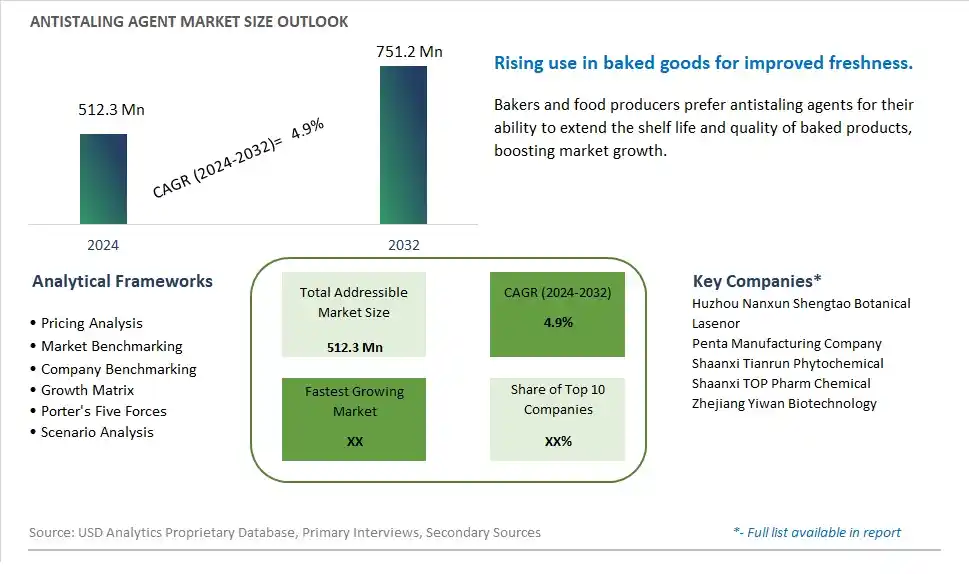
Global Antistaling Agent Market Size is valued at $512.3 Million in 2024 and is forecast to register a growth rate (CAGR) of 4.9% to reach $751.2 Million by 2032.
The global Antistaling Agent Market Comprehensive Study analyzes and forecasts the market size across 6 regions and 24 countries for diverse segments -By Type (Monoglycerides, Diglycerides, Wheat Gluten, Glycerolipids, Others), By Application (Cakes, Pastries, Bread & loaves, Others)
An Introduction to Antistaling Agent Market
The Antistaling Agent market in 2024 is expanding, driven by the increasing demand for fresh and high-quality bakery products with extended shelf life. Antistaling agents, also known as crumb softeners, are used to prevent staling and maintain the softness, texture, and freshness of baked goods. The market is supported by the growth of the bakery industry and the rising consumer preference for convenience foods. Innovations in food science and ingredient technology are enhancing the efficacy and safety of antistaling agents. The market is also benefiting from the trend towards clean-label products, where natural and functional ingredients are highly valued.
Antistaling Agent Competitive Landscape
The market report analyses the leading companies in the industry including Huzhou Nanxun Shengtao Botanical, Lasenor, Penta Manufacturing Company, Shaanxi Tianrun Phytochemical, Shaanxi TOP Pharm Chemical, Zhejiang Yiwan Biotechnology, and Others.
Antistaling Agent Market Dynamics
Antistaling Agent Market Trend: Increasing Demand for Longer Shelf Life in Baked Goods
The Antistaling Agent market is experiencing a significant trend towards increasing demand for longer shelf life in baked goods. Consumers and retailers are seeking products that maintain freshness and quality over extended periods, reducing waste and improving convenience. Antistaling agents play a crucial role in delaying the staling process, preserving the texture, moisture, and taste of bread, cakes, pastries, and other baked products. This trend is driven by the growing popularity of pre-packaged and ready-to-eat baked goods, as well as the expansion of global supply chains that require durable and shelf-stable products.
Antistaling Agent Market Driver: Growth of the Bakery Industry
A major driver for the Antistaling Agent market is the growth of the bakery industry. The increasing consumption of bakery products, fueled by changing consumer lifestyles, urbanization, and rising disposable incomes, is significantly boosting the demand for ingredients that enhance product quality and longevity. Bakeries and food manufacturers are investing in advanced formulations and technologies to meet consumer expectations for fresh and soft baked goods. This growth is further supported by the proliferation of artisanal and specialty bakeries that emphasize quality and innovation, driving the adoption of effective antistaling solutions.
Antistaling Agent Market Opportunity: Development of Natural and Clean-Label Antistaling Agents
Development of natural and clean-label antistaling agents presents a substantial opportunity for the market. With the rising consumer preference for clean-label products that contain natural ingredients and minimal additives, there is a significant demand for antistaling solutions that align with these values. Innovating and producing antistaling agents derived from natural sources, such as enzymes and plant extracts, can cater to health-conscious consumers and differentiate products in a competitive market. By focusing on clean-label formulations, manufacturers can tap into a growing segment of the market that prioritizes transparency and natural ingredients, driving growth and expanding their customer base.
Antistaling Agent Market Share Analysis: Monoglycerides segment generated the highest revenue share in the industry
Among the types of antistaling agents in the market, Monoglycerides emerge as the largest segment, exhibiting significant growth and widespread adoption across various industries. Monoglycerides are a type of emulsifier commonly used in food processing and bakery applications to prevent staling and improve the shelf life of baked goods. They function by interacting with starch molecules, reducing retrogradation, and maintaining the texture and freshness of baked products over time. The dominance of Monoglycerides in the Antistaling Agent Market can be attributed to several key factors. Firstly, the growing demand for convenience foods and baked goods with extended shelf life drives the need for effective antistaling solutions. Monoglycerides offer a cost-effective and efficient way to enhance the quality and sensory attributes of bakery products, making them highly preferred by food manufacturers. Further, the versatility of Monoglycerides allows for their use in a wide range of food applications, including bread, cakes, pastries, and confectionery items, contributing to their widespread adoption in the food industry. Additionally, advancements in food technology and formulation techniques have led to the development of innovative Monoglyceride-based antistaling agents with improved functionality and performance, further fueling market growth. With the increasing consumer preference for fresh and high-quality baked goods, the Monoglycerides segment is poised to maintain its leading position in the Antistaling Agent Market and witness continued expansion in the coming years.
Antistaling Agent Market Share Analysis: Bread & Loaves is the fastest growing segment over the forecast period to 2032
The Bread & Loaves Application segment within the Antistaling Agent Market is experiencing rapid growth and is projected to maintain this momentum up to 2032. This segment involves the use of antistaling agents in the production of bread, rolls, loaves, and similar bakery products. The fast growth of the Bread & Loaves Application segment can be attributed to several key factors. Firstly, bread is a staple food consumed globally, and there is a growing demand for bakery products with extended freshness and improved texture. Antistaling agents play a crucial role in inhibiting retrogradation and delaying the staling process, thereby enhancing the softness, moisture retention, and overall quality of bread and loaves throughout their shelf life. Further, changing consumer preferences towards healthier and more natural ingredients in baked goods drive the adoption of innovative antistaling agents derived from natural sources or with clean label formulations. Manufacturers are increasingly incorporating these agents to meet consumer demands for fresh and high-quality bread products. Additionally, technological advancements in antistaling agent formulations, such as encapsulation techniques and synergistic blends, contribute to improved efficacy and performance in bread applications, further boosting market growth. As consumers continue to seek convenient and nutritious bakery options, the Bread & Loaves Application segment emerges as the fastest growing segment in the Antistaling Agent Market, offering opportunities for innovation and product differentiation in the bakery industry.
Antistaling Agent Market Segmentation
By Type
Monoglycerides
Diglycerides
Wheat Gluten
Glycerolipids
Others
By Application
Cakes
Pastries
Bread & loaves
Others
Countries Analyzed
North America (US, Canada, Mexico)
Europe (Germany, UK, France, Spain, Italy, Russia, Rest of Europe)
Asia Pacific (China, India, Japan, South Korea, Australia, South East Asia, Rest of Asia)
South America (Brazil, Argentina, Rest of South America)
Middle East and Africa (Saudi Arabia, UAE, Rest of Middle East, South Africa, Egypt, Rest of Africa)
Antistaling Agent Companies Profiled in the Study
Huzhou Nanxun Shengtao Botanical
Lasenor
Penta Manufacturing Company
Shaanxi Tianrun Phytochemical
Shaanxi TOP Pharm Chemical
Zhejiang Yiwan Biotechnology
*- List Not Exhaustive
Chapter 1. TABLE OF CONTENTS
Chapter 2. Introduction to Antistaling Agent Market
2.1. Market Overview
2.2. Key Statistics and Report Highlights
2.3. Scope of the Comprehensive Study
2.3.1. Market Definition
2.3.2 Countries and Regions Covered
2.3.3 Research Objective
2.3.4 Units, Currency, and Conversions
2.3.5 Industry Value Chain
2.4. Key Market Segments
2.5. Key Companies
2.6. Study Period
Chapter 3. Strategic Analysis Review
3.1. Antistaling Agent Pricing Analysis and Forecast
3.2. Porter’s Five Forces
3.3. Market Ecosystem
3.4. SWOT Analysis
3.5. Regulatory Scenario
3.3. Effects of Inflation, Russia-Ukraine War, moderating economic growth, and other macroeconomic factors
Chapter 4. Competitive Landscape
4.1. Market Share Analysis
4.1.1. Global Antistaling Agent Market Share by Company, 2023
4.1.2. Product Offerings of Leading Antistaling Agent Companies
4.2. Market Entropy
4.2.1. New Product Launches in the Industry
4.2.2. Mergers, Acquisitions, Joint ventures, and Partnerships
4.3. Key Strategies and Best Practices
Chapter 5. Global Market Projections: Best, Reference, and Low Case Scenarios
5.1. Growth Analysis- Case Scenario Definitions
5.2. Low Growth Case Scenario Forecasts
5.3. Reference Growth Case Scenario Forecasts
5.4. High Growth Case Scenario Forecasts
Chapter 6. Market Dynamics
6.1. Antistaling Agent Market Drivers
6.2. Antistaling Agent Market Challenges
6.6. Antistaling Agent Market Opportunities
6.4. Antistaling Agent Market Trends
Chapter 7. Global Antistaling Agent Market Outlook Trends
7.1. Global Antistaling Agent Revenue (USD Million) and CAGR (%) by Type (2021-2032)
7.2. Global Antistaling Agent Revenue (USD Million) and CAGR (%) by Application (2021-2032)
7.3. Global Antistaling Agent Revenue (USD Million) and CAGR (%) by Product (2021-2032)
By Type
Monoglycerides
Diglycerides
Wheat Gluten
Glycerolipids
Others
By Application
Cakes
Pastries
Bread & loaves
Others
Chapter 8. Global Antistaling Agent Regional Analysis and Outlook
8.1. Global Antistaling Agent Revenue (USD Million) By Regions (2021- 2032)
8.2. North America Antistaling Agent Revenue (USD Million) by Country (2021-2032)
8.2.1. United States Antistaling Agent Regional Analysis and Outlook
8.2.2. Canada Antistaling Agent Regional Analysis and Outlook
8.2.3. Mexico Antistaling Agent Regional Analysis and Outlook
8.3. Europe Antistaling Agent Revenue (USD Million), by Country (2021-2032)
8.3.1. Germany Antistaling Agent Regional Analysis and Outlook
8.3.2. France Antistaling Agent Regional Analysis and Outlook
8.3.3. United Kingdom Antistaling Agent Regional Analysis and Outlook
8.3.4. Spain Antistaling Agent Regional Analysis and Outlook
8.3.5. Italy Antistaling Agent Regional Analysis and Outlook
8.3.6. Russia Antistaling Agent Regional Analysis and Outlook
8.3.7. Rest of Europe Antistaling Agent Regional Analysis and Outlook
8.4. Asia Pacific Antistaling Agent Revenue (USD Million) by Country (2021-2032)
8.4.1. China Antistaling Agent Regional Analysis and Outlook
8.4.2. Japan Antistaling Agent Regional Analysis and Outlook
8.4.3. India Antistaling Agent Regional Analysis and Outlook
8.4.4. South Korea Antistaling Agent Regional Analysis and Outlook
8.4.5. Australia Antistaling Agent Regional Analysis and Outlook
8.4.6. South East Asia Antistaling Agent Regional Analysis and Outlook
8.4.7. Rest of Asia Pacific Antistaling Agent Regional Analysis and Outlook
8.5. South America Antistaling Agent Revenue (USD Million), by Country (2021-2032)
8.5.1. Brazil Antistaling Agent Regional Analysis and Outlook
8.5.2. Argentina Antistaling Agent Regional Analysis and Outlook
8.5.3. Rest of South America Antistaling Agent Regional Analysis and Outlook
8.6. Middle East and Africa Antistaling Agent Revenue (USD Million) by Country (2021-2032)
8.6.1. Middle East Antistaling Agent Regional Analysis and Outlook
8.6.2. Africa Antistaling Agent Regional Analysis and Outlook
Chapter 9. North America Antistaling Agent Analysis and Outlook
9.1. North America Antistaling Agent Revenue (USD Million) by Segments (2021-2032)
9.1.1. North America Antistaling Agent Revenue (USD Million) by Type (2021-2032)
9.1.2. North America Antistaling Agent Revenue (USD Million) by Application (2021-2032)
9.1.3. North America Antistaling Agent Revenue (USD Million) by Product (2021-2032)
By Type
Monoglycerides
Diglycerides
Wheat Gluten
Glycerolipids
Others
By Application
Cakes
Pastries
Bread & loaves
Others
Chapter 10. Europe Antistaling Agent Analysis and Outlook
10.1. Europe Antistaling Agent Revenue (USD Million), by Segments (USD Million) (2021-2032)
10.1.1. Europe Antistaling Agent Revenue (USD Million) by Type (2021-2032)
10.1.2. Europe Antistaling Agent Revenue (USD Million) by Application (2021-2032)
10.1.3. Europe Antistaling Agent Revenue (USD Million) by Product (2021-2032)
By Type
Monoglycerides
Diglycerides
Wheat Gluten
Glycerolipids
Others
By Application
Cakes
Pastries
Bread & loaves
Others
Chapter 11. Asia Pacific Antistaling Agent Analysis and Outlook
11.1. Asia Pacific Antistaling Agent Revenue (USD Million), and Revenue (USD Million) by Segments (2021-2032)
11.1.1. Asia Pacific Antistaling Agent Revenue (USD Million) by Type (2021-2032)
11.1.2. Asia Pacific Antistaling Agent Revenue (USD Million) by Application (2021-2032)
11.1.3. Asia Pacific Antistaling Agent Revenue (USD Million) by Product (2021-2032)
By Type
Monoglycerides
Diglycerides
Wheat Gluten
Glycerolipids
Others
By Application
Cakes
Pastries
Bread & loaves
Others
Chapter 12. South America Antistaling Agent Analysis and Outlook
12.1. South America Antistaling Agent Revenue (USD Million), by Segments (2021-2032)
12.1.1. South America Antistaling Agent Revenue (USD Million) by Type (2021-2032)
12.1.2. South America Antistaling Agent Revenue (USD Million) by Application (2021-2032)
12.1.3. South America Antistaling Agent Revenue (USD Million) by Product (2021-2032)
By Type
Monoglycerides
Diglycerides
Wheat Gluten
Glycerolipids
Others
By Application
Cakes
Pastries
Bread & loaves
Others
Chapter 13. Middle East and Africa Antistaling Agent Analysis and Outlook
13.1. Middle East and Africa Antistaling Agent Revenue (USD Million), by Segments (2021-2032)
13.1.1. Middle East and Africa Antistaling Agent Revenue (USD Million) by Type (2021-2032)
13.1.2. Middle East and Africa Antistaling Agent Revenue (USD Million) by Application (2021-2032)
13.1.3. Middle East and Africa Antistaling Agent Revenue (USD Million) by Product (2021-2032)
By Type
Monoglycerides
Diglycerides
Wheat Gluten
Glycerolipids
Others
By Application
Cakes
Pastries
Bread & loaves
Others
Chapter 14. Antistaling Agent Company Profiles
14.1 Business Overview
14.2 Product Profiles
14.3 SWOT Profiles
14.5 Recent Developments
14.6 Financial Profile
List of Companies
Huzhou Nanxun Shengtao Botanical
Lasenor
Penta Manufacturing Company
Shaanxi Tianrun Phytochemical
Shaanxi TOP Pharm Chemical
Zhejiang Yiwan Biotechnology
15. Methodology and Data Sources
15.1 Customization Offerings
15.2 Subscription Services
15.3 Related Reports
15.4 Publisher Expertise
LIST OF TABLES
Table 1 Market Segmentation Analysis
Table 2 Global Antistaling Agent Market Share of Leading Companies, 2023
Table 3 Product Offerings of Leading Companies
Table 4 Low Growth Scenario Forecasts
Table 5 Reference Case Growth Scenario
Table 6 High Growth Case Scenario
Table 7 Global Antistaling Agent Revenue (USD Million) And CAGR (%) By Type (2021-2032)
Table 8 Global Antistaling Agent Revenue (USD Million) And CAGR (%) By Application (2021-2032)
Table 9 Global Antistaling Agent Revenue (USD Million) And CAGR (%) By Product (2021-2032)
Table 10 Global Antistaling Agent Market Revenue (USD Million) By Regions (2021-2032)
Table 11 Global Antistaling Agent Market Share (%) By Regions (2021-2032)
Table 12 North America Antistaling Agent Revenue (USD Million) By Country (2021-2032)
Table 13 Europe Antistaling Agent Revenue (USD Million) By Country (2021-2032)
Table 14 Asia Pacific Antistaling Agent Revenue (USD Million) By Country (2021-2032)
Table 15 South America Antistaling Agent Revenue (USD Million) By Country (2021-2032)
Table 16 Middle East and Africa Antistaling Agent Revenue (USD Million) By Region (2021-2032)
Table 17 North America Antistaling Agent Revenue (USD Million) By Type (2021-2032)
Table 18 North America Antistaling Agent Revenue (USD Million) By Application (2021-2032)
Table 19 North America Antistaling Agent Revenue (USD Million) By Product (2021-2032)
Table 20 Europe Antistaling Agent Revenue (USD Million) By Type (2021-2032)
Table 21 Europe Antistaling Agent Revenue (USD Million) By Application (2021-2032)
Table 22 Europe Antistaling Agent Revenue (USD Million) By Product (2021-2032)
Table 23 Asia Pacific Antistaling Agent Revenue (USD Million) By Type (2021-2032)
Table 24 Asia Pacific Antistaling Agent Revenue (USD Million) By Application (2021-2032)
Table 25 Asia Pacific Antistaling Agent Revenue (USD Million) By Product (2021-2032)
Table 26 South America Antistaling Agent Revenue (USD Million) By Type (2021-2032)
Table 27 South America Antistaling Agent Revenue (USD Million) By Application (2021-2032)
Table 28 South America Antistaling Agent Revenue (USD Million) By Product (2021-2032)
Table 29 Middle East and Africa Antistaling Agent Revenue (USD Million) By Type (2021-2032)
Table 30 Middle East and Africa Antistaling Agent Revenue (USD Million) By Application (2021-2032)
Table 31 Middle East and Africa Antistaling Agent Revenue (USD Million) By Product (2021-2032)
LIST OF FIGURES
Figure 1. Market Scope
Figure 2. Pricing Forecasts Per Unit, 2023- 2032
Figure 3. Porter’s Five Forces
Figure 4. Global Antistaling Agent Market Revenue (USD Million) By Regions (2021-2032)
Figure 5. Global Antistaling Agent Market Share (%) By Regions (2023)
Figure 6. North America Antistaling Agent Revenue (USD Million) By Country (2021-2032)
Figure 7. United States Antistaling Agent Revenue (USD Million) By Country (2021-2032)
Figure 8. Canada Antistaling Agent Revenue (USD Million) By Country (2021-2032)
Figure 9. Mexico Antistaling Agent Revenue (USD Million) By Country (2021-2032)
Figure 10. Europe Antistaling Agent Revenue (USD Million) By Country (2021-2032)
Figure 11. Germany Antistaling Agent Revenue (USD Million) By Country (2021-2032)
Figure 12. France Antistaling Agent Revenue (USD Million) By Country (2021-2032)
Figure 13. United Kingdom Antistaling Agent Revenue (USD Million) By Country (2021-2032)
Figure 14. Spain Antistaling Agent Revenue (USD Million) By Country (2021-2032)
Figure 15. Italy Antistaling Agent Revenue (USD Million) By Country (2021-2032)
Figure 16. Russia Antistaling Agent Revenue (USD Million) By Country (2021-2032)
Figure 17. Rest of Europe Antistaling Agent Revenue (USD Million) By Country (2021-2032)
Figure 11. Asia Pacific Antistaling Agent Revenue (USD Million) By Country (2021-2032)
Figure 12. China Antistaling Agent Revenue (USD Million) By Country (2021-2032)
Figure 13. Japan Antistaling Agent Revenue (USD Million) By Country (2021-2032)
Figure 14. India Antistaling Agent Revenue (USD Million) By Country (2021-2032)
Figure 15. South Korea Antistaling Agent Revenue (USD Million) By Country (2021-2032)
Figure 16. Australia Antistaling Agent Revenue (USD Million) By Country (2021-2032)
Figure 17. South East Asia Antistaling Agent Revenue (USD Million) By Country (2021-2032)
Figure 18. South America Antistaling Agent Revenue (USD Million) By Country (2021-2032)
Figure 19. Brazil Antistaling Agent Revenue (USD Million) By Country (2021-2032)
Figure 20. Argentina Antistaling Agent Revenue (USD Million) By Country (2021-2032)
Figure 21. Rest of Asia Pacific Antistaling Agent Revenue (USD Million) By Country (2021-2032)
Figure 22. Middle East and Africa Antistaling Agent Revenue (USD Million) By Region (2021-2032)
Figure 23. Saudi Arabia Antistaling Agent Revenue (USD Million) By Region (2021-2032)
Figure 24. The UAE Antistaling Agent Revenue (USD Million) By Region (2021-2032)
Figure 25. Rest of Middle East Antistaling Agent Revenue (USD Million) By Region (2021-2032)
Figure 26. South Africa Antistaling Agent Revenue (USD Million) By Region (2021-2032)
Figure 27. Africa Antistaling Agent Revenue (USD Million) By Region (2021-2032)
Figure 28. North America Antistaling Agent Revenue (USD Million) By Type (2021-2032)
Figure 29. North America Antistaling Agent Revenue (USD Million) By Application (2021-2032)
Figure 30. North America Antistaling Agent Revenue (USD Million) By Product (2021-2032)
Figure 31. Europe Antistaling Agent Revenue (USD Million) By Type (2021-2032)
Figure 32. Europe Antistaling Agent Revenue (USD Million) By Application (2021-2032)
Figure 33. Europe Antistaling Agent Revenue (USD Million) By Product (2021-2032)
Figure 34. Asia Pacific Antistaling Agent Revenue (USD Million) By Type (2021-2032)
Figure 35. Asia Pacific Antistaling Agent Revenue (USD Million) By Application (2021-2032)
Figure 36. Asia Pacific Antistaling Agent Revenue (USD Million) By Product (2021-2032)
Figure 37. South America Antistaling Agent Revenue (USD Million) By Type (2021-2032)
Figure 38. South America Antistaling Agent Revenue (USD Million) By Application (2021-2032)
Figure 39. South America Antistaling Agent Revenue (USD Million) By Product (2021-2032)
Figure 40. Middle East and Africa Antistaling Agent Revenue (USD Million) By Type (2021-2032)
Figure 41. Middle East and Africa Antistaling Agent Revenue (USD Million) By Application (2021-2032)
Figure 42. Middle East and Africa Antistaling Agent Revenue (USD Million) By Product (2021-2032)
By Type
Monoglycerides
Diglycerides
Wheat Gluten
Glycerolipids
Others
By Application
Cakes
Pastries
Bread & loaves
Others
Countries Analyzed
North America (US, Canada, Mexico)
Europe (Germany, UK, France, Spain, Italy, Russia, Rest of Europe)
Asia Pacific (China, India, Japan, South Korea, Australia, South East Asia, Rest of Asia)
South America (Brazil, Argentina, Rest of South America)
Middle East and Africa (Saudi Arabia, UAE, Rest of Middle East, South Africa, Egypt, Rest of Africa)
