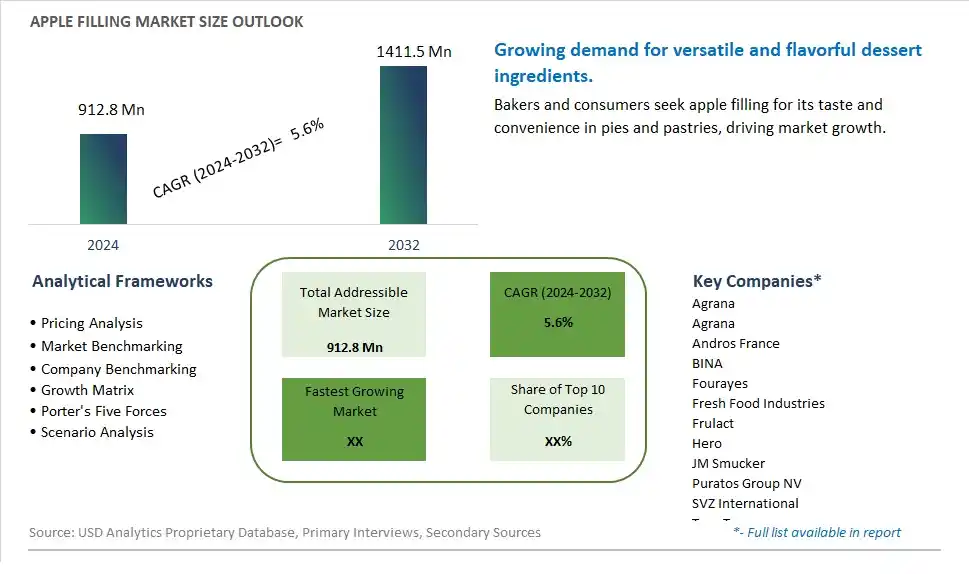
Global Apple Filling Market Size is valued at $912.8 Million in 2024 and is forecast to register a growth rate (CAGR) of 5.6% to reach $1411.5 Million by 2032.
The global Apple Filling Market Comprehensive Study analyzes and forecasts the market size across 6 regions and 24 countries for diverse segments -By Type (High Sugar Jam, Low Sugar Jam), By Application (Dairy, Baked Product, Ice-Cream, Others)
An Introduction to Apple Filling Market
The Apple Filling market in 2024 is thriving, fueled by the rising demand for versatile and convenient fruit-based ingredients in the bakery and confectionery industries. Apple filling, made from fresh or processed apples, is used in a variety of products such as pies, pastries, cakes, and desserts. The market is supported by the growing consumer preference for natural and wholesome ingredients. Advances in processing and preservation techniques are enhancing the flavor, texture, and shelf life of apple fillings. The market is also benefiting from the trend towards ready-to-use and premium ingredients, catering to both industrial bakers and home cooks.
Apple Filling Competitive Landscape
The market report analyses the leading companies in the industry including Agrana, Agrana, Andros France, BINA, Fourayes, Fresh Food Industries, Frulact, Hero, JM Smucker, Puratos Group NV, SVZ International, Tree Top, Valio, Zentis, Zuegg, and Others.
Apple Filling Market Dynamics
Apple Filling Market Trend: Rising Demand for Convenience Foods
The Apple Filling market is experiencing a significant trend towards the rising demand for convenience foods. Consumers' busy lifestyles are driving the popularity of ready-to-use food ingredients that simplify cooking and baking processes. Apple filling, used in a variety of products such as pies, pastries, and desserts, offers a convenient solution for both home cooks and commercial bakeries. This trend is further supported by the increasing preference for pre-made and easy-to-prepare food products that save time without compromising on taste and quality. As a result, the market is seeing a surge in the development and sales of high-quality, pre-prepared fruit fillings.
Apple Filling Market Driver: Growth in the Bakery and Confectionery Industries
A major driver for the Apple Filling market is the growth of the bakery and confectionery industries. The rising consumption of bakery products, including pies, cakes, and pastries, is significantly boosting the demand for versatile and flavorful fillings. Apple filling is a staple ingredient in many baked goods, valued for its rich taste and ability to complement various recipes. The expansion of artisanal bakeries, along with the increasing popularity of traditional and seasonal desserts, is driving the need for consistent and high-quality apple fillings. Additionally, the trend towards premium and innovative baked products is further propelling market growth.
Apple Filling Market Opportunity: Expansion into Health-Conscious and Specialty Products
Expansion into health-conscious and specialty products presents a substantial opportunity for the Apple Filling market. With growing consumer awareness of health and wellness, there is an increasing demand for natural, organic, and reduced-sugar apple fillings that cater to health-conscious individuals. Developing products that meet these criteria can attract a broader customer base and tap into the lucrative health food market. Additionally, creating unique and specialty apple fillings, such as those infused with spices or tailored for specific dietary needs (e.g., gluten-free or vegan), can further differentiate offerings and capture niche markets. By innovating and diversifying product lines, manufacturers can leverage these opportunities to drive significant market growth.
Apple Filling Market Share Analysis: High Sugar Jam segment generated the highest revenue share in the industry
High Sugar Jam stands out as the largest segment in the Apple Filling Market, showcasing notable growth trends and substantial market share. High Sugar Jam refers to apple fillings with a higher concentration of sugar, which enhances sweetness and acts as a natural preservative, extending the shelf life of the product. This segment's dominance can be attributed to several factors. Firstly, the traditional preference for sweeter and indulgent flavors drives the demand for high sugar jams, especially in desserts, pastries, and bakery products where apple fillings are commonly used. Consumers often associate high sugar jams with rich flavor profiles and enhanced taste experiences, contributing to their popularity in various culinary applications. Further, high sugar jams offer versatility in usage, making them suitable for a wide range of food products such as pies, tarts, cakes, muffins, and sandwiches, among others. The ability of high sugar jams to complement different recipes and create delectable flavor combinations further amplifies their market appeal. Additionally, advancements in food processing technologies have led to the development of high sugar jams with improved texture, spreadability, and sensory attributes, meeting consumer expectations for premium quality products. With consumers' continued preference for sweet and indulgent food options, the High Sugar Jam segment is expected to maintain its leading position in the Apple Filling Market, driving innovation and product diversification in the coming years.
Apple Filling Market Share Analysis: Baked Products is the fastest growing segment over the forecast period to 2032
Among the various applications in the Apple Filling Market, the Baked Products segment emerges as the fastest growing category, showcasing remarkable expansion prospects up to 2032. Baked products encompass a wide array of items such as pies, tarts, pastries, cakes, muffins, and cookies, among others, where apple fillings are commonly incorporated. The significant growth of the Baked Products segment can be attributed to several key factors. Firstly, there is a growing consumer preference for natural and fruit-based ingredients in baked goods, driven by health-conscious trends and the demand for clean-label products. Apple fillings, known for their natural sweetness, flavor, and nutritional benefits, align perfectly with this consumer preference, contributing to increased adoption in baked recipes. Further, the versatility of apple fillings allows for creative and innovative product developments in the baked goods segment. Manufacturers and chefs are continuously exploring new ways to incorporate apple fillings into unique and enticing baked creations, catering to evolving consumer tastes and preferences. Additionally, advancements in food processing techniques and packaging technologies have improved the quality, shelf life, and convenience of apple fillings, further fueling their integration into various baked products. As consumers' interest in indulgent yet wholesome baked treats continues to rise, propelled by factors like convenience, taste, and health considerations, the Baked Products segment is poised for rapid growth and innovation in the Apple Filling Market.
Apple Filling Market Segmentation
By Type
High Sugar Jam
Low Sugar Jam
By Application
Dairy
Baked Product
Ice-Cream
Others
Countries Analyzed
North America (US, Canada, Mexico)
Europe (Germany, UK, France, Spain, Italy, Russia, Rest of Europe)
Asia Pacific (China, India, Japan, South Korea, Australia, South East Asia, Rest of Asia)
South America (Brazil, Argentina, Rest of South America)
Middle East and Africa (Saudi Arabia, UAE, Rest of Middle East, South Africa, Egypt, Rest of Africa)
Apple Filling Companies Profiled in the Study
Agrana
Agrana
Andros France
BINA
Fourayes
Fresh Food Industries
Frulact
Hero
JM Smucker
Puratos Group NV
SVZ International
Tree Top
Valio
Zentis
Zuegg
*- List Not Exhaustive
Chapter 1. TABLE OF CONTENTS
Chapter 2. Introduction to Apple Filling Market
2.1. Market Overview
2.2. Key Statistics and Report Highlights
2.3. Scope of the Comprehensive Study
2.3.1. Market Definition
2.3.2 Countries and Regions Covered
2.3.3 Research Objective
2.3.4 Units, Currency, and Conversions
2.3.5 Industry Value Chain
2.4. Key Market Segments
2.5. Key Companies
2.6. Study Period
Chapter 3. Strategic Analysis Review
3.1. Apple Filling Pricing Analysis and Forecast
3.2. Porter’s Five Forces
3.3. Market Ecosystem
3.4. SWOT Analysis
3.5. Regulatory Scenario
3.3. Effects of Inflation, Russia-Ukraine War, moderating economic growth, and other macroeconomic factors
Chapter 4. Competitive Landscape
4.1. Market Share Analysis
4.1.1. Global Apple Filling Market Share by Company, 2023
4.1.2. Product Offerings of Leading Apple Filling Companies
4.2. Market Entropy
4.2.1. New Product Launches in the Industry
4.2.2. Mergers, Acquisitions, Joint ventures, and Partnerships
4.3. Key Strategies and Best Practices
Chapter 5. Global Market Projections: Best, Reference, and Low Case Scenarios
5.1. Growth Analysis- Case Scenario Definitions
5.2. Low Growth Case Scenario Forecasts
5.3. Reference Growth Case Scenario Forecasts
5.4. High Growth Case Scenario Forecasts
Chapter 6. Market Dynamics
6.1. Apple Filling Market Drivers
6.2. Apple Filling Market Challenges
6.6. Apple Filling Market Opportunities
6.4. Apple Filling Market Trends
Chapter 7. Global Apple Filling Market Outlook Trends
7.1. Global Apple Filling Revenue (USD Million) and CAGR (%) by Type (2021-2032)
7.2. Global Apple Filling Revenue (USD Million) and CAGR (%) by Application (2021-2032)
7.3. Global Apple Filling Revenue (USD Million) and CAGR (%) by Product (2021-2032)
By Type
High Sugar Jam
Low Sugar Jam
By Application
Dairy
Baked Product
Ice-Cream
Others
Chapter 8. Global Apple Filling Regional Analysis and Outlook
8.1. Global Apple Filling Revenue (USD Million) By Regions (2021- 2032)
8.2. North America Apple Filling Revenue (USD Million) by Country (2021-2032)
8.2.1. United States Apple Filling Regional Analysis and Outlook
8.2.2. Canada Apple Filling Regional Analysis and Outlook
8.2.3. Mexico Apple Filling Regional Analysis and Outlook
8.3. Europe Apple Filling Revenue (USD Million), by Country (2021-2032)
8.3.1. Germany Apple Filling Regional Analysis and Outlook
8.3.2. France Apple Filling Regional Analysis and Outlook
8.3.3. United Kingdom Apple Filling Regional Analysis and Outlook
8.3.4. Spain Apple Filling Regional Analysis and Outlook
8.3.5. Italy Apple Filling Regional Analysis and Outlook
8.3.6. Russia Apple Filling Regional Analysis and Outlook
8.3.7. Rest of Europe Apple Filling Regional Analysis and Outlook
8.4. Asia Pacific Apple Filling Revenue (USD Million) by Country (2021-2032)
8.4.1. China Apple Filling Regional Analysis and Outlook
8.4.2. Japan Apple Filling Regional Analysis and Outlook
8.4.3. India Apple Filling Regional Analysis and Outlook
8.4.4. South Korea Apple Filling Regional Analysis and Outlook
8.4.5. Australia Apple Filling Regional Analysis and Outlook
8.4.6. South East Asia Apple Filling Regional Analysis and Outlook
8.4.7. Rest of Asia Pacific Apple Filling Regional Analysis and Outlook
8.5. South America Apple Filling Revenue (USD Million), by Country (2021-2032)
8.5.1. Brazil Apple Filling Regional Analysis and Outlook
8.5.2. Argentina Apple Filling Regional Analysis and Outlook
8.5.3. Rest of South America Apple Filling Regional Analysis and Outlook
8.6. Middle East and Africa Apple Filling Revenue (USD Million) by Country (2021-2032)
8.6.1. Middle East Apple Filling Regional Analysis and Outlook
8.6.2. Africa Apple Filling Regional Analysis and Outlook
Chapter 9. North America Apple Filling Analysis and Outlook
9.1. North America Apple Filling Revenue (USD Million) by Segments (2021-2032)
9.1.1. North America Apple Filling Revenue (USD Million) by Type (2021-2032)
9.1.2. North America Apple Filling Revenue (USD Million) by Application (2021-2032)
9.1.3. North America Apple Filling Revenue (USD Million) by Product (2021-2032)
By Type
High Sugar Jam
Low Sugar Jam
By Application
Dairy
Baked Product
Ice-Cream
Others
Chapter 10. Europe Apple Filling Analysis and Outlook
10.1. Europe Apple Filling Revenue (USD Million), by Segments (USD Million) (2021-2032)
10.1.1. Europe Apple Filling Revenue (USD Million) by Type (2021-2032)
10.1.2. Europe Apple Filling Revenue (USD Million) by Application (2021-2032)
10.1.3. Europe Apple Filling Revenue (USD Million) by Product (2021-2032)
By Type
High Sugar Jam
Low Sugar Jam
By Application
Dairy
Baked Product
Ice-Cream
Others
Chapter 11. Asia Pacific Apple Filling Analysis and Outlook
11.1. Asia Pacific Apple Filling Revenue (USD Million), and Revenue (USD Million) by Segments (2021-2032)
11.1.1. Asia Pacific Apple Filling Revenue (USD Million) by Type (2021-2032)
11.1.2. Asia Pacific Apple Filling Revenue (USD Million) by Application (2021-2032)
11.1.3. Asia Pacific Apple Filling Revenue (USD Million) by Product (2021-2032)
By Type
High Sugar Jam
Low Sugar Jam
By Application
Dairy
Baked Product
Ice-Cream
Others
Chapter 12. South America Apple Filling Analysis and Outlook
12.1. South America Apple Filling Revenue (USD Million), by Segments (2021-2032)
12.1.1. South America Apple Filling Revenue (USD Million) by Type (2021-2032)
12.1.2. South America Apple Filling Revenue (USD Million) by Application (2021-2032)
12.1.3. South America Apple Filling Revenue (USD Million) by Product (2021-2032)
By Type
High Sugar Jam
Low Sugar Jam
By Application
Dairy
Baked Product
Ice-Cream
Others
Chapter 13. Middle East and Africa Apple Filling Analysis and Outlook
13.1. Middle East and Africa Apple Filling Revenue (USD Million), by Segments (2021-2032)
13.1.1. Middle East and Africa Apple Filling Revenue (USD Million) by Type (2021-2032)
13.1.2. Middle East and Africa Apple Filling Revenue (USD Million) by Application (2021-2032)
13.1.3. Middle East and Africa Apple Filling Revenue (USD Million) by Product (2021-2032)
By Type
High Sugar Jam
Low Sugar Jam
By Application
Dairy
Baked Product
Ice-Cream
Others
Chapter 14. Apple Filling Company Profiles
14.1 Business Overview
14.2 Product Profiles
14.3 SWOT Profiles
14.5 Recent Developments
14.6 Financial Profile
List of Companies
Agrana
Agrana
Andros France
BINA
Fourayes
Fresh Food Industries
Frulact
Hero
JM Smucker
Puratos Group NV
SVZ International
Tree Top
Valio
Zentis
Zuegg
15. Methodology and Data Sources
15.1 Customization Offerings
15.2 Subscription Services
15.3 Related Reports
15.4 Publisher Expertise
LIST OF TABLES
Table 1 Market Segmentation Analysis
Table 2 Global Apple Filling Market Share of Leading Companies, 2023
Table 3 Product Offerings of Leading Companies
Table 4 Low Growth Scenario Forecasts
Table 5 Reference Case Growth Scenario
Table 6 High Growth Case Scenario
Table 7 Global Apple Filling Revenue (USD Million) And CAGR (%) By Type (2021-2032)
Table 8 Global Apple Filling Revenue (USD Million) And CAGR (%) By Application (2021-2032)
Table 9 Global Apple Filling Revenue (USD Million) And CAGR (%) By Product (2021-2032)
Table 10 Global Apple Filling Market Revenue (USD Million) By Regions (2021-2032)
Table 11 Global Apple Filling Market Share (%) By Regions (2021-2032)
Table 12 North America Apple Filling Revenue (USD Million) By Country (2021-2032)
Table 13 Europe Apple Filling Revenue (USD Million) By Country (2021-2032)
Table 14 Asia Pacific Apple Filling Revenue (USD Million) By Country (2021-2032)
Table 15 South America Apple Filling Revenue (USD Million) By Country (2021-2032)
Table 16 Middle East and Africa Apple Filling Revenue (USD Million) By Region (2021-2032)
Table 17 North America Apple Filling Revenue (USD Million) By Type (2021-2032)
Table 18 North America Apple Filling Revenue (USD Million) By Application (2021-2032)
Table 19 North America Apple Filling Revenue (USD Million) By Product (2021-2032)
Table 20 Europe Apple Filling Revenue (USD Million) By Type (2021-2032)
Table 21 Europe Apple Filling Revenue (USD Million) By Application (2021-2032)
Table 22 Europe Apple Filling Revenue (USD Million) By Product (2021-2032)
Table 23 Asia Pacific Apple Filling Revenue (USD Million) By Type (2021-2032)
Table 24 Asia Pacific Apple Filling Revenue (USD Million) By Application (2021-2032)
Table 25 Asia Pacific Apple Filling Revenue (USD Million) By Product (2021-2032)
Table 26 South America Apple Filling Revenue (USD Million) By Type (2021-2032)
Table 27 South America Apple Filling Revenue (USD Million) By Application (2021-2032)
Table 28 South America Apple Filling Revenue (USD Million) By Product (2021-2032)
Table 29 Middle East and Africa Apple Filling Revenue (USD Million) By Type (2021-2032)
Table 30 Middle East and Africa Apple Filling Revenue (USD Million) By Application (2021-2032)
Table 31 Middle East and Africa Apple Filling Revenue (USD Million) By Product (2021-2032)
LIST OF FIGURES
Figure 1. Market Scope
Figure 2. Pricing Forecasts Per Unit, 2023- 2032
Figure 3. Porter’s Five Forces
Figure 4. Global Apple Filling Market Revenue (USD Million) By Regions (2021-2032)
Figure 5. Global Apple Filling Market Share (%) By Regions (2023)
Figure 6. North America Apple Filling Revenue (USD Million) By Country (2021-2032)
Figure 7. United States Apple Filling Revenue (USD Million) By Country (2021-2032)
Figure 8. Canada Apple Filling Revenue (USD Million) By Country (2021-2032)
Figure 9. Mexico Apple Filling Revenue (USD Million) By Country (2021-2032)
Figure 10. Europe Apple Filling Revenue (USD Million) By Country (2021-2032)
Figure 11. Germany Apple Filling Revenue (USD Million) By Country (2021-2032)
Figure 12. France Apple Filling Revenue (USD Million) By Country (2021-2032)
Figure 13. United Kingdom Apple Filling Revenue (USD Million) By Country (2021-2032)
Figure 14. Spain Apple Filling Revenue (USD Million) By Country (2021-2032)
Figure 15. Italy Apple Filling Revenue (USD Million) By Country (2021-2032)
Figure 16. Russia Apple Filling Revenue (USD Million) By Country (2021-2032)
Figure 17. Rest of Europe Apple Filling Revenue (USD Million) By Country (2021-2032)
Figure 11. Asia Pacific Apple Filling Revenue (USD Million) By Country (2021-2032)
Figure 12. China Apple Filling Revenue (USD Million) By Country (2021-2032)
Figure 13. Japan Apple Filling Revenue (USD Million) By Country (2021-2032)
Figure 14. India Apple Filling Revenue (USD Million) By Country (2021-2032)
Figure 15. South Korea Apple Filling Revenue (USD Million) By Country (2021-2032)
Figure 16. Australia Apple Filling Revenue (USD Million) By Country (2021-2032)
Figure 17. South East Asia Apple Filling Revenue (USD Million) By Country (2021-2032)
Figure 18. South America Apple Filling Revenue (USD Million) By Country (2021-2032)
Figure 19. Brazil Apple Filling Revenue (USD Million) By Country (2021-2032)
Figure 20. Argentina Apple Filling Revenue (USD Million) By Country (2021-2032)
Figure 21. Rest of Asia Pacific Apple Filling Revenue (USD Million) By Country (2021-2032)
Figure 22. Middle East and Africa Apple Filling Revenue (USD Million) By Region (2021-2032)
Figure 23. Saudi Arabia Apple Filling Revenue (USD Million) By Region (2021-2032)
Figure 24. The UAE Apple Filling Revenue (USD Million) By Region (2021-2032)
Figure 25. Rest of Middle East Apple Filling Revenue (USD Million) By Region (2021-2032)
Figure 26. South Africa Apple Filling Revenue (USD Million) By Region (2021-2032)
Figure 27. Africa Apple Filling Revenue (USD Million) By Region (2021-2032)
Figure 28. North America Apple Filling Revenue (USD Million) By Type (2021-2032)
Figure 29. North America Apple Filling Revenue (USD Million) By Application (2021-2032)
Figure 30. North America Apple Filling Revenue (USD Million) By Product (2021-2032)
Figure 31. Europe Apple Filling Revenue (USD Million) By Type (2021-2032)
Figure 32. Europe Apple Filling Revenue (USD Million) By Application (2021-2032)
Figure 33. Europe Apple Filling Revenue (USD Million) By Product (2021-2032)
Figure 34. Asia Pacific Apple Filling Revenue (USD Million) By Type (2021-2032)
Figure 35. Asia Pacific Apple Filling Revenue (USD Million) By Application (2021-2032)
Figure 36. Asia Pacific Apple Filling Revenue (USD Million) By Product (2021-2032)
Figure 37. South America Apple Filling Revenue (USD Million) By Type (2021-2032)
Figure 38. South America Apple Filling Revenue (USD Million) By Application (2021-2032)
Figure 39. South America Apple Filling Revenue (USD Million) By Product (2021-2032)
Figure 40. Middle East and Africa Apple Filling Revenue (USD Million) By Type (2021-2032)
Figure 41. Middle East and Africa Apple Filling Revenue (USD Million) By Application (2021-2032)
Figure 42. Middle East and Africa Apple Filling Revenue (USD Million) By Product (2021-2032)
By Type
High Sugar Jam
Low Sugar Jam
By Application
Dairy
Baked Product
Ice-Cream
Others
Countries Analyzed
North America (US, Canada, Mexico)
Europe (Germany, UK, France, Spain, Italy, Russia, Rest of Europe)
Asia Pacific (China, India, Japan, South Korea, Australia, South East Asia, Rest of Asia)
South America (Brazil, Argentina, Rest of South America)
Middle East and Africa (Saudi Arabia, UAE, Rest of Middle East, South Africa, Egypt, Rest of Africa)
