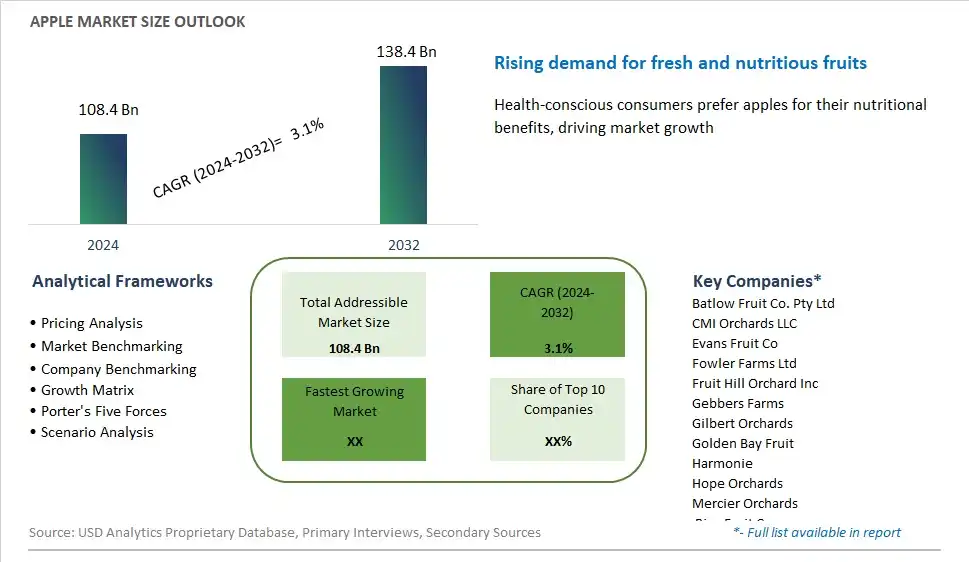
Global Apple Market Size is valued at $108.4 Billion in 2024 and is forecast to register a growth rate (CAGR) of 3.1% to reach $138.4 Billion by 2032.
The global Apple Market Comprehensive Study analyzes and forecasts the market size across 6 regions and 24 countries for diverse segments -By Type (Red apple, Granny smith, and Golden apples), By Distribution Channel (Offline, Online)
An Introduction to Apple Market
The apple market in 2024 is characterized by its resilience and adaptability, with apples remaining one of the most popular and versatile fruits worldwide. Apples are valued for their crisp texture, sweet-tart flavor, and nutritional profile, making them a staple ingredient in various culinary applications, including fresh consumption, juices, sauces, desserts, and snacks. With a wide range of cultivars available, from classic varieties like Gala and Fuji to heirloom and specialty apples, consumers have ample choices to suit their taste preferences and culinary needs. Moreover, apples are prized for their health benefits, being rich in fiber, vitamins, and antioxidants, and linked to reduced risk of chronic diseases such as heart disease and diabetes. As consumer preferences evolve towards natural and minimally processed foods, there's a growing demand for organic and locally sourced apples, driving trends in sustainable agriculture and farm-to-table practices. Additionally, technological advancements in storage, transportation, and packaging are extending the availability of fresh apples year-round, further fueling market growth and consumption. In 2024, the apple market is poised for continued expansion and diversification, driven by innovation, consumer demand for healthy and convenient foods, and global trade opportunities.
Apple Competitive Landscape
The market report analyses the leading companies in the industry including Batlow Fruit Co. Pty Ltd, CMI Orchards LLC, Evans Fruit Co, Fowler Farms Ltd, Fruit Hill Orchard Inc, Gebbers Farms, Gilbert Orchards, Golden Bay Fruit, Harmonie, Hope Orchards, Mercier Orchards, Rice Fruit Co., Roche Fruit LLC, Shenandoah Valley Orchards, Stemilt Growers LLC, Symms Fruit Ranch Inc, Washington Fruit Growers, and Others.
Apple Market Dynamics
Apple Market Trend: Shift Towards Health and Wellness
A significant trend in the apple market is the shift towards health and wellness. With increasing awareness of the importance of a balanced diet and lifestyle, consumers are seeking nutritious and wholesome food options, including fresh fruits like apples. Apples are recognized for their numerous health benefits, such as being rich in fiber, vitamins, and antioxidants, and are associated with promoting heart health, aiding digestion, and supporting overall well-being. This trend is driven by the growing emphasis on preventive healthcare and dietary choices that contribute to a healthier lifestyle, as well as the rising demand for natural and minimally processed foods, positioning apples as a preferred choice among health-conscious consumers.
Market Driver: Diversification of Product Offerings
A key driver shaping the apple market is the diversification of product offerings. Apples are versatile fruits that can be consumed in various forms, including fresh, juiced, dried, and processed into value-added products such as applesauce, apple cider, apple chips, and apple-based snacks. This diversification of product offerings allows apple producers and manufacturers to cater to different consumer preferences and market segments, expanding the reach and appeal of apples beyond traditional fresh fruit consumption. Additionally, advancements in food processing technology and packaging techniques enable the development of innovative apple products that offer convenience, portability, and extended shelf life, driving growth and differentiation in the market.
Market Opportunity: Expansion into Functional and Specialty Varieties
An opportunity for growth in the apple market lies in the expansion into functional and specialty varieties. While traditional apple varieties such as Gala, Granny Smith, and Fuji remain popular staples in the market, there is potential to introduce new and unique apple cultivars that offer specific health benefits, flavor profiles, and culinary uses. Functional apple varieties, such as those with higher antioxidant content or unique phytochemical profiles, can appeal to health-conscious consumers seeking targeted nutritional benefits. Similarly, specialty apple varieties with distinctive flavors, textures, and appearances can cater to gourmet and specialty markets, offering premium options for culinary enthusiasts and foodservice establishments. By leveraging genetic breeding, cultivation techniques, and marketing strategies, apple growers and producers can capitalize on the demand for functional and specialty apples, creating new market opportunities and driving growth in the industry.
Apple Market Share Analysis: Red Apple held the dominant market share in 2024
The Red Apple segment stands as the largest within the Apple Market due to its widespread popularity and versatile culinary applications. Red apples, such as varieties like Fuji, Gala, and Red Delicious, are known for their sweet and crisp texture, making them a favorite choice among consumers for fresh consumption and cooking purposes. Additionally, red apples are widely used in various culinary creations, including pies, sauces, salads, and desserts, further driving their demand. Further, the vibrant red color and appealing appearance of red apples make them highly attractive to consumers, contributing to their dominance in the market. With a consistent demand from both domestic and international markets, the Red Apple segment continues to maintain its stronghold as the largest segment in the Apple Market.
Apple Market Share Analysis: Online market is poised to register the fastest growth rae over the forecast period to 2032
The Online segment within the Apple Market is the fastest-growing, fueled by the increasing adoption of e-commerce platforms and the convenience of online shopping. With the rise of digitalization and the proliferation of online grocery delivery services, consumers are increasingly turning to online channels to purchase fresh produce like apples. Online platforms offer a wide selection of apple varieties, including specialty and organic options, with the added convenience of doorstep delivery. Additionally, the COVID-19 pandemic has accelerated the shift towards online shopping as consumers prioritize safety and contactless transactions. Furthermore, online platforms provide opportunities for personalized recommendations, subscription services, and targeted promotions, catering to the diverse preferences of consumers seeking convenient and accessible options for purchasing apples. As a result, the Online segment of the Apple Market is experiencing rapid growth, reshaping the landscape of consumer purchasing habits and driving innovation in digital marketing strategies within the agricultural industry.
Apple Market Segmentation
By Type
Red apple
Granny smith and Golden apples
By Distribution Channel
Offline
Online
Countries Analyzed
North America (US, Canada, Mexico)
Europe (Germany, UK, France, Spain, Italy, Russia, Rest of Europe)
Asia Pacific (China, India, Japan, South Korea, Australia, South East Asia, Rest of Asia)
South America (Brazil, Argentina, Rest of South America)
Middle East and Africa (Saudi Arabia, UAE, Rest of Middle East, South Africa, Egypt, Rest of Africa)
Apple Companies Profiled in the Study
Batlow Fruit Co. Pty Ltd
CMI Orchards LLC
Evans Fruit Co
Fowler Farms Ltd
Fruit Hill Orchard Inc
Gebbers Farms
Gilbert Orchards
Golden Bay Fruit
Harmonie
Hope Orchards
Mercier Orchards
Rice Fruit Co.
Roche Fruit LLC
Shenandoah Valley Orchards
Stemilt Growers LLC
Symms Fruit Ranch Inc
Washington Fruit Growers
*- List Not Exhaustive
Chapter 1. TABLE OF CONTENTS
Chapter 2. Introduction to Apple Market
2.1. Market Overview
2.2. Key Statistics and Report Highlights
2.3. Scope of the Comprehensive Study
2.3.1. Market Definition
2.3.2 Countries and Regions Covered
2.3.3 Research Objective
2.3.4 Units, Currency, and Conversions
2.3.5 Industry Value Chain
2.4. Key Market Segments
2.5. Key Companies
2.6. Study Period
Chapter 3. Strategic Analysis Review
3.1. Apple Pricing Analysis and Forecast
3.2. Porter’s Five Forces
3.3. Market Ecosystem
3.4. SWOT Analysis
3.5. Regulatory Scenario
3.3. Effects of Inflation, Russia-Ukraine War, moderating economic growth, and other macroeconomic factors
Chapter 4. Competitive Landscape
4.1. Market Share Analysis
4.1.1. Global Apple Market Share by Company, 2023
4.1.2. Product Offerings of Leading Apple Companies
4.2. Market Entropy
4.2.1. New Product Launches in the Industry
4.2.2. Mergers, Acquisitions, Joint ventures, and Partnerships
4.3. Key Strategies and Best Practices
Chapter 5. Global Market Projections: Best, Reference, and Low Case Scenarios
5.1. Growth Analysis- Case Scenario Definitions
5.2. Low Growth Case Scenario Forecasts
5.3. Reference Growth Case Scenario Forecasts
5.4. High Growth Case Scenario Forecasts
Chapter 6. Market Dynamics
6.1. Apple Market Drivers
6.2. Apple Market Challenges
6.6. Apple Market Opportunities
6.4. Apple Market Trends
Chapter 7. Global Apple Market Outlook Trends
7.1. Global Apple Revenue (USD Million) and CAGR (%) by Type (2021-2032)
7.2. Global Apple Revenue (USD Million) and CAGR (%) by Application (2021-2032)
7.3. Global Apple Revenue (USD Million) and CAGR (%) by Product (2021-2032)
By Type
Red apple
Granny smith and Golden apples
By Distribution Channel
Offline
Online
Chapter 8. Global Apple Regional Analysis and Outlook
8.1. Global Apple Revenue (USD Million) By Regions (2021- 2032)
8.2. North America Apple Revenue (USD Million) by Country (2021-2032)
8.2.1. United States Apple Regional Analysis and Outlook
8.2.2. Canada Apple Regional Analysis and Outlook
8.2.3. Mexico Apple Regional Analysis and Outlook
8.3. Europe Apple Revenue (USD Million), by Country (2021-2032)
8.3.1. Germany Apple Regional Analysis and Outlook
8.3.2. France Apple Regional Analysis and Outlook
8.3.3. United Kingdom Apple Regional Analysis and Outlook
8.3.4. Spain Apple Regional Analysis and Outlook
8.3.5. Italy Apple Regional Analysis and Outlook
8.3.6. Russia Apple Regional Analysis and Outlook
8.3.7. Rest of Europe Apple Regional Analysis and Outlook
8.4. Asia Pacific Apple Revenue (USD Million) by Country (2021-2032)
8.4.1. China Apple Regional Analysis and Outlook
8.4.2. Japan Apple Regional Analysis and Outlook
8.4.3. India Apple Regional Analysis and Outlook
8.4.4. South Korea Apple Regional Analysis and Outlook
8.4.5. Australia Apple Regional Analysis and Outlook
8.4.6. South East Asia Apple Regional Analysis and Outlook
8.4.7. Rest of Asia Pacific Apple Regional Analysis and Outlook
8.5. South America Apple Revenue (USD Million), by Country (2021-2032)
8.5.1. Brazil Apple Regional Analysis and Outlook
8.5.2. Argentina Apple Regional Analysis and Outlook
8.5.3. Rest of South America Apple Regional Analysis and Outlook
8.6. Middle East and Africa Apple Revenue (USD Million) by Country (2021-2032)
8.6.1. Middle East Apple Regional Analysis and Outlook
8.6.2. Africa Apple Regional Analysis and Outlook
Chapter 9. North America Apple Analysis and Outlook
9.1. North America Apple Revenue (USD Million) by Segments (2021-2032)
9.1.1. North America Apple Revenue (USD Million) by Type (2021-2032)
9.1.2. North America Apple Revenue (USD Million) by Application (2021-2032)
9.1.3. North America Apple Revenue (USD Million) by Product (2021-2032)
By Type
Red apple
Granny smith and Golden apples
By Distribution Channel
Offline
Online
Chapter 10. Europe Apple Analysis and Outlook
10.1. Europe Apple Revenue (USD Million), by Segments (USD Million) (2021-2032)
10.1.1. Europe Apple Revenue (USD Million) by Type (2021-2032)
10.1.2. Europe Apple Revenue (USD Million) by Application (2021-2032)
10.1.3. Europe Apple Revenue (USD Million) by Product (2021-2032)
By Type
Red apple
Granny smith and Golden apples
By Distribution Channel
Offline
Online
Chapter 11. Asia Pacific Apple Analysis and Outlook
11.1. Asia Pacific Apple Revenue (USD Million), and Revenue (USD Million) by Segments (2021-2032)
11.1.1. Asia Pacific Apple Revenue (USD Million) by Type (2021-2032)
11.1.2. Asia Pacific Apple Revenue (USD Million) by Application (2021-2032)
11.1.3. Asia Pacific Apple Revenue (USD Million) by Product (2021-2032)
By Type
Red apple
Granny smith and Golden apples
By Distribution Channel
Offline
Online
Chapter 12. South America Apple Analysis and Outlook
12.1. South America Apple Revenue (USD Million), by Segments (2021-2032)
12.1.1. South America Apple Revenue (USD Million) by Type (2021-2032)
12.1.2. South America Apple Revenue (USD Million) by Application (2021-2032)
12.1.3. South America Apple Revenue (USD Million) by Product (2021-2032)
By Type
Red apple
Granny smith and Golden apples
By Distribution Channel
Offline
Online
Chapter 13. Middle East and Africa Apple Analysis and Outlook
13.1. Middle East and Africa Apple Revenue (USD Million), by Segments (2021-2032)
13.1.1. Middle East and Africa Apple Revenue (USD Million) by Type (2021-2032)
13.1.2. Middle East and Africa Apple Revenue (USD Million) by Application (2021-2032)
13.1.3. Middle East and Africa Apple Revenue (USD Million) by Product (2021-2032)
By Type
Red apple
Granny smith and Golden apples
By Distribution Channel
Offline
Online
Chapter 14. Apple Company Profiles
14.1 Business Overview
14.2 Product Profiles
14.3 SWOT Profiles
14.5 Recent Developments
14.6 Financial Profile
List of Companies
Batlow Fruit Co. Pty Ltd
CMI Orchards LLC
Evans Fruit Co
Fowler Farms Ltd
Fruit Hill Orchard Inc
Gebbers Farms
Gilbert Orchards
Golden Bay Fruit
Harmonie
Hope Orchards
Mercier Orchards
Rice Fruit Co.
Roche Fruit LLC
Shenandoah Valley Orchards
Stemilt Growers LLC
Symms Fruit Ranch Inc
Washington Fruit Growers
15. Methodology and Data Sources
15.1 Customization Offerings
15.2 Subscription Services
15.3 Related Reports
15.4 Publisher Expertise
LIST OF TABLES
Table 1 Market Segmentation Analysis
Table 2 Global Apple Market Share of Leading Companies, 2023
Table 3 Product Offerings of Leading Companies
Table 4 Low Growth Scenario Forecasts
Table 5 Reference Case Growth Scenario
Table 6 High Growth Case Scenario
Table 7 Global Apple Revenue (USD Million) And CAGR (%) By Type (2021-2032)
Table 8 Global Apple Revenue (USD Million) And CAGR (%) By Application (2021-2032)
Table 9 Global Apple Revenue (USD Million) And CAGR (%) By Product (2021-2032)
Table 10 Global Apple Market Revenue (USD Million) By Regions (2021-2032)
Table 11 Global Apple Market Share (%) By Regions (2021-2032)
Table 12 North America Apple Revenue (USD Million) By Country (2021-2032)
Table 13 Europe Apple Revenue (USD Million) By Country (2021-2032)
Table 14 Asia Pacific Apple Revenue (USD Million) By Country (2021-2032)
Table 15 South America Apple Revenue (USD Million) By Country (2021-2032)
Table 16 Middle East and Africa Apple Revenue (USD Million) By Region (2021-2032)
Table 17 North America Apple Revenue (USD Million) By Type (2021-2032)
Table 18 North America Apple Revenue (USD Million) By Application (2021-2032)
Table 19 North America Apple Revenue (USD Million) By Product (2021-2032)
Table 20 Europe Apple Revenue (USD Million) By Type (2021-2032)
Table 21 Europe Apple Revenue (USD Million) By Application (2021-2032)
Table 22 Europe Apple Revenue (USD Million) By Product (2021-2032)
Table 23 Asia Pacific Apple Revenue (USD Million) By Type (2021-2032)
Table 24 Asia Pacific Apple Revenue (USD Million) By Application (2021-2032)
Table 25 Asia Pacific Apple Revenue (USD Million) By Product (2021-2032)
Table 26 South America Apple Revenue (USD Million) By Type (2021-2032)
Table 27 South America Apple Revenue (USD Million) By Application (2021-2032)
Table 28 South America Apple Revenue (USD Million) By Product (2021-2032)
Table 29 Middle East and Africa Apple Revenue (USD Million) By Type (2021-2032)
Table 30 Middle East and Africa Apple Revenue (USD Million) By Application (2021-2032)
Table 31 Middle East and Africa Apple Revenue (USD Million) By Product (2021-2032)
LIST OF FIGURES
Figure 1. Market Scope
Figure 2. Pricing Forecasts Per Unit, 2023- 2032
Figure 3. Porter’s Five Forces
Figure 4. Global Apple Market Revenue (USD Million) By Regions (2021-2032)
Figure 5. Global Apple Market Share (%) By Regions (2023)
Figure 6. North America Apple Revenue (USD Million) By Country (2021-2032)
Figure 7. United States Apple Revenue (USD Million) By Country (2021-2032)
Figure 8. Canada Apple Revenue (USD Million) By Country (2021-2032)
Figure 9. Mexico Apple Revenue (USD Million) By Country (2021-2032)
Figure 10. Europe Apple Revenue (USD Million) By Country (2021-2032)
Figure 11. Germany Apple Revenue (USD Million) By Country (2021-2032)
Figure 12. France Apple Revenue (USD Million) By Country (2021-2032)
Figure 13. United Kingdom Apple Revenue (USD Million) By Country (2021-2032)
Figure 14. Spain Apple Revenue (USD Million) By Country (2021-2032)
Figure 15. Italy Apple Revenue (USD Million) By Country (2021-2032)
Figure 16. Russia Apple Revenue (USD Million) By Country (2021-2032)
Figure 17. Rest of Europe Apple Revenue (USD Million) By Country (2021-2032)
Figure 11. Asia Pacific Apple Revenue (USD Million) By Country (2021-2032)
Figure 12. China Apple Revenue (USD Million) By Country (2021-2032)
Figure 13. Japan Apple Revenue (USD Million) By Country (2021-2032)
Figure 14. India Apple Revenue (USD Million) By Country (2021-2032)
Figure 15. South Korea Apple Revenue (USD Million) By Country (2021-2032)
Figure 16. Australia Apple Revenue (USD Million) By Country (2021-2032)
Figure 17. South East Asia Apple Revenue (USD Million) By Country (2021-2032)
Figure 18. South America Apple Revenue (USD Million) By Country (2021-2032)
Figure 19. Brazil Apple Revenue (USD Million) By Country (2021-2032)
Figure 20. Argentina Apple Revenue (USD Million) By Country (2021-2032)
Figure 21. Rest of Asia Pacific Apple Revenue (USD Million) By Country (2021-2032)
Figure 22. Middle East and Africa Apple Revenue (USD Million) By Region (2021-2032)
Figure 23. Saudi Arabia Apple Revenue (USD Million) By Region (2021-2032)
Figure 24. The UAE Apple Revenue (USD Million) By Region (2021-2032)
Figure 25. Rest of Middle East Apple Revenue (USD Million) By Region (2021-2032)
Figure 26. South Africa Apple Revenue (USD Million) By Region (2021-2032)
Figure 27. Africa Apple Revenue (USD Million) By Region (2021-2032)
Figure 28. North America Apple Revenue (USD Million) By Type (2021-2032)
Figure 29. North America Apple Revenue (USD Million) By Application (2021-2032)
Figure 30. North America Apple Revenue (USD Million) By Product (2021-2032)
Figure 31. Europe Apple Revenue (USD Million) By Type (2021-2032)
Figure 32. Europe Apple Revenue (USD Million) By Application (2021-2032)
Figure 33. Europe Apple Revenue (USD Million) By Product (2021-2032)
Figure 34. Asia Pacific Apple Revenue (USD Million) By Type (2021-2032)
Figure 35. Asia Pacific Apple Revenue (USD Million) By Application (2021-2032)
Figure 36. Asia Pacific Apple Revenue (USD Million) By Product (2021-2032)
Figure 37. South America Apple Revenue (USD Million) By Type (2021-2032)
Figure 38. South America Apple Revenue (USD Million) By Application (2021-2032)
Figure 39. South America Apple Revenue (USD Million) By Product (2021-2032)
Figure 40. Middle East and Africa Apple Revenue (USD Million) By Type (2021-2032)
Figure 41. Middle East and Africa Apple Revenue (USD Million) By Application (2021-2032)
Figure 42. Middle East and Africa Apple Revenue (USD Million) By Product (2021-2032)
By Type
Red apple
Granny smith and Golden apples
By Distribution Channel
Offline
Online
Countries Analyzed
North America (US, Canada, Mexico)
Europe (Germany, UK, France, Spain, Italy, Russia, Rest of Europe)
Asia Pacific (China, India, Japan, South Korea, Australia, South East Asia, Rest of Asia)
South America (Brazil, Argentina, Rest of South America)
Middle East and Africa (Saudi Arabia, UAE, Rest of Middle East, South Africa, Egypt, Rest of Africa)
