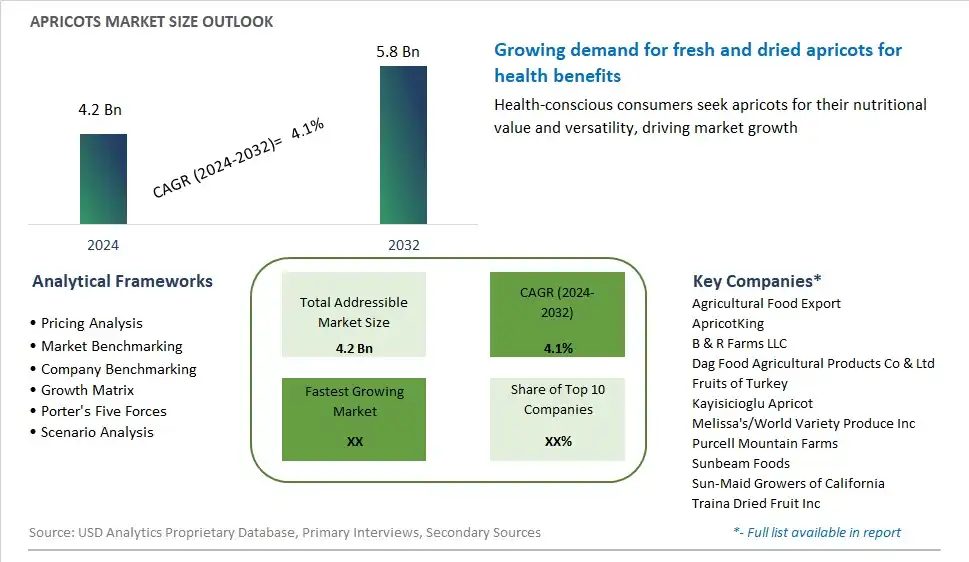
Global Apricots Market Size is valued at $4.2 Billion in 2024 and is forecast to register a growth rate (CAGR) of 4.1% to reach $5.8 Billion by 2032.
The global Apricots Market Comprehensive Study analyzes and forecasts the market size across 6 regions and 24 countries for diverse segments -By Product (Conventional, Organic)
An Introduction to Apricots Market
The apricots market in 2024 is characterized by its global presence and seasonal availability, with apricots being cultivated in diverse regions around the world and enjoyed for their sweet-tart flavor and nutritional benefits. Apricots are highly versatile fruits used in various culinary applications, including fresh consumption, jams, preserves, sauces, desserts, and dried snacks. With their vibrant color, juicy texture, and rich aroma, fresh apricots are prized for their freshness and taste during the peak harvesting season. Moreover, dried apricots are popular year-round as a convenient and nutritious snack, providing fiber, vitamins, and antioxidants. As consumer preferences shift towards healthier and more natural foods, there's a growing demand for organic and sustainably grown apricots, driving trends in responsible agriculture and transparent supply chains. Additionally, technological advancements in post-harvest handling, storage, and transportation are extending the shelf life and market reach of fresh apricots, enabling wider availability and consumption. In 2024, the apricots market is poised for continued growth and diversification, supported by innovation, consumer demand for fresh and minimally processed foods, and global trade opportunities.
Apricots Competitive Landscape
The market report analyses the leading companies in the industry including Agricultural Food Export, ApricotKing, B & R Farms LLC, Dag Food Agricultural Products Co & Ltd, Fruits of Turkey, Kayisicioglu Apricot, Melissa's/World Variety Produce Inc, Purcell Mountain Farms, Sunbeam Foods, Sun-Maid Growers of California, Traina Dried Fruit Inc, and Others.
Apricots Market Dynamics
Apricots Market Trend: Increasing Demand for Healthy and Natural Snack Options
A significant trend in the apricots market is the increasing demand for healthy and natural snack options. As consumers prioritize health and wellness, there is a growing interest in nutritious and convenient snacks that offer both great taste and nutritional benefits, positioning apricots as a popular choice. Apricots are naturally rich in vitamins, minerals, fiber, and antioxidants, making them a wholesome snack choice that satisfies cravings while providing essential nutrients. This trend is driven by the shift towards mindful eating habits, the rise of on-the-go lifestyles, and the desire for clean label, minimally processed foods, reflecting evolving consumer preferences towards healthier snacking alternatives.
Market Driver: Expansion of Food Processing and Packaging Technologies
A key driver shaping the apricots market is the expansion of food processing and packaging technologies. Advancements in processing techniques such as freeze-drying, vacuum drying, and air-drying enable apricot producers to preserve the fruit's natural flavor, color, and nutritional content while extending its shelf life. Additionally, innovations in packaging materials and formats such as resealable pouches, single-serve packs, and portion-controlled snacks enhance convenience, portability, and shelf stability, driving consumer appeal and market accessibility. This driver is fueled by the need to meet consumer demand for convenient, ready-to-eat snacks that offer freshness, quality, and convenience, as well as the competitive landscape of the snacking industry, driving innovation and differentiation in product offerings.
Market Opportunity: Diversification into Value-Added Products and Ingredients
An opportunity for growth in the apricots market lies in diversification into value-added products and ingredients. Beyond fresh and dried apricots, there is potential to expand the market by introducing apricot-based products such as jams, preserves, sauces, spreads, juices, and fruit bars. These value-added products offer versatility and culinary versatility, appealing to consumers seeking flavor variety and convenience in their food choices. Additionally, there is opportunity to leverage apricots as ingredients in other food and beverage categories such as bakery, confectionery, dairy, and snacks, adding natural sweetness, texture, and nutritional value to a wide range of formulations. By exploring new product categories and applications, apricot producers can capitalize on consumer demand for innovative and nutritious food options, driving growth and profitability in the market.
Apricots Market Share Analysis: Conventional held the dominant market share in 2024
The Conventional segment dominates the Apricots Market as the largest segment due to its wider availability, lower price point, and longstanding presence in the market. Conventional apricots are cultivated using conventional farming methods, which often involve the use of synthetic fertilizers, pesticides, and herbicides to maximize yield and protect against pests and diseases. This results in higher production volumes and lower production costs compared to organic apricots, making conventional apricots more accessible and affordable to consumers across various demographics. Further, conventional apricots are typically sold in larger quantities and have a longer shelf life, further contributing to their popularity among retailers and consumers. While organic apricots appeal to a niche market segment seeking environmentally sustainable and pesticide-free options, the broader consumer base and established supply chains of conventional apricots ensure their dominance in the Apricots Market.
Apricots Market Segmentation
By Product
Conventional
Organic
Countries Analyzed
North America (US, Canada, Mexico)
Europe (Germany, UK, France, Spain, Italy, Russia, Rest of Europe)
Asia Pacific (China, India, Japan, South Korea, Australia, South East Asia, Rest of Asia)
South America (Brazil, Argentina, Rest of South America)
Middle East and Africa (Saudi Arabia, UAE, Rest of Middle East, South Africa, Egypt, Rest of Africa)
Apricots Companies Profiled in the Study
Agricultural Food Export
ApricotKing
B & R Farms LLC
Dag Food Agricultural Products Co & Ltd
Fruits of Turkey
Kayisicioglu Apricot
Melissa's/World Variety Produce Inc
Purcell Mountain Farms
Sunbeam Foods
Sun-Maid Growers of California
Traina Dried Fruit Inc
*- List Not Exhaustive
Chapter 1. TABLE OF CONTENTS
Chapter 2. Introduction to Apricots Market
2.1. Market Overview
2.2. Key Statistics and Report Highlights
2.3. Scope of the Comprehensive Study
2.3.1. Market Definition
2.3.2 Countries and Regions Covered
2.3.3 Research Objective
2.3.4 Units, Currency, and Conversions
2.3.5 Industry Value Chain
2.4. Key Market Segments
2.5. Key Companies
2.6. Study Period
Chapter 3. Strategic Analysis Review
3.1. Apricots Pricing Analysis and Forecast
3.2. Porter’s Five Forces
3.3. Market Ecosystem
3.4. SWOT Analysis
3.5. Regulatory Scenario
3.3. Effects of Inflation, Russia-Ukraine War, moderating economic growth, and other macroeconomic factors
Chapter 4. Competitive Landscape
4.1. Market Share Analysis
4.1.1. Global Apricots Market Share by Company, 2023
4.1.2. Product Offerings of Leading Apricots Companies
4.2. Market Entropy
4.2.1. New Product Launches in the Industry
4.2.2. Mergers, Acquisitions, Joint ventures, and Partnerships
4.3. Key Strategies and Best Practices
Chapter 5. Global Market Projections: Best, Reference, and Low Case Scenarios
5.1. Growth Analysis- Case Scenario Definitions
5.2. Low Growth Case Scenario Forecasts
5.3. Reference Growth Case Scenario Forecasts
5.4. High Growth Case Scenario Forecasts
Chapter 6. Market Dynamics
6.1. Apricots Market Drivers
6.2. Apricots Market Challenges
6.6. Apricots Market Opportunities
6.4. Apricots Market Trends
Chapter 7. Global Apricots Market Outlook Trends
7.1. Global Apricots Revenue (USD Million) and CAGR (%) by Type (2021-2032)
7.2. Global Apricots Revenue (USD Million) and CAGR (%) by Application (2021-2032)
7.3. Global Apricots Revenue (USD Million) and CAGR (%) by Product (2021-2032)
By Product
Conventional
Organic
Chapter 8. Global Apricots Regional Analysis and Outlook
8.1. Global Apricots Revenue (USD Million) By Regions (2021- 2032)
8.2. North America Apricots Revenue (USD Million) by Country (2021-2032)
8.2.1. United States Apricots Regional Analysis and Outlook
8.2.2. Canada Apricots Regional Analysis and Outlook
8.2.3. Mexico Apricots Regional Analysis and Outlook
8.3. Europe Apricots Revenue (USD Million), by Country (2021-2032)
8.3.1. Germany Apricots Regional Analysis and Outlook
8.3.2. France Apricots Regional Analysis and Outlook
8.3.3. United Kingdom Apricots Regional Analysis and Outlook
8.3.4. Spain Apricots Regional Analysis and Outlook
8.3.5. Italy Apricots Regional Analysis and Outlook
8.3.6. Russia Apricots Regional Analysis and Outlook
8.3.7. Rest of Europe Apricots Regional Analysis and Outlook
8.4. Asia Pacific Apricots Revenue (USD Million) by Country (2021-2032)
8.4.1. China Apricots Regional Analysis and Outlook
8.4.2. Japan Apricots Regional Analysis and Outlook
8.4.3. India Apricots Regional Analysis and Outlook
8.4.4. South Korea Apricots Regional Analysis and Outlook
8.4.5. Australia Apricots Regional Analysis and Outlook
8.4.6. South East Asia Apricots Regional Analysis and Outlook
8.4.7. Rest of Asia Pacific Apricots Regional Analysis and Outlook
8.5. South America Apricots Revenue (USD Million), by Country (2021-2032)
8.5.1. Brazil Apricots Regional Analysis and Outlook
8.5.2. Argentina Apricots Regional Analysis and Outlook
8.5.3. Rest of South America Apricots Regional Analysis and Outlook
8.6. Middle East and Africa Apricots Revenue (USD Million) by Country (2021-2032)
8.6.1. Middle East Apricots Regional Analysis and Outlook
8.6.2. Africa Apricots Regional Analysis and Outlook
Chapter 9. North America Apricots Analysis and Outlook
9.1. North America Apricots Revenue (USD Million) by Segments (2021-2032)
9.1.1. North America Apricots Revenue (USD Million) by Type (2021-2032)
9.1.2. North America Apricots Revenue (USD Million) by Application (2021-2032)
9.1.3. North America Apricots Revenue (USD Million) by Product (2021-2032)
By Product
Conventional
Organic
Chapter 10. Europe Apricots Analysis and Outlook
10.1. Europe Apricots Revenue (USD Million), by Segments (USD Million) (2021-2032)
10.1.1. Europe Apricots Revenue (USD Million) by Type (2021-2032)
10.1.2. Europe Apricots Revenue (USD Million) by Application (2021-2032)
10.1.3. Europe Apricots Revenue (USD Million) by Product (2021-2032)
By Product
Conventional
Organic
Chapter 11. Asia Pacific Apricots Analysis and Outlook
11.1. Asia Pacific Apricots Revenue (USD Million), and Revenue (USD Million) by Segments (2021-2032)
11.1.1. Asia Pacific Apricots Revenue (USD Million) by Type (2021-2032)
11.1.2. Asia Pacific Apricots Revenue (USD Million) by Application (2021-2032)
11.1.3. Asia Pacific Apricots Revenue (USD Million) by Product (2021-2032)
By Product
Conventional
Organic
Chapter 12. South America Apricots Analysis and Outlook
12.1. South America Apricots Revenue (USD Million), by Segments (2021-2032)
12.1.1. South America Apricots Revenue (USD Million) by Type (2021-2032)
12.1.2. South America Apricots Revenue (USD Million) by Application (2021-2032)
12.1.3. South America Apricots Revenue (USD Million) by Product (2021-2032)
By Product
Conventional
Organic
Chapter 13. Middle East and Africa Apricots Analysis and Outlook
13.1. Middle East and Africa Apricots Revenue (USD Million), by Segments (2021-2032)
13.1.1. Middle East and Africa Apricots Revenue (USD Million) by Type (2021-2032)
13.1.2. Middle East and Africa Apricots Revenue (USD Million) by Application (2021-2032)
13.1.3. Middle East and Africa Apricots Revenue (USD Million) by Product (2021-2032)
By Product
Conventional
Organic
Chapter 14. Apricots Company Profiles
14.1 Business Overview
14.2 Product Profiles
14.3 SWOT Profiles
14.5 Recent Developments
14.6 Financial Profile
List of Companies
Agricultural Food Export
ApricotKing
B & R Farms LLC
Dag Food Agricultural Products Co & Ltd
Fruits of Turkey
Kayisicioglu Apricot
Melissa's/World Variety Produce Inc
Purcell Mountain Farms
Sunbeam Foods
Sun-Maid Growers of California
Traina Dried Fruit Inc
15. Methodology and Data Sources
15.1 Customization Offerings
15.2 Subscription Services
15.3 Related Reports
15.4 Publisher Expertise
LIST OF TABLES
Table 1 Market Segmentation Analysis
Table 2 Global Apricots Market Share of Leading Companies, 2023
Table 3 Product Offerings of Leading Companies
Table 4 Low Growth Scenario Forecasts
Table 5 Reference Case Growth Scenario
Table 6 High Growth Case Scenario
Table 7 Global Apricots Revenue (USD Million) And CAGR (%) By Type (2021-2032)
Table 8 Global Apricots Revenue (USD Million) And CAGR (%) By Application (2021-2032)
Table 9 Global Apricots Revenue (USD Million) And CAGR (%) By Product (2021-2032)
Table 10 Global Apricots Market Revenue (USD Million) By Regions (2021-2032)
Table 11 Global Apricots Market Share (%) By Regions (2021-2032)
Table 12 North America Apricots Revenue (USD Million) By Country (2021-2032)
Table 13 Europe Apricots Revenue (USD Million) By Country (2021-2032)
Table 14 Asia Pacific Apricots Revenue (USD Million) By Country (2021-2032)
Table 15 South America Apricots Revenue (USD Million) By Country (2021-2032)
Table 16 Middle East and Africa Apricots Revenue (USD Million) By Region (2021-2032)
Table 17 North America Apricots Revenue (USD Million) By Type (2021-2032)
Table 18 North America Apricots Revenue (USD Million) By Application (2021-2032)
Table 19 North America Apricots Revenue (USD Million) By Product (2021-2032)
Table 20 Europe Apricots Revenue (USD Million) By Type (2021-2032)
Table 21 Europe Apricots Revenue (USD Million) By Application (2021-2032)
Table 22 Europe Apricots Revenue (USD Million) By Product (2021-2032)
Table 23 Asia Pacific Apricots Revenue (USD Million) By Type (2021-2032)
Table 24 Asia Pacific Apricots Revenue (USD Million) By Application (2021-2032)
Table 25 Asia Pacific Apricots Revenue (USD Million) By Product (2021-2032)
Table 26 South America Apricots Revenue (USD Million) By Type (2021-2032)
Table 27 South America Apricots Revenue (USD Million) By Application (2021-2032)
Table 28 South America Apricots Revenue (USD Million) By Product (2021-2032)
Table 29 Middle East and Africa Apricots Revenue (USD Million) By Type (2021-2032)
Table 30 Middle East and Africa Apricots Revenue (USD Million) By Application (2021-2032)
Table 31 Middle East and Africa Apricots Revenue (USD Million) By Product (2021-2032)
LIST OF FIGURES
Figure 1. Market Scope
Figure 2. Pricing Forecasts Per Unit, 2023- 2032
Figure 3. Porter’s Five Forces
Figure 4. Global Apricots Market Revenue (USD Million) By Regions (2021-2032)
Figure 5. Global Apricots Market Share (%) By Regions (2023)
Figure 6. North America Apricots Revenue (USD Million) By Country (2021-2032)
Figure 7. United States Apricots Revenue (USD Million) By Country (2021-2032)
Figure 8. Canada Apricots Revenue (USD Million) By Country (2021-2032)
Figure 9. Mexico Apricots Revenue (USD Million) By Country (2021-2032)
Figure 10. Europe Apricots Revenue (USD Million) By Country (2021-2032)
Figure 11. Germany Apricots Revenue (USD Million) By Country (2021-2032)
Figure 12. France Apricots Revenue (USD Million) By Country (2021-2032)
Figure 13. United Kingdom Apricots Revenue (USD Million) By Country (2021-2032)
Figure 14. Spain Apricots Revenue (USD Million) By Country (2021-2032)
Figure 15. Italy Apricots Revenue (USD Million) By Country (2021-2032)
Figure 16. Russia Apricots Revenue (USD Million) By Country (2021-2032)
Figure 17. Rest of Europe Apricots Revenue (USD Million) By Country (2021-2032)
Figure 11. Asia Pacific Apricots Revenue (USD Million) By Country (2021-2032)
Figure 12. China Apricots Revenue (USD Million) By Country (2021-2032)
Figure 13. Japan Apricots Revenue (USD Million) By Country (2021-2032)
Figure 14. India Apricots Revenue (USD Million) By Country (2021-2032)
Figure 15. South Korea Apricots Revenue (USD Million) By Country (2021-2032)
Figure 16. Australia Apricots Revenue (USD Million) By Country (2021-2032)
Figure 17. South East Asia Apricots Revenue (USD Million) By Country (2021-2032)
Figure 18. South America Apricots Revenue (USD Million) By Country (2021-2032)
Figure 19. Brazil Apricots Revenue (USD Million) By Country (2021-2032)
Figure 20. Argentina Apricots Revenue (USD Million) By Country (2021-2032)
Figure 21. Rest of Asia Pacific Apricots Revenue (USD Million) By Country (2021-2032)
Figure 22. Middle East and Africa Apricots Revenue (USD Million) By Region (2021-2032)
Figure 23. Saudi Arabia Apricots Revenue (USD Million) By Region (2021-2032)
Figure 24. The UAE Apricots Revenue (USD Million) By Region (2021-2032)
Figure 25. Rest of Middle East Apricots Revenue (USD Million) By Region (2021-2032)
Figure 26. South Africa Apricots Revenue (USD Million) By Region (2021-2032)
Figure 27. Africa Apricots Revenue (USD Million) By Region (2021-2032)
Figure 28. North America Apricots Revenue (USD Million) By Type (2021-2032)
Figure 29. North America Apricots Revenue (USD Million) By Application (2021-2032)
Figure 30. North America Apricots Revenue (USD Million) By Product (2021-2032)
Figure 31. Europe Apricots Revenue (USD Million) By Type (2021-2032)
Figure 32. Europe Apricots Revenue (USD Million) By Application (2021-2032)
Figure 33. Europe Apricots Revenue (USD Million) By Product (2021-2032)
Figure 34. Asia Pacific Apricots Revenue (USD Million) By Type (2021-2032)
Figure 35. Asia Pacific Apricots Revenue (USD Million) By Application (2021-2032)
Figure 36. Asia Pacific Apricots Revenue (USD Million) By Product (2021-2032)
Figure 37. South America Apricots Revenue (USD Million) By Type (2021-2032)
Figure 38. South America Apricots Revenue (USD Million) By Application (2021-2032)
Figure 39. South America Apricots Revenue (USD Million) By Product (2021-2032)
Figure 40. Middle East and Africa Apricots Revenue (USD Million) By Type (2021-2032)
Figure 41. Middle East and Africa Apricots Revenue (USD Million) By Application (2021-2032)
Figure 42. Middle East and Africa Apricots Revenue (USD Million) By Product (2021-2032)
By Product
Conventional
Organic
Countries Analyzed
North America (US, Canada, Mexico)
Europe (Germany, UK, France, Spain, Italy, Russia, Rest of Europe)
Asia Pacific (China, India, Japan, South Korea, Australia, South East Asia, Rest of Asia)
South America (Brazil, Argentina, Rest of South America)
Middle East and Africa (Saudi Arabia, UAE, Rest of Middle East, South Africa, Egypt, Rest of Africa)
