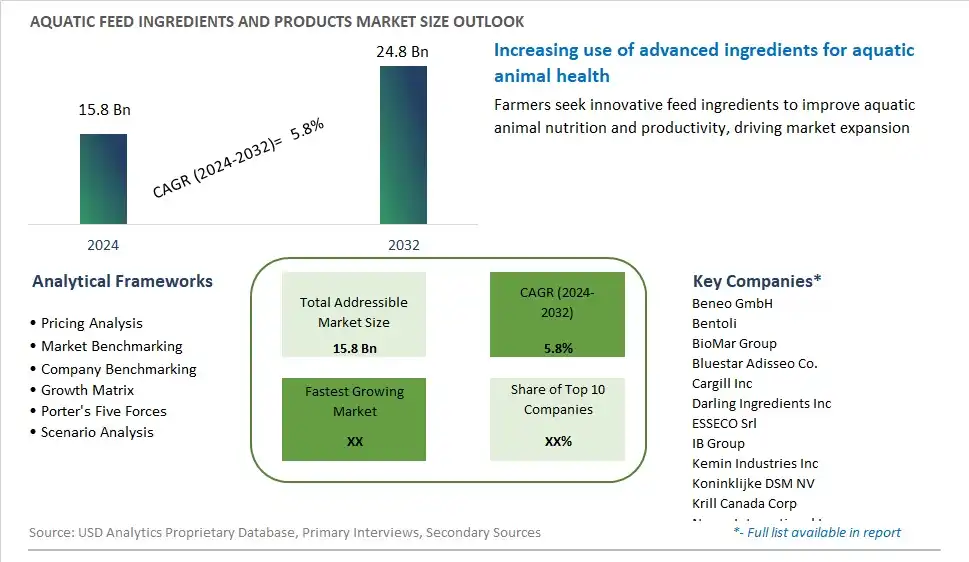
Global Aquatic Feed Ingredients and Products Market Size is valued at $15.8 Billion in 2024 and is forecast to register a growth rate (CAGR) of 5.8% to reach $24.8 Billion by 2032.
The global Aquatic Feed Ingredients and Products Market Comprehensive Study analyzes and forecasts the market size across 6 regions and 24 countries for diverse segments -By Product (Soybean, Fish meal and fish oil, Corn/Maize, Others), By Type (Fishes, Crustaceans, Others)
An Introduction to Aquatic Feed Ingredients and Products Market
In 2024, the aquatic feed ingredients and products market is witnessing robust growth and innovation as the aquaculture industry continues to expand to meet the growing demand for seafood products globally. Aquatic feed ingredients play a critical role in formulating nutritionally balanced diets for farmed fish, crustaceans, and mollusks, providing essential nutrients, proteins, lipids, vitamins, and minerals for optimal growth, health, and productivity. With increasing consumer awareness of the health benefits of seafood and sustainable aquaculture practices, there's a growing demand for high-quality and responsibly sourced feed ingredients that meet nutritional requirements while minimizing environmental impact. Manufacturers are exploring a diverse range of aquatic feed ingredients, including fishmeal alternatives, plant-based proteins, marine microalgae, and functional additives such as probiotics and enzymes, to optimize feed formulations for different species and production systems. Moreover, advancements in ingredient sourcing, processing, and formulation technologies are driving innovation in aquatic feed products, offering solutions for improved feed efficiency, disease resistance, and environmental sustainability. As aquaculture production continues to expand and diversify, the aquatic feed ingredients and products market is poised for sustained growth and development in 2024, with opportunities for collaboration, investment, and market differentiation across the value chain.
Aquatic Feed Ingredients and Products Competitive Landscape
The market report analyses the leading companies in the industry including Beneo GmbH, Bentoli, BioMar Group, Bluestar Adisseo Co., Cargill Inc, Darling Ingredients Inc, ESSECO Srl, IB Group, Kemin Industries Inc, Koninklijke DSM NV, Krill Canada Corp, Novus International Inc, Nutreco N.V., Ridley Corp Ltd, Uniscope Inc, UNO FEEDS, VST LLC dba Prairie Aquatech, and Others.
Aquatic Feed Ingredients and Products Market Dynamics
Aquatic Feed Ingredients and Products Market Trend: Increasing Demand for Sustainable and Nutrient-Rich Aquatic Feed Ingredients
There is a notable trend in the aquatic feed ingredients and products market towards an increasing demand for sustainable and nutrient-rich feed ingredients. With the aquaculture industry expanding to meet growing global seafood demand, there is a heightened emphasis on sourcing feed ingredients that are environmentally sustainable, economically viable, and nutritionally balanced. This trend is driven by consumer awareness of environmental concerns, regulatory pressures on aquafeed manufacturers, and industry initiatives promoting responsible sourcing practices. Aquatic feed ingredients derived from sustainable sources such as algae, insect meal, and plant proteins are gaining popularity due to their potential to reduce reliance on wild-caught fish stocks, minimize environmental impact, and enhance the nutritional quality of aquaculture feeds.
Market Driver: Growth of Aquaculture Industry and Rising Seafood Consumption
A key driver influencing the aquatic feed ingredients and products market is the growth of the aquaculture industry and rising seafood consumption. As global populations increase, dietary preferences shift towards protein-rich foods, and concerns over food security intensify, there is a growing demand for seafood products produced through aquaculture. Aquafeed serves as a critical component in supporting the growth and development of farmed aquatic species, ensuring optimal nutrition, health, and performance. This driver is fueled by the expanding aquaculture industry, technological advancements in aquafeed formulation and production, and the need to meet increasing seafood demand sustainably and efficiently. As aquaculture continues to grow as a primary source of seafood production, the demand for high-quality, cost-effective feed ingredients and products is expected to rise, driving market growth and innovation.
Market Opportunity: Innovation in Functional Feed Additives and Value-Added Products
An opportunity for growth in the aquatic feed ingredients and products market lies in innovation in functional feed additives and value-added products. Manufacturers can capitalize on the growing demand for specialized feed formulations that address specific health, performance, and environmental challenges in aquaculture production. This includes the development of functional feed additives such as probiotics, enzymes, immunostimulants, and phytogenics that promote gut health, disease resistance, and stress tolerance in farmed fish and shrimp. Additionally, there is potential for the creation of value-added aquafeed products such as fortified feeds, extruded pellets, and customized blends tailored to the nutritional requirements and production goals of different aquatic species and farming systems. By investing in research and development, partnering with academia and industry stakeholders, and leveraging technological advancements, manufacturers can unlock new opportunities for innovation and differentiation in the competitive aquatic feed ingredients and products market.
Aquatic Feed Ingredients and Products Market Share Analysis: Fish Meal and Fish Oil held the dominant market share in 2024
The Fish Meal and Fish Oil segment reigns as the largest within the Aquatic Feed Ingredients and Products Market due to its vital role in providing essential nutrients and proteins to aquatic species in aquaculture operations. Fish meal, derived from fish processing by-products and fish trimmings, serves as a high-quality protein source rich in amino acids, vitamins, and minerals crucial for fish growth and health. Similarly, fish oil extracted from oily fish species contains omega-3 fatty acids, such as EPA and DHA, essential for maintaining immune function, reproductive health, and overall fish vitality. These nutrients are fundamental for promoting optimal growth, feed efficiency, and disease resistance in cultured fish, making fish meal and fish oil indispensable ingredients in aquafeed formulations. Further, the consistent demand for fish meal and fish oil stems from the global expansion of aquaculture, which relies heavily on these marine-derived ingredients to meet the nutritional requirements of various fish and shrimp species cultivated in aquaculture systems. Additionally, advancements in fish meal and fish oil processing technologies, coupled with sustainable sourcing practices, contribute to the segment's dominance in the Aquatic Feed Ingredients and Products Market, ensuring the supply of high-quality and nutritious feed ingredients to support the growth and sustainability of the aquaculture industry.
Aquatic Feed Ingredients and Products Market Share Analysis: Crustaceans market is poised to register the fastest growth rae over the forecast period to 2032
The Crustaceans segment is the fastest-growing within the Aquatic Feed Ingredients and Products Market, driven by the increasing demand for feed formulations tailored to the nutritional needs of crustacean species in aquaculture. Crustaceans, such as shrimp, prawns, and crabs, are key contributors to global seafood production, with aquaculture playing a significant role in meeting the rising consumer demand. As crustacean aquaculture expands to address market demands, there is a growing emphasis on optimizing feed formulations to enhance growth performance, feed conversion efficiency, and disease resistance in farmed crustaceans. Consequently, there is a heightened demand for specialized feed ingredients and products specifically designed for crustacean species, including feed pellets, premixes, and additives. Further, advancements in aquafeed technology and the incorporation of novel ingredients, such as functional proteins, probiotics, and immune stimulants, further drive the growth of the Crustaceans segment by offering innovative solutions to improve crustacean health and production efficiency. Additionally, the increasing consumer preference for sustainably sourced and environmentally friendly aquafeed ingredients drives innovation and investment in crustacean feed formulations, contributing to the segment's rapid growth within the Aquatic Feed Ingredients and Products Market.
Aquatic Feed Ingredients and Products Market Segmentation
By Product
Soybean
Fish meal and fish oil
Corn/Maize
Others
By Type
Fishes
Crustaceans
Others
Countries Analyzed
North America (US, Canada, Mexico)
Europe (Germany, UK, France, Spain, Italy, Russia, Rest of Europe)
Asia Pacific (China, India, Japan, South Korea, Australia, South East Asia, Rest of Asia)
South America (Brazil, Argentina, Rest of South America)
Middle East and Africa (Saudi Arabia, UAE, Rest of Middle East, South Africa, Egypt, Rest of Africa)
Aquatic Feed Ingredients and Products Companies Profiled in the Study
Beneo GmbH
Bentoli
BioMar Group
Bluestar Adisseo Co.
Cargill Inc
Darling Ingredients Inc
ESSECO Srl
IB Group
Kemin Industries Inc
Koninklijke DSM NV
Krill Canada Corp
Novus International Inc
Nutreco N.V.
Ridley Corp Ltd
Uniscope Inc
UNO FEEDS
VST LLC dba Prairie Aquatech
*- List Not Exhaustive
Chapter 1. TABLE OF CONTENTS
Chapter 2. Introduction to Aquatic Feed Ingredients and Products Market
2.1. Market Overview
2.2. Key Statistics and Report Highlights
2.3. Scope of the Comprehensive Study
2.3.1. Market Definition
2.3.2 Countries and Regions Covered
2.3.3 Research Objective
2.3.4 Units, Currency, and Conversions
2.3.5 Industry Value Chain
2.4. Key Market Segments
2.5. Key Companies
2.6. Study Period
Chapter 3. Strategic Analysis Review
3.1. Aquatic Feed Ingredients and Products Pricing Analysis and Forecast
3.2. Porter’s Five Forces
3.3. Market Ecosystem
3.4. SWOT Analysis
3.5. Regulatory Scenario
3.3. Effects of Inflation, Russia-Ukraine War, moderating economic growth, and other macroeconomic factors
Chapter 4. Competitive Landscape
4.1. Market Share Analysis
4.1.1. Global Aquatic Feed Ingredients and Products Market Share by Company, 2023
4.1.2. Product Offerings of Leading Aquatic Feed Ingredients and Products Companies
4.2. Market Entropy
4.2.1. New Product Launches in the Industry
4.2.2. Mergers, Acquisitions, Joint ventures, and Partnerships
4.3. Key Strategies and Best Practices
Chapter 5. Global Market Projections: Best, Reference, and Low Case Scenarios
5.1. Growth Analysis- Case Scenario Definitions
5.2. Low Growth Case Scenario Forecasts
5.3. Reference Growth Case Scenario Forecasts
5.4. High Growth Case Scenario Forecasts
Chapter 6. Market Dynamics
6.1. Aquatic Feed Ingredients and Products Market Drivers
6.2. Aquatic Feed Ingredients and Products Market Challenges
6.6. Aquatic Feed Ingredients and Products Market Opportunities
6.4. Aquatic Feed Ingredients and Products Market Trends
Chapter 7. Global Aquatic Feed Ingredients and Products Market Outlook Trends
7.1. Global Aquatic Feed Ingredients and Products Revenue (USD Million) and CAGR (%) by Type (2021-2032)
7.2. Global Aquatic Feed Ingredients and Products Revenue (USD Million) and CAGR (%) by Application (2021-2032)
7.3. Global Aquatic Feed Ingredients and Products Revenue (USD Million) and CAGR (%) by Product (2021-2032)
By Product
Soybean
Fish meal and fish oil
Corn/Maize
Others
By Type
Fishes
Crustaceans
Others
Chapter 8. Global Aquatic Feed Ingredients and Products Regional Analysis and Outlook
8.1. Global Aquatic Feed Ingredients and Products Revenue (USD Million) By Regions (2021- 2032)
8.2. North America Aquatic Feed Ingredients and Products Revenue (USD Million) by Country (2021-2032)
8.2.1. United States Aquatic Feed Ingredients and Products Regional Analysis and Outlook
8.2.2. Canada Aquatic Feed Ingredients and Products Regional Analysis and Outlook
8.2.3. Mexico Aquatic Feed Ingredients and Products Regional Analysis and Outlook
8.3. Europe Aquatic Feed Ingredients and Products Revenue (USD Million), by Country (2021-2032)
8.3.1. Germany Aquatic Feed Ingredients and Products Regional Analysis and Outlook
8.3.2. France Aquatic Feed Ingredients and Products Regional Analysis and Outlook
8.3.3. United Kingdom Aquatic Feed Ingredients and Products Regional Analysis and Outlook
8.3.4. Spain Aquatic Feed Ingredients and Products Regional Analysis and Outlook
8.3.5. Italy Aquatic Feed Ingredients and Products Regional Analysis and Outlook
8.3.6. Russia Aquatic Feed Ingredients and Products Regional Analysis and Outlook
8.3.7. Rest of Europe Aquatic Feed Ingredients and Products Regional Analysis and Outlook
8.4. Asia Pacific Aquatic Feed Ingredients and Products Revenue (USD Million) by Country (2021-2032)
8.4.1. China Aquatic Feed Ingredients and Products Regional Analysis and Outlook
8.4.2. Japan Aquatic Feed Ingredients and Products Regional Analysis and Outlook
8.4.3. India Aquatic Feed Ingredients and Products Regional Analysis and Outlook
8.4.4. South Korea Aquatic Feed Ingredients and Products Regional Analysis and Outlook
8.4.5. Australia Aquatic Feed Ingredients and Products Regional Analysis and Outlook
8.4.6. South East Asia Aquatic Feed Ingredients and Products Regional Analysis and Outlook
8.4.7. Rest of Asia Pacific Aquatic Feed Ingredients and Products Regional Analysis and Outlook
8.5. South America Aquatic Feed Ingredients and Products Revenue (USD Million), by Country (2021-2032)
8.5.1. Brazil Aquatic Feed Ingredients and Products Regional Analysis and Outlook
8.5.2. Argentina Aquatic Feed Ingredients and Products Regional Analysis and Outlook
8.5.3. Rest of South America Aquatic Feed Ingredients and Products Regional Analysis and Outlook
8.6. Middle East and Africa Aquatic Feed Ingredients and Products Revenue (USD Million) by Country (2021-2032)
8.6.1. Middle East Aquatic Feed Ingredients and Products Regional Analysis and Outlook
8.6.2. Africa Aquatic Feed Ingredients and Products Regional Analysis and Outlook
Chapter 9. North America Aquatic Feed Ingredients and Products Analysis and Outlook
9.1. North America Aquatic Feed Ingredients and Products Revenue (USD Million) by Segments (2021-2032)
9.1.1. North America Aquatic Feed Ingredients and Products Revenue (USD Million) by Type (2021-2032)
9.1.2. North America Aquatic Feed Ingredients and Products Revenue (USD Million) by Application (2021-2032)
9.1.3. North America Aquatic Feed Ingredients and Products Revenue (USD Million) by Product (2021-2032)
By Product
Soybean
Fish meal and fish oil
Corn/Maize
Others
By Type
Fishes
Crustaceans
Others
Chapter 10. Europe Aquatic Feed Ingredients and Products Analysis and Outlook
10.1. Europe Aquatic Feed Ingredients and Products Revenue (USD Million), by Segments (USD Million) (2021-2032)
10.1.1. Europe Aquatic Feed Ingredients and Products Revenue (USD Million) by Type (2021-2032)
10.1.2. Europe Aquatic Feed Ingredients and Products Revenue (USD Million) by Application (2021-2032)
10.1.3. Europe Aquatic Feed Ingredients and Products Revenue (USD Million) by Product (2021-2032)
By Product
Soybean
Fish meal and fish oil
Corn/Maize
Others
By Type
Fishes
Crustaceans
Others
Chapter 11. Asia Pacific Aquatic Feed Ingredients and Products Analysis and Outlook
11.1. Asia Pacific Aquatic Feed Ingredients and Products Revenue (USD Million), and Revenue (USD Million) by Segments (2021-2032)
11.1.1. Asia Pacific Aquatic Feed Ingredients and Products Revenue (USD Million) by Type (2021-2032)
11.1.2. Asia Pacific Aquatic Feed Ingredients and Products Revenue (USD Million) by Application (2021-2032)
11.1.3. Asia Pacific Aquatic Feed Ingredients and Products Revenue (USD Million) by Product (2021-2032)
By Product
Soybean
Fish meal and fish oil
Corn/Maize
Others
By Type
Fishes
Crustaceans
Others
Chapter 12. South America Aquatic Feed Ingredients and Products Analysis and Outlook
12.1. South America Aquatic Feed Ingredients and Products Revenue (USD Million), by Segments (2021-2032)
12.1.1. South America Aquatic Feed Ingredients and Products Revenue (USD Million) by Type (2021-2032)
12.1.2. South America Aquatic Feed Ingredients and Products Revenue (USD Million) by Application (2021-2032)
12.1.3. South America Aquatic Feed Ingredients and Products Revenue (USD Million) by Product (2021-2032)
By Product
Soybean
Fish meal and fish oil
Corn/Maize
Others
By Type
Fishes
Crustaceans
Others
Chapter 13. Middle East and Africa Aquatic Feed Ingredients and Products Analysis and Outlook
13.1. Middle East and Africa Aquatic Feed Ingredients and Products Revenue (USD Million), by Segments (2021-2032)
13.1.1. Middle East and Africa Aquatic Feed Ingredients and Products Revenue (USD Million) by Type (2021-2032)
13.1.2. Middle East and Africa Aquatic Feed Ingredients and Products Revenue (USD Million) by Application (2021-2032)
13.1.3. Middle East and Africa Aquatic Feed Ingredients and Products Revenue (USD Million) by Product (2021-2032)
By Product
Soybean
Fish meal and fish oil
Corn/Maize
Others
By Type
Fishes
Crustaceans
Others
Chapter 14. Aquatic Feed Ingredients and Products Company Profiles
14.1 Business Overview
14.2 Product Profiles
14.3 SWOT Profiles
14.5 Recent Developments
14.6 Financial Profile
List of Companies
Beneo GmbH
Bentoli
BioMar Group
Bluestar Adisseo Co.
Cargill Inc
Darling Ingredients Inc
ESSECO Srl
IB Group
Kemin Industries Inc
Koninklijke DSM NV
Krill Canada Corp
Novus International Inc
Nutreco N.V.
Ridley Corp Ltd
Uniscope Inc
UNO FEEDS
VST LLC dba Prairie Aquatech
15. Methodology and Data Sources
15.1 Customization Offerings
15.2 Subscription Services
15.3 Related Reports
15.4 Publisher Expertise
LIST OF TABLES
Table 1 Market Segmentation Analysis
Table 2 Global Aquatic Feed Ingredients and Products Market Share of Leading Companies, 2023
Table 3 Product Offerings of Leading Companies
Table 4 Low Growth Scenario Forecasts
Table 5 Reference Case Growth Scenario
Table 6 High Growth Case Scenario
Table 7 Global Aquatic Feed Ingredients and Products Revenue (USD Million) And CAGR (%) By Type (2021-2032)
Table 8 Global Aquatic Feed Ingredients and Products Revenue (USD Million) And CAGR (%) By Application (2021-2032)
Table 9 Global Aquatic Feed Ingredients and Products Revenue (USD Million) And CAGR (%) By Product (2021-2032)
Table 10 Global Aquatic Feed Ingredients and Products Market Revenue (USD Million) By Regions (2021-2032)
Table 11 Global Aquatic Feed Ingredients and Products Market Share (%) By Regions (2021-2032)
Table 12 North America Aquatic Feed Ingredients and Products Revenue (USD Million) By Country (2021-2032)
Table 13 Europe Aquatic Feed Ingredients and Products Revenue (USD Million) By Country (2021-2032)
Table 14 Asia Pacific Aquatic Feed Ingredients and Products Revenue (USD Million) By Country (2021-2032)
Table 15 South America Aquatic Feed Ingredients and Products Revenue (USD Million) By Country (2021-2032)
Table 16 Middle East and Africa Aquatic Feed Ingredients and Products Revenue (USD Million) By Region (2021-2032)
Table 17 North America Aquatic Feed Ingredients and Products Revenue (USD Million) By Type (2021-2032)
Table 18 North America Aquatic Feed Ingredients and Products Revenue (USD Million) By Application (2021-2032)
Table 19 North America Aquatic Feed Ingredients and Products Revenue (USD Million) By Product (2021-2032)
Table 20 Europe Aquatic Feed Ingredients and Products Revenue (USD Million) By Type (2021-2032)
Table 21 Europe Aquatic Feed Ingredients and Products Revenue (USD Million) By Application (2021-2032)
Table 22 Europe Aquatic Feed Ingredients and Products Revenue (USD Million) By Product (2021-2032)
Table 23 Asia Pacific Aquatic Feed Ingredients and Products Revenue (USD Million) By Type (2021-2032)
Table 24 Asia Pacific Aquatic Feed Ingredients and Products Revenue (USD Million) By Application (2021-2032)
Table 25 Asia Pacific Aquatic Feed Ingredients and Products Revenue (USD Million) By Product (2021-2032)
Table 26 South America Aquatic Feed Ingredients and Products Revenue (USD Million) By Type (2021-2032)
Table 27 South America Aquatic Feed Ingredients and Products Revenue (USD Million) By Application (2021-2032)
Table 28 South America Aquatic Feed Ingredients and Products Revenue (USD Million) By Product (2021-2032)
Table 29 Middle East and Africa Aquatic Feed Ingredients and Products Revenue (USD Million) By Type (2021-2032)
Table 30 Middle East and Africa Aquatic Feed Ingredients and Products Revenue (USD Million) By Application (2021-2032)
Table 31 Middle East and Africa Aquatic Feed Ingredients and Products Revenue (USD Million) By Product (2021-2032)
LIST OF FIGURES
Figure 1. Market Scope
Figure 2. Pricing Forecasts Per Unit, 2023- 2032
Figure 3. Porter’s Five Forces
Figure 4. Global Aquatic Feed Ingredients and Products Market Revenue (USD Million) By Regions (2021-2032)
Figure 5. Global Aquatic Feed Ingredients and Products Market Share (%) By Regions (2023)
Figure 6. North America Aquatic Feed Ingredients and Products Revenue (USD Million) By Country (2021-2032)
Figure 7. United States Aquatic Feed Ingredients and Products Revenue (USD Million) By Country (2021-2032)
Figure 8. Canada Aquatic Feed Ingredients and Products Revenue (USD Million) By Country (2021-2032)
Figure 9. Mexico Aquatic Feed Ingredients and Products Revenue (USD Million) By Country (2021-2032)
Figure 10. Europe Aquatic Feed Ingredients and Products Revenue (USD Million) By Country (2021-2032)
Figure 11. Germany Aquatic Feed Ingredients and Products Revenue (USD Million) By Country (2021-2032)
Figure 12. France Aquatic Feed Ingredients and Products Revenue (USD Million) By Country (2021-2032)
Figure 13. United Kingdom Aquatic Feed Ingredients and Products Revenue (USD Million) By Country (2021-2032)
Figure 14. Spain Aquatic Feed Ingredients and Products Revenue (USD Million) By Country (2021-2032)
Figure 15. Italy Aquatic Feed Ingredients and Products Revenue (USD Million) By Country (2021-2032)
Figure 16. Russia Aquatic Feed Ingredients and Products Revenue (USD Million) By Country (2021-2032)
Figure 17. Rest of Europe Aquatic Feed Ingredients and Products Revenue (USD Million) By Country (2021-2032)
Figure 11. Asia Pacific Aquatic Feed Ingredients and Products Revenue (USD Million) By Country (2021-2032)
Figure 12. China Aquatic Feed Ingredients and Products Revenue (USD Million) By Country (2021-2032)
Figure 13. Japan Aquatic Feed Ingredients and Products Revenue (USD Million) By Country (2021-2032)
Figure 14. India Aquatic Feed Ingredients and Products Revenue (USD Million) By Country (2021-2032)
Figure 15. South Korea Aquatic Feed Ingredients and Products Revenue (USD Million) By Country (2021-2032)
Figure 16. Australia Aquatic Feed Ingredients and Products Revenue (USD Million) By Country (2021-2032)
Figure 17. South East Asia Aquatic Feed Ingredients and Products Revenue (USD Million) By Country (2021-2032)
Figure 18. South America Aquatic Feed Ingredients and Products Revenue (USD Million) By Country (2021-2032)
Figure 19. Brazil Aquatic Feed Ingredients and Products Revenue (USD Million) By Country (2021-2032)
Figure 20. Argentina Aquatic Feed Ingredients and Products Revenue (USD Million) By Country (2021-2032)
Figure 21. Rest of Asia Pacific Aquatic Feed Ingredients and Products Revenue (USD Million) By Country (2021-2032)
Figure 22. Middle East and Africa Aquatic Feed Ingredients and Products Revenue (USD Million) By Region (2021-2032)
Figure 23. Saudi Arabia Aquatic Feed Ingredients and Products Revenue (USD Million) By Region (2021-2032)
Figure 24. The UAE Aquatic Feed Ingredients and Products Revenue (USD Million) By Region (2021-2032)
Figure 25. Rest of Middle East Aquatic Feed Ingredients and Products Revenue (USD Million) By Region (2021-2032)
Figure 26. South Africa Aquatic Feed Ingredients and Products Revenue (USD Million) By Region (2021-2032)
Figure 27. Africa Aquatic Feed Ingredients and Products Revenue (USD Million) By Region (2021-2032)
Figure 28. North America Aquatic Feed Ingredients and Products Revenue (USD Million) By Type (2021-2032)
Figure 29. North America Aquatic Feed Ingredients and Products Revenue (USD Million) By Application (2021-2032)
Figure 30. North America Aquatic Feed Ingredients and Products Revenue (USD Million) By Product (2021-2032)
Figure 31. Europe Aquatic Feed Ingredients and Products Revenue (USD Million) By Type (2021-2032)
Figure 32. Europe Aquatic Feed Ingredients and Products Revenue (USD Million) By Application (2021-2032)
Figure 33. Europe Aquatic Feed Ingredients and Products Revenue (USD Million) By Product (2021-2032)
Figure 34. Asia Pacific Aquatic Feed Ingredients and Products Revenue (USD Million) By Type (2021-2032)
Figure 35. Asia Pacific Aquatic Feed Ingredients and Products Revenue (USD Million) By Application (2021-2032)
Figure 36. Asia Pacific Aquatic Feed Ingredients and Products Revenue (USD Million) By Product (2021-2032)
Figure 37. South America Aquatic Feed Ingredients and Products Revenue (USD Million) By Type (2021-2032)
Figure 38. South America Aquatic Feed Ingredients and Products Revenue (USD Million) By Application (2021-2032)
Figure 39. South America Aquatic Feed Ingredients and Products Revenue (USD Million) By Product (2021-2032)
Figure 40. Middle East and Africa Aquatic Feed Ingredients and Products Revenue (USD Million) By Type (2021-2032)
Figure 41. Middle East and Africa Aquatic Feed Ingredients and Products Revenue (USD Million) By Application (2021-2032)
Figure 42. Middle East and Africa Aquatic Feed Ingredients and Products Revenue (USD Million) By Product (2021-2032)
By Product
Soybean
Fish meal and fish oil
Corn/Maize
Others
By Type
Fishes
Crustaceans
Others
Countries Analyzed
North America (US, Canada, Mexico)
Europe (Germany, UK, France, Spain, Italy, Russia, Rest of Europe)
Asia Pacific (China, India, Japan, South Korea, Australia, South East Asia, Rest of Asia)
South America (Brazil, Argentina, Rest of South America)
Middle East and Africa (Saudi Arabia, UAE, Rest of Middle East, South Africa, Egypt, Rest of Africa)
