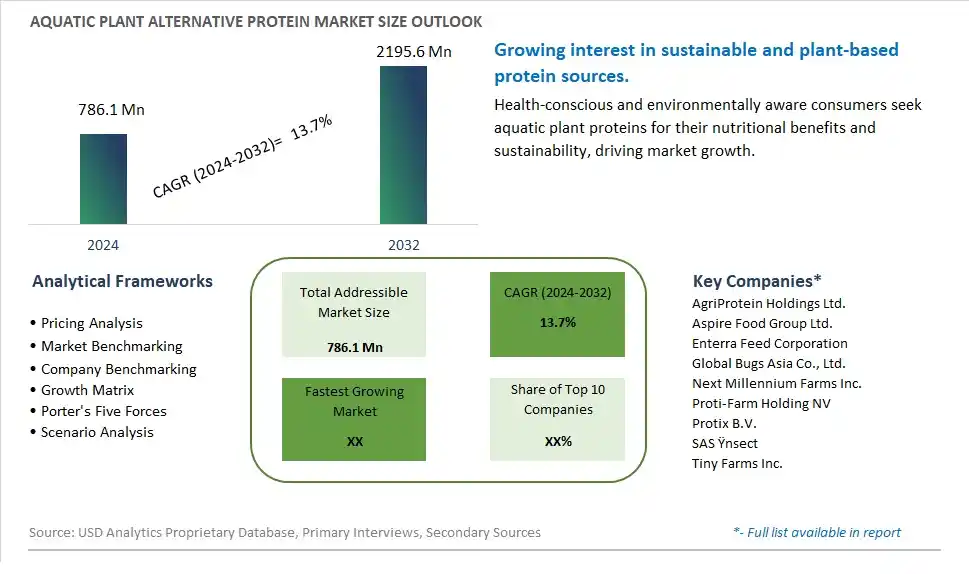
Global Aquatic Plant Alternative Protein Market Size is valued at $786.1 Million in 2024 and is forecast to register a growth rate (CAGR) of 13.7% to reach $2195.6 Million by 2032.
The global Aquatic Plant Alternative Protein Market Comprehensive Study analyzes and forecasts the market size across 6 regions and 24 countries for diverse segments -By Type (Emerging Alternative Protein, Adolescent Alternative Protein, Matured Alternative Protein), By Application (Food, Feed, Others)
An Introduction to Aquatic Plant Alternative Protein Market
The Aquatic Plant Alternative Protein market in 2024 is expanding rapidly, driven by the growing demand for sustainable and plant-based protein sources. Aquatic plants such as algae, seaweed, and duckweed are rich in protein and essential nutrients, making them ideal for use in food products, animal feed, and dietary supplements. The market is supported by the increasing consumer awareness of the environmental impact of traditional protein sources and the health benefits of plant-based diets. Advances in cultivation and processing technologies are enhancing the scalability and quality of aquatic plant proteins. The market is also benefiting from strong investment and research in alternative proteins, promoting their acceptance and integration into mainstream diets.
Aquatic Plant Alternative Protein Competitive Landscape
The market report analyses the leading companies in the industry including AgriProtein Holdings Ltd., Aspire Food Group Ltd., Enterra Feed Corporation, Global Bugs Asia Co., Ltd., Next Millennium Farms Inc., Proti-Farm Holding NV, Protix B.V., SAS Ÿnsect, Tiny Farms Inc., and Others.
Aquatic Plant Alternative Protein Market Dynamics
Aquatic Plant Alternative Protein Market Trend: Increasing Adoption of Sustainable Protein Sources
The Aquatic Plant Alternative Protein market is experiencing a significant trend towards the increasing adoption of sustainable protein sources. As consumers become more environmentally conscious, there is a growing demand for protein alternatives that have a lower environmental impact compared to traditional animal-based proteins. Aquatic plants, such as algae and duckweed, are emerging as viable and sustainable protein sources due to their high nutritional value and minimal resource requirements for cultivation. This trend is driven by the need to address global food security challenges and reduce the carbon footprint associated with protein production, positioning aquatic plant proteins as a key component of future sustainable diets.
Aquatic Plant Alternative Protein Market Driver: Rising Demand for Plant-Based and Functional Foods
A major driver for the Aquatic Plant Alternative Protein market is the rising demand for plant-based and functional foods. Consumers are increasingly seeking plant-based proteins that offer health benefits and align with dietary preferences such as veganism and vegetarianism. Aquatic plant proteins are rich in essential amino acids, vitamins, and minerals, making them attractive for health-conscious consumers looking to enhance their nutritional intake. The growth of the plant-based food sector, coupled with the trend towards functional foods that provide additional health benefits, is driving the adoption of aquatic plant proteins in a variety of food products, including meat substitutes, snacks, and beverages.
Aquatic Plant Alternative Protein Market Opportunity: Innovation in Food and Beverage Applications
Innovation in food and beverage applications presents a substantial opportunity for the Aquatic Plant Alternative Protein market. As the market for alternative proteins expands, there is significant potential to develop new and innovative products that incorporate aquatic plant proteins. These proteins can be used to create a wide range of food and beverage products, from protein bars and shakes to plant-based meat alternatives and dairy-free products. By focusing on product development and leveraging the unique nutritional properties of aquatic plant proteins, manufacturers can tap into the growing demand for novel and sustainable protein sources, driving market growth and differentiation in a competitive landscape.
Aquatic Plant Alternative Protein Market Share Analysis: Emerging Alternative Protein segment generated the highest revenue share in the industry
Among the segments in the Aquatic Plant Alternative Protein Market, the Emerging Alternative Protein segment stands out as the largest. This segment encompasses innovative protein sources derived from aquatic plants that are gaining traction in the food and beverage industry. The fast growth of this segment is primarily driven by several factors. Firstly, there is a growing demand for plant-based protein alternatives due to concerns about sustainability, environmental impact, and health-conscious consumer trends. Emerging alternative proteins offer a sustainable and environmentally friendly solution compared to traditional animal-based proteins. Additionally, advancements in technology and processing techniques have enabled the extraction and refinement of proteins from aquatic plants, enhancing their nutritional profile and functionality. These proteins are rich in essential amino acids, making them suitable substitutes for animal proteins in various food products. The versatility of emerging alternative proteins allows for their incorporation into a wide range of food applications, including plant-based meats, dairy alternatives, snacks, and beverages, further contributing to their prominence in the market.
Aquatic Plant Alternative Protein Market Share Analysis: Food Application is the fastest growing segment over the forecast period to 2032
The Food Application segment within the Aquatic Plant Alternative Protein Market is experiencing rapid growth and is poised to continue this trend until 2032. The demand for plant-based proteins in food products has surged due to several factors. Firstly, there is a growing awareness among consumers regarding the environmental impact of traditional animal agriculture, leading to a shift towards more sustainable and eco-friendly food choices. Aquatic plant alternative proteins offer a compelling solution as they require fewer resources such as land and water compared to animal-based proteins. Additionally, advancements in processing technologies have improved the taste, texture, and nutritional profile of plant-based proteins, making them more appealing to a broader consumer base. The food application segment encompasses various products, including plant-based meats, dairy alternatives, snacks, and beverages, catering to the diverse preferences of consumers seeking healthier and more sustainable food options. This segment's fast growth is further fueled by the increasing adoption of vegetarian and flexitarian diets globally, highlighting the significant opportunities for innovation and expansion within the plant-based protein market.
Aquatic Plant Alternative Protein Market Segmentation
By Type
Emerging Alternative Protein
Adolescent Alternative Protein
Matured Alternative Protein
By Application
Food
Feed
Others
Countries Analyzed
North America (US, Canada, Mexico)
Europe (Germany, UK, France, Spain, Italy, Russia, Rest of Europe)
Asia Pacific (China, India, Japan, South Korea, Australia, South East Asia, Rest of Asia)
South America (Brazil, Argentina, Rest of South America)
Middle East and Africa (Saudi Arabia, UAE, Rest of Middle East, South Africa, Egypt, Rest of Africa)
Aquatic Plant Alternative Protein Companies Profiled in the Study
AgriProtein Holdings Ltd.
Aspire Food Group Ltd.
Enterra Feed Corporation
Global Bugs Asia Co., Ltd.
Next Millennium Farms Inc.
Proti-Farm Holding NV
Protix B.V.
SAS Ÿnsect
Tiny Farms Inc.
*- List Not Exhaustive
Chapter 1. TABLE OF CONTENTS
Chapter 2. Introduction to Aquatic Plant Alternative Protein Market
2.1. Market Overview
2.2. Key Statistics and Report Highlights
2.3. Scope of the Comprehensive Study
2.3.1. Market Definition
2.3.2 Countries and Regions Covered
2.3.3 Research Objective
2.3.4 Units, Currency, and Conversions
2.3.5 Industry Value Chain
2.4. Key Market Segments
2.5. Key Companies
2.6. Study Period
Chapter 3. Strategic Analysis Review
3.1. Aquatic Plant Alternative Protein Pricing Analysis and Forecast
3.2. Porter’s Five Forces
3.3. Market Ecosystem
3.4. SWOT Analysis
3.5. Regulatory Scenario
3.3. Effects of Inflation, Russia-Ukraine War, moderating economic growth, and other macroeconomic factors
Chapter 4. Competitive Landscape
4.1. Market Share Analysis
4.1.1. Global Aquatic Plant Alternative Protein Market Share by Company, 2023
4.1.2. Product Offerings of Leading Aquatic Plant Alternative Protein Companies
4.2. Market Entropy
4.2.1. New Product Launches in the Industry
4.2.2. Mergers, Acquisitions, Joint ventures, and Partnerships
4.3. Key Strategies and Best Practices
Chapter 5. Global Market Projections: Best, Reference, and Low Case Scenarios
5.1. Growth Analysis- Case Scenario Definitions
5.2. Low Growth Case Scenario Forecasts
5.3. Reference Growth Case Scenario Forecasts
5.4. High Growth Case Scenario Forecasts
Chapter 6. Market Dynamics
6.1. Aquatic Plant Alternative Protein Market Drivers
6.2. Aquatic Plant Alternative Protein Market Challenges
6.6. Aquatic Plant Alternative Protein Market Opportunities
6.4. Aquatic Plant Alternative Protein Market Trends
Chapter 7. Global Aquatic Plant Alternative Protein Market Outlook Trends
7.1. Global Aquatic Plant Alternative Protein Revenue (USD Million) and CAGR (%) by Type (2021-2032)
7.2. Global Aquatic Plant Alternative Protein Revenue (USD Million) and CAGR (%) by Application (2021-2032)
7.3. Global Aquatic Plant Alternative Protein Revenue (USD Million) and CAGR (%) by Product (2021-2032)
By Type
Emerging Alternative Protein
Adolescent Alternative Protein
Matured Alternative Protein
By Application
Food
Feed
Others
Chapter 8. Global Aquatic Plant Alternative Protein Regional Analysis and Outlook
8.1. Global Aquatic Plant Alternative Protein Revenue (USD Million) By Regions (2021- 2032)
8.2. North America Aquatic Plant Alternative Protein Revenue (USD Million) by Country (2021-2032)
8.2.1. United States Aquatic Plant Alternative Protein Regional Analysis and Outlook
8.2.2. Canada Aquatic Plant Alternative Protein Regional Analysis and Outlook
8.2.3. Mexico Aquatic Plant Alternative Protein Regional Analysis and Outlook
8.3. Europe Aquatic Plant Alternative Protein Revenue (USD Million), by Country (2021-2032)
8.3.1. Germany Aquatic Plant Alternative Protein Regional Analysis and Outlook
8.3.2. France Aquatic Plant Alternative Protein Regional Analysis and Outlook
8.3.3. United Kingdom Aquatic Plant Alternative Protein Regional Analysis and Outlook
8.3.4. Spain Aquatic Plant Alternative Protein Regional Analysis and Outlook
8.3.5. Italy Aquatic Plant Alternative Protein Regional Analysis and Outlook
8.3.6. Russia Aquatic Plant Alternative Protein Regional Analysis and Outlook
8.3.7. Rest of Europe Aquatic Plant Alternative Protein Regional Analysis and Outlook
8.4. Asia Pacific Aquatic Plant Alternative Protein Revenue (USD Million) by Country (2021-2032)
8.4.1. China Aquatic Plant Alternative Protein Regional Analysis and Outlook
8.4.2. Japan Aquatic Plant Alternative Protein Regional Analysis and Outlook
8.4.3. India Aquatic Plant Alternative Protein Regional Analysis and Outlook
8.4.4. South Korea Aquatic Plant Alternative Protein Regional Analysis and Outlook
8.4.5. Australia Aquatic Plant Alternative Protein Regional Analysis and Outlook
8.4.6. South East Asia Aquatic Plant Alternative Protein Regional Analysis and Outlook
8.4.7. Rest of Asia Pacific Aquatic Plant Alternative Protein Regional Analysis and Outlook
8.5. South America Aquatic Plant Alternative Protein Revenue (USD Million), by Country (2021-2032)
8.5.1. Brazil Aquatic Plant Alternative Protein Regional Analysis and Outlook
8.5.2. Argentina Aquatic Plant Alternative Protein Regional Analysis and Outlook
8.5.3. Rest of South America Aquatic Plant Alternative Protein Regional Analysis and Outlook
8.6. Middle East and Africa Aquatic Plant Alternative Protein Revenue (USD Million) by Country (2021-2032)
8.6.1. Middle East Aquatic Plant Alternative Protein Regional Analysis and Outlook
8.6.2. Africa Aquatic Plant Alternative Protein Regional Analysis and Outlook
Chapter 9. North America Aquatic Plant Alternative Protein Analysis and Outlook
9.1. North America Aquatic Plant Alternative Protein Revenue (USD Million) by Segments (2021-2032)
9.1.1. North America Aquatic Plant Alternative Protein Revenue (USD Million) by Type (2021-2032)
9.1.2. North America Aquatic Plant Alternative Protein Revenue (USD Million) by Application (2021-2032)
9.1.3. North America Aquatic Plant Alternative Protein Revenue (USD Million) by Product (2021-2032)
By Type
Emerging Alternative Protein
Adolescent Alternative Protein
Matured Alternative Protein
By Application
Food
Feed
Others
Chapter 10. Europe Aquatic Plant Alternative Protein Analysis and Outlook
10.1. Europe Aquatic Plant Alternative Protein Revenue (USD Million), by Segments (USD Million) (2021-2032)
10.1.1. Europe Aquatic Plant Alternative Protein Revenue (USD Million) by Type (2021-2032)
10.1.2. Europe Aquatic Plant Alternative Protein Revenue (USD Million) by Application (2021-2032)
10.1.3. Europe Aquatic Plant Alternative Protein Revenue (USD Million) by Product (2021-2032)
By Type
Emerging Alternative Protein
Adolescent Alternative Protein
Matured Alternative Protein
By Application
Food
Feed
Others
Chapter 11. Asia Pacific Aquatic Plant Alternative Protein Analysis and Outlook
11.1. Asia Pacific Aquatic Plant Alternative Protein Revenue (USD Million), and Revenue (USD Million) by Segments (2021-2032)
11.1.1. Asia Pacific Aquatic Plant Alternative Protein Revenue (USD Million) by Type (2021-2032)
11.1.2. Asia Pacific Aquatic Plant Alternative Protein Revenue (USD Million) by Application (2021-2032)
11.1.3. Asia Pacific Aquatic Plant Alternative Protein Revenue (USD Million) by Product (2021-2032)
By Type
Emerging Alternative Protein
Adolescent Alternative Protein
Matured Alternative Protein
By Application
Food
Feed
Others
Chapter 12. South America Aquatic Plant Alternative Protein Analysis and Outlook
12.1. South America Aquatic Plant Alternative Protein Revenue (USD Million), by Segments (2021-2032)
12.1.1. South America Aquatic Plant Alternative Protein Revenue (USD Million) by Type (2021-2032)
12.1.2. South America Aquatic Plant Alternative Protein Revenue (USD Million) by Application (2021-2032)
12.1.3. South America Aquatic Plant Alternative Protein Revenue (USD Million) by Product (2021-2032)
By Type
Emerging Alternative Protein
Adolescent Alternative Protein
Matured Alternative Protein
By Application
Food
Feed
Others
Chapter 13. Middle East and Africa Aquatic Plant Alternative Protein Analysis and Outlook
13.1. Middle East and Africa Aquatic Plant Alternative Protein Revenue (USD Million), by Segments (2021-2032)
13.1.1. Middle East and Africa Aquatic Plant Alternative Protein Revenue (USD Million) by Type (2021-2032)
13.1.2. Middle East and Africa Aquatic Plant Alternative Protein Revenue (USD Million) by Application (2021-2032)
13.1.3. Middle East and Africa Aquatic Plant Alternative Protein Revenue (USD Million) by Product (2021-2032)
By Type
Emerging Alternative Protein
Adolescent Alternative Protein
Matured Alternative Protein
By Application
Food
Feed
Others
Chapter 14. Aquatic Plant Alternative Protein Company Profiles
14.1 Business Overview
14.2 Product Profiles
14.3 SWOT Profiles
14.5 Recent Developments
14.6 Financial Profile
List of Companies
AgriProtein Holdings Ltd.
Aspire Food Group Ltd.
Enterra Feed Corporation
Global Bugs Asia Co., Ltd.
Next Millennium Farms Inc.
Proti-Farm Holding NV
Protix B.V.
SAS Ÿnsect
Tiny Farms Inc.
15. Methodology and Data Sources
15.1 Customization Offerings
15.2 Subscription Services
15.3 Related Reports
15.4 Publisher Expertise
LIST OF TABLES
Table 1 Market Segmentation Analysis
Table 2 Global Aquatic Plant Alternative Protein Market Share of Leading Companies, 2023
Table 3 Product Offerings of Leading Companies
Table 4 Low Growth Scenario Forecasts
Table 5 Reference Case Growth Scenario
Table 6 High Growth Case Scenario
Table 7 Global Aquatic Plant Alternative Protein Revenue (USD Million) And CAGR (%) By Type (2021-2032)
Table 8 Global Aquatic Plant Alternative Protein Revenue (USD Million) And CAGR (%) By Application (2021-2032)
Table 9 Global Aquatic Plant Alternative Protein Revenue (USD Million) And CAGR (%) By Product (2021-2032)
Table 10 Global Aquatic Plant Alternative Protein Market Revenue (USD Million) By Regions (2021-2032)
Table 11 Global Aquatic Plant Alternative Protein Market Share (%) By Regions (2021-2032)
Table 12 North America Aquatic Plant Alternative Protein Revenue (USD Million) By Country (2021-2032)
Table 13 Europe Aquatic Plant Alternative Protein Revenue (USD Million) By Country (2021-2032)
Table 14 Asia Pacific Aquatic Plant Alternative Protein Revenue (USD Million) By Country (2021-2032)
Table 15 South America Aquatic Plant Alternative Protein Revenue (USD Million) By Country (2021-2032)
Table 16 Middle East and Africa Aquatic Plant Alternative Protein Revenue (USD Million) By Region (2021-2032)
Table 17 North America Aquatic Plant Alternative Protein Revenue (USD Million) By Type (2021-2032)
Table 18 North America Aquatic Plant Alternative Protein Revenue (USD Million) By Application (2021-2032)
Table 19 North America Aquatic Plant Alternative Protein Revenue (USD Million) By Product (2021-2032)
Table 20 Europe Aquatic Plant Alternative Protein Revenue (USD Million) By Type (2021-2032)
Table 21 Europe Aquatic Plant Alternative Protein Revenue (USD Million) By Application (2021-2032)
Table 22 Europe Aquatic Plant Alternative Protein Revenue (USD Million) By Product (2021-2032)
Table 23 Asia Pacific Aquatic Plant Alternative Protein Revenue (USD Million) By Type (2021-2032)
Table 24 Asia Pacific Aquatic Plant Alternative Protein Revenue (USD Million) By Application (2021-2032)
Table 25 Asia Pacific Aquatic Plant Alternative Protein Revenue (USD Million) By Product (2021-2032)
Table 26 South America Aquatic Plant Alternative Protein Revenue (USD Million) By Type (2021-2032)
Table 27 South America Aquatic Plant Alternative Protein Revenue (USD Million) By Application (2021-2032)
Table 28 South America Aquatic Plant Alternative Protein Revenue (USD Million) By Product (2021-2032)
Table 29 Middle East and Africa Aquatic Plant Alternative Protein Revenue (USD Million) By Type (2021-2032)
Table 30 Middle East and Africa Aquatic Plant Alternative Protein Revenue (USD Million) By Application (2021-2032)
Table 31 Middle East and Africa Aquatic Plant Alternative Protein Revenue (USD Million) By Product (2021-2032)
LIST OF FIGURES
Figure 1. Market Scope
Figure 2. Pricing Forecasts Per Unit, 2023- 2032
Figure 3. Porter’s Five Forces
Figure 4. Global Aquatic Plant Alternative Protein Market Revenue (USD Million) By Regions (2021-2032)
Figure 5. Global Aquatic Plant Alternative Protein Market Share (%) By Regions (2023)
Figure 6. North America Aquatic Plant Alternative Protein Revenue (USD Million) By Country (2021-2032)
Figure 7. United States Aquatic Plant Alternative Protein Revenue (USD Million) By Country (2021-2032)
Figure 8. Canada Aquatic Plant Alternative Protein Revenue (USD Million) By Country (2021-2032)
Figure 9. Mexico Aquatic Plant Alternative Protein Revenue (USD Million) By Country (2021-2032)
Figure 10. Europe Aquatic Plant Alternative Protein Revenue (USD Million) By Country (2021-2032)
Figure 11. Germany Aquatic Plant Alternative Protein Revenue (USD Million) By Country (2021-2032)
Figure 12. France Aquatic Plant Alternative Protein Revenue (USD Million) By Country (2021-2032)
Figure 13. United Kingdom Aquatic Plant Alternative Protein Revenue (USD Million) By Country (2021-2032)
Figure 14. Spain Aquatic Plant Alternative Protein Revenue (USD Million) By Country (2021-2032)
Figure 15. Italy Aquatic Plant Alternative Protein Revenue (USD Million) By Country (2021-2032)
Figure 16. Russia Aquatic Plant Alternative Protein Revenue (USD Million) By Country (2021-2032)
Figure 17. Rest of Europe Aquatic Plant Alternative Protein Revenue (USD Million) By Country (2021-2032)
Figure 11. Asia Pacific Aquatic Plant Alternative Protein Revenue (USD Million) By Country (2021-2032)
Figure 12. China Aquatic Plant Alternative Protein Revenue (USD Million) By Country (2021-2032)
Figure 13. Japan Aquatic Plant Alternative Protein Revenue (USD Million) By Country (2021-2032)
Figure 14. India Aquatic Plant Alternative Protein Revenue (USD Million) By Country (2021-2032)
Figure 15. South Korea Aquatic Plant Alternative Protein Revenue (USD Million) By Country (2021-2032)
Figure 16. Australia Aquatic Plant Alternative Protein Revenue (USD Million) By Country (2021-2032)
Figure 17. South East Asia Aquatic Plant Alternative Protein Revenue (USD Million) By Country (2021-2032)
Figure 18. South America Aquatic Plant Alternative Protein Revenue (USD Million) By Country (2021-2032)
Figure 19. Brazil Aquatic Plant Alternative Protein Revenue (USD Million) By Country (2021-2032)
Figure 20. Argentina Aquatic Plant Alternative Protein Revenue (USD Million) By Country (2021-2032)
Figure 21. Rest of Asia Pacific Aquatic Plant Alternative Protein Revenue (USD Million) By Country (2021-2032)
Figure 22. Middle East and Africa Aquatic Plant Alternative Protein Revenue (USD Million) By Region (2021-2032)
Figure 23. Saudi Arabia Aquatic Plant Alternative Protein Revenue (USD Million) By Region (2021-2032)
Figure 24. The UAE Aquatic Plant Alternative Protein Revenue (USD Million) By Region (2021-2032)
Figure 25. Rest of Middle East Aquatic Plant Alternative Protein Revenue (USD Million) By Region (2021-2032)
Figure 26. South Africa Aquatic Plant Alternative Protein Revenue (USD Million) By Region (2021-2032)
Figure 27. Africa Aquatic Plant Alternative Protein Revenue (USD Million) By Region (2021-2032)
Figure 28. North America Aquatic Plant Alternative Protein Revenue (USD Million) By Type (2021-2032)
Figure 29. North America Aquatic Plant Alternative Protein Revenue (USD Million) By Application (2021-2032)
Figure 30. North America Aquatic Plant Alternative Protein Revenue (USD Million) By Product (2021-2032)
Figure 31. Europe Aquatic Plant Alternative Protein Revenue (USD Million) By Type (2021-2032)
Figure 32. Europe Aquatic Plant Alternative Protein Revenue (USD Million) By Application (2021-2032)
Figure 33. Europe Aquatic Plant Alternative Protein Revenue (USD Million) By Product (2021-2032)
Figure 34. Asia Pacific Aquatic Plant Alternative Protein Revenue (USD Million) By Type (2021-2032)
Figure 35. Asia Pacific Aquatic Plant Alternative Protein Revenue (USD Million) By Application (2021-2032)
Figure 36. Asia Pacific Aquatic Plant Alternative Protein Revenue (USD Million) By Product (2021-2032)
Figure 37. South America Aquatic Plant Alternative Protein Revenue (USD Million) By Type (2021-2032)
Figure 38. South America Aquatic Plant Alternative Protein Revenue (USD Million) By Application (2021-2032)
Figure 39. South America Aquatic Plant Alternative Protein Revenue (USD Million) By Product (2021-2032)
Figure 40. Middle East and Africa Aquatic Plant Alternative Protein Revenue (USD Million) By Type (2021-2032)
Figure 41. Middle East and Africa Aquatic Plant Alternative Protein Revenue (USD Million) By Application (2021-2032)
Figure 42. Middle East and Africa Aquatic Plant Alternative Protein Revenue (USD Million) By Product (2021-2032)
By Type
Emerging Alternative Protein
Adolescent Alternative Protein
Matured Alternative Protein
By Application
Food
Feed
Others
Countries Analyzed
North America (US, Canada, Mexico)
Europe (Germany, UK, France, Spain, Italy, Russia, Rest of Europe)
Asia Pacific (China, India, Japan, South Korea, Australia, South East Asia, Rest of Asia)
South America (Brazil, Argentina, Rest of South America)
Middle East and Africa (Saudi Arabia, UAE, Rest of Middle East, South Africa, Egypt, Rest of Africa)
