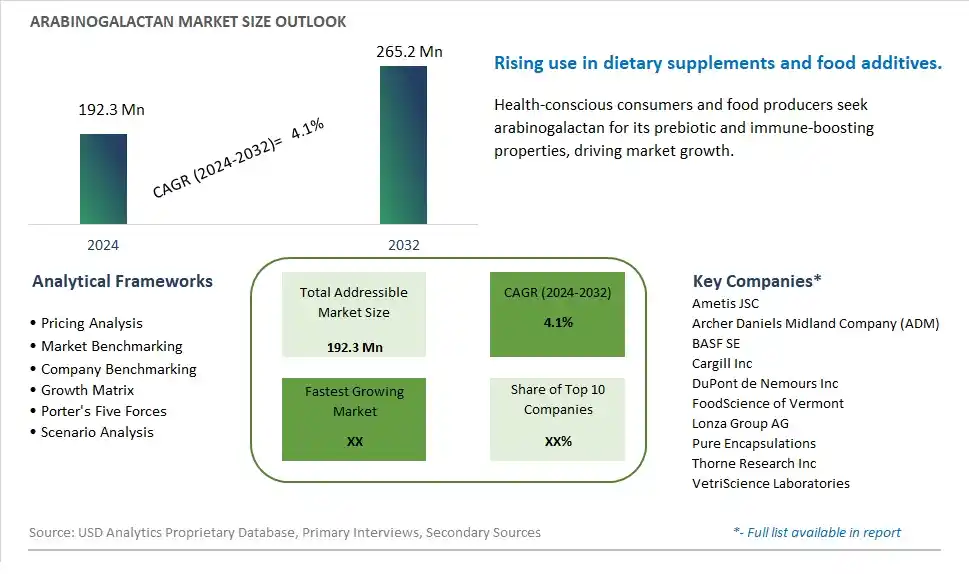
Global Arabinogalactan Market Size is valued at $192.3 Million in 2024 and is forecast to register a growth rate (CAGR) of 4.1% to reach $265.2 Million by 2032.
The global Arabinogalactan Market Comprehensive Study analyzes and forecasts the market size across 6 regions and 24 countries for diverse segments -By Type (Capsule, Powder), By Application (Food and Beverage, Animal Feed, Pharmaceuticals, Cosmetic, Others)
An Introduction to Arabinogalactan Market
In 2024, the Arabinogalactan market is growing robustly, driven by its applications in the food, pharmaceutical, and cosmetic industries. Arabinogalactan, a natural polysaccharide derived from the larch tree, is valued for its prebiotic properties, immune support, and fiber content. It is used in dietary supplements, functional foods, and as a stabilizer in beverages and cosmetics. The market is supported by the increasing consumer interest in gut health and natural wellness products. Advances in extraction and formulation technologies are enhancing the functionality and application versatility of arabinogalactan. The market is also benefiting from the trend towards clean-label and plant-based ingredients, appealing to health-conscious consumers.
Arabinogalactan Competitive Landscape
The market report analyses the leading companies in the industry including Ametis JSC, Archer Daniels Midland Company (ADM), BASF SE, Cargill Inc, DuPont de Nemours Inc, FoodScience of Vermont, Lonza Group AG, Pure Encapsulations, Thorne Research Inc, VetriScience Laboratories, and Others.
Arabinogalactan Market Dynamics
Arabinogalactan Market Trend: Growing Interest in Natural and Functional Ingredients
The Arabinogalactan market is experiencing a significant trend towards growing interest in natural and functional ingredients. Consumers are increasingly prioritizing health and wellness, leading to a surge in demand for dietary supplements and functional foods that offer additional health benefits. Arabinogalactan, a natural polysaccharide derived from the larch tree, is recognized for its prebiotic properties and immune-boosting effects. This trend is driven by the shift towards plant-based and natural products, as consumers seek out ingredients that provide functional benefits without synthetic additives, positioning arabinogalactan as a desirable component in health-focused formulations.
Arabinogalactan Market Driver: Rising Demand for Prebiotic and Immune-Boosting Supplements
A major driver for the Arabinogalactan market is the rising demand for prebiotic and immune-boosting supplements. As awareness of gut health and its impact on overall well-being increases, consumers are turning to prebiotics to support their digestive health. Arabinogalactan serves as a beneficial prebiotic, promoting the growth of healthy gut bacteria. Additionally, its role in enhancing immune function makes it a popular ingredient in supplements aimed at boosting immunity. The ongoing interest in maintaining health, particularly in the wake of global health concerns, is driving the demand for supplements containing arabinogalactan.
Arabinogalactan Market Opportunity: Expansion into Food and Beverage Applications
Expansion into food and beverage applications presents a substantial opportunity for the Arabinogalactan market. Beyond its use in dietary supplements, arabinogalactan can be incorporated into a variety of food and beverage products to enhance their health benefits. This includes functional foods, health drinks, and fortified snacks. By innovating and developing new products that utilize arabinogalactan, manufacturers can tap into the growing consumer preference for functional and health-promoting foods. This approach not only broadens the application of arabinogalactan but also meets the increasing demand for products that offer both nutritional value and convenience, driving market growth and diversification.
Arabinogalactan Market Share Analysis: Arabinogalactan Powder segment generated the highest revenue share in the industry
Among the segments of the Arabinogalactan Market, the Arabinogalactan Powder segment stands out as the largest. This segment has experienced significant growth due to several factors. Arabinogalactan powder is a polysaccharide derived from plants like larch trees, and its popularity stems from its various health benefits and versatile applications. As a dietary supplement, arabinogalactan powder is known for its prebiotic properties, promoting gut health and supporting the immune system. Its solubility in water makes it easy to incorporate into various formulations, such as nutritional supplements, functional foods, and beverages. The demand for natural and plant-based ingredients in the health and wellness sector has fueled the growth of the arabinogalactan powder segment, with consumers seeking products that offer immune support, digestive health, and overall well-being. Additionally, ongoing research highlighting the potential health benefits of arabinogalactan has further propelled its market growth, making the Arabinogalactan Powder segment the largest in the Arabinogalactan Market.
Arabinogalactan Market Share Analysis: Pharmaceuticals is the fastest growing segment over the forecast period to 2032
The Arabinogalactan Market's fastest-growing segment is undoubtedly Arabinogalactan in Pharmaceuticals. This surge in growth can be attributed to several key factors. Arabinogalactan, a natural polysaccharide found in various plant sources, has gained immense traction in the pharmaceutical industry due to its versatile properties and potential health benefits. It serves as an effective excipient in pharmaceutical formulations, contributing to enhanced drug delivery systems, stability, and solubility of active ingredients. Arabinogalactan's immunomodulatory and anti-inflammatory properties make it a valuable component in pharmaceutical products aimed at immune support, respiratory health, and gastrointestinal disorders. Further, ongoing research and development efforts focusing on harnessing the full potential of arabinogalactan in novel drug formulations are driving the rapid growth of this segment. The increasing consumer preference for natural and plant-based ingredients in healthcare products further augments the demand for arabinogalactan in pharmaceutical applications, making it the fastest-growing segment in the Arabinogalactan Market.
Arabinogalactan Market Segmentation
By Type
Capsule
Powder
By Application
Food and Beverage
Animal Feed
Pharmaceuticals
Cosmetic
Others
Countries Analyzed
North America (US, Canada, Mexico)
Europe (Germany, UK, France, Spain, Italy, Russia, Rest of Europe)
Asia Pacific (China, India, Japan, South Korea, Australia, South East Asia, Rest of Asia)
South America (Brazil, Argentina, Rest of South America)
Middle East and Africa (Saudi Arabia, UAE, Rest of Middle East, South Africa, Egypt, Rest of Africa)
Arabinogalactan Companies Profiled in the Study
Ametis JSC
Archer Daniels Midland Company (ADM)
BASF SE
Cargill Inc
DuPont de Nemours Inc
FoodScience of Vermont
Lonza Group AG
Pure Encapsulations
Thorne Research Inc
VetriScience Laboratories
*- List Not Exhaustive
Chapter 1. TABLE OF CONTENTS
Chapter 2. Introduction to Arabinogalactan Market
2.1. Market Overview
2.2. Key Statistics and Report Highlights
2.3. Scope of the Comprehensive Study
2.3.1. Market Definition
2.3.2 Countries and Regions Covered
2.3.3 Research Objective
2.3.4 Units, Currency, and Conversions
2.3.5 Industry Value Chain
2.4. Key Market Segments
2.5. Key Companies
2.6. Study Period
Chapter 3. Strategic Analysis Review
3.1. Arabinogalactan Pricing Analysis and Forecast
3.2. Porter’s Five Forces
3.3. Market Ecosystem
3.4. SWOT Analysis
3.5. Regulatory Scenario
3.3. Effects of Inflation, Russia-Ukraine War, moderating economic growth, and other macroeconomic factors
Chapter 4. Competitive Landscape
4.1. Market Share Analysis
4.1.1. Global Arabinogalactan Market Share by Company, 2023
4.1.2. Product Offerings of Leading Arabinogalactan Companies
4.2. Market Entropy
4.2.1. New Product Launches in the Industry
4.2.2. Mergers, Acquisitions, Joint ventures, and Partnerships
4.3. Key Strategies and Best Practices
Chapter 5. Global Market Projections: Best, Reference, and Low Case Scenarios
5.1. Growth Analysis- Case Scenario Definitions
5.2. Low Growth Case Scenario Forecasts
5.3. Reference Growth Case Scenario Forecasts
5.4. High Growth Case Scenario Forecasts
Chapter 6. Market Dynamics
6.1. Arabinogalactan Market Drivers
6.2. Arabinogalactan Market Challenges
6.6. Arabinogalactan Market Opportunities
6.4. Arabinogalactan Market Trends
Chapter 7. Global Arabinogalactan Market Outlook Trends
7.1. Global Arabinogalactan Revenue (USD Million) and CAGR (%) by Type (2021-2032)
7.2. Global Arabinogalactan Revenue (USD Million) and CAGR (%) by Application (2021-2032)
7.3. Global Arabinogalactan Revenue (USD Million) and CAGR (%) by Product (2021-2032)
By Type
Capsule
Powder
By Application
Food and Beverage
Animal Feed
Pharmaceuticals
Cosmetic
Others
Chapter 8. Global Arabinogalactan Regional Analysis and Outlook
8.1. Global Arabinogalactan Revenue (USD Million) By Regions (2021- 2032)
8.2. North America Arabinogalactan Revenue (USD Million) by Country (2021-2032)
8.2.1. United States Arabinogalactan Regional Analysis and Outlook
8.2.2. Canada Arabinogalactan Regional Analysis and Outlook
8.2.3. Mexico Arabinogalactan Regional Analysis and Outlook
8.3. Europe Arabinogalactan Revenue (USD Million), by Country (2021-2032)
8.3.1. Germany Arabinogalactan Regional Analysis and Outlook
8.3.2. France Arabinogalactan Regional Analysis and Outlook
8.3.3. United Kingdom Arabinogalactan Regional Analysis and Outlook
8.3.4. Spain Arabinogalactan Regional Analysis and Outlook
8.3.5. Italy Arabinogalactan Regional Analysis and Outlook
8.3.6. Russia Arabinogalactan Regional Analysis and Outlook
8.3.7. Rest of Europe Arabinogalactan Regional Analysis and Outlook
8.4. Asia Pacific Arabinogalactan Revenue (USD Million) by Country (2021-2032)
8.4.1. China Arabinogalactan Regional Analysis and Outlook
8.4.2. Japan Arabinogalactan Regional Analysis and Outlook
8.4.3. India Arabinogalactan Regional Analysis and Outlook
8.4.4. South Korea Arabinogalactan Regional Analysis and Outlook
8.4.5. Australia Arabinogalactan Regional Analysis and Outlook
8.4.6. South East Asia Arabinogalactan Regional Analysis and Outlook
8.4.7. Rest of Asia Pacific Arabinogalactan Regional Analysis and Outlook
8.5. South America Arabinogalactan Revenue (USD Million), by Country (2021-2032)
8.5.1. Brazil Arabinogalactan Regional Analysis and Outlook
8.5.2. Argentina Arabinogalactan Regional Analysis and Outlook
8.5.3. Rest of South America Arabinogalactan Regional Analysis and Outlook
8.6. Middle East and Africa Arabinogalactan Revenue (USD Million) by Country (2021-2032)
8.6.1. Middle East Arabinogalactan Regional Analysis and Outlook
8.6.2. Africa Arabinogalactan Regional Analysis and Outlook
Chapter 9. North America Arabinogalactan Analysis and Outlook
9.1. North America Arabinogalactan Revenue (USD Million) by Segments (2021-2032)
9.1.1. North America Arabinogalactan Revenue (USD Million) by Type (2021-2032)
9.1.2. North America Arabinogalactan Revenue (USD Million) by Application (2021-2032)
9.1.3. North America Arabinogalactan Revenue (USD Million) by Product (2021-2032)
By Type
Capsule
Powder
By Application
Food and Beverage
Animal Feed
Pharmaceuticals
Cosmetic
Others
Chapter 10. Europe Arabinogalactan Analysis and Outlook
10.1. Europe Arabinogalactan Revenue (USD Million), by Segments (USD Million) (2021-2032)
10.1.1. Europe Arabinogalactan Revenue (USD Million) by Type (2021-2032)
10.1.2. Europe Arabinogalactan Revenue (USD Million) by Application (2021-2032)
10.1.3. Europe Arabinogalactan Revenue (USD Million) by Product (2021-2032)
By Type
Capsule
Powder
By Application
Food and Beverage
Animal Feed
Pharmaceuticals
Cosmetic
Others
Chapter 11. Asia Pacific Arabinogalactan Analysis and Outlook
11.1. Asia Pacific Arabinogalactan Revenue (USD Million), and Revenue (USD Million) by Segments (2021-2032)
11.1.1. Asia Pacific Arabinogalactan Revenue (USD Million) by Type (2021-2032)
11.1.2. Asia Pacific Arabinogalactan Revenue (USD Million) by Application (2021-2032)
11.1.3. Asia Pacific Arabinogalactan Revenue (USD Million) by Product (2021-2032)
By Type
Capsule
Powder
By Application
Food and Beverage
Animal Feed
Pharmaceuticals
Cosmetic
Others
Chapter 12. South America Arabinogalactan Analysis and Outlook
12.1. South America Arabinogalactan Revenue (USD Million), by Segments (2021-2032)
12.1.1. South America Arabinogalactan Revenue (USD Million) by Type (2021-2032)
12.1.2. South America Arabinogalactan Revenue (USD Million) by Application (2021-2032)
12.1.3. South America Arabinogalactan Revenue (USD Million) by Product (2021-2032)
By Type
Capsule
Powder
By Application
Food and Beverage
Animal Feed
Pharmaceuticals
Cosmetic
Others
Chapter 13. Middle East and Africa Arabinogalactan Analysis and Outlook
13.1. Middle East and Africa Arabinogalactan Revenue (USD Million), by Segments (2021-2032)
13.1.1. Middle East and Africa Arabinogalactan Revenue (USD Million) by Type (2021-2032)
13.1.2. Middle East and Africa Arabinogalactan Revenue (USD Million) by Application (2021-2032)
13.1.3. Middle East and Africa Arabinogalactan Revenue (USD Million) by Product (2021-2032)
By Type
Capsule
Powder
By Application
Food and Beverage
Animal Feed
Pharmaceuticals
Cosmetic
Others
Chapter 14. Arabinogalactan Company Profiles
14.1 Business Overview
14.2 Product Profiles
14.3 SWOT Profiles
14.5 Recent Developments
14.6 Financial Profile
List of Companies
Ametis JSC
Archer Daniels Midland Company (ADM)
BASF SE
Cargill Inc
DuPont de Nemours Inc
FoodScience of Vermont
Lonza Group AG
Pure Encapsulations
Thorne Research Inc
VetriScience Laboratories
15. Methodology and Data Sources
15.1 Customization Offerings
15.2 Subscription Services
15.3 Related Reports
15.4 Publisher Expertise
LIST OF TABLES
Table 1 Market Segmentation Analysis
Table 2 Global Arabinogalactan Market Share of Leading Companies, 2023
Table 3 Product Offerings of Leading Companies
Table 4 Low Growth Scenario Forecasts
Table 5 Reference Case Growth Scenario
Table 6 High Growth Case Scenario
Table 7 Global Arabinogalactan Revenue (USD Million) And CAGR (%) By Type (2021-2032)
Table 8 Global Arabinogalactan Revenue (USD Million) And CAGR (%) By Application (2021-2032)
Table 9 Global Arabinogalactan Revenue (USD Million) And CAGR (%) By Product (2021-2032)
Table 10 Global Arabinogalactan Market Revenue (USD Million) By Regions (2021-2032)
Table 11 Global Arabinogalactan Market Share (%) By Regions (2021-2032)
Table 12 North America Arabinogalactan Revenue (USD Million) By Country (2021-2032)
Table 13 Europe Arabinogalactan Revenue (USD Million) By Country (2021-2032)
Table 14 Asia Pacific Arabinogalactan Revenue (USD Million) By Country (2021-2032)
Table 15 South America Arabinogalactan Revenue (USD Million) By Country (2021-2032)
Table 16 Middle East and Africa Arabinogalactan Revenue (USD Million) By Region (2021-2032)
Table 17 North America Arabinogalactan Revenue (USD Million) By Type (2021-2032)
Table 18 North America Arabinogalactan Revenue (USD Million) By Application (2021-2032)
Table 19 North America Arabinogalactan Revenue (USD Million) By Product (2021-2032)
Table 20 Europe Arabinogalactan Revenue (USD Million) By Type (2021-2032)
Table 21 Europe Arabinogalactan Revenue (USD Million) By Application (2021-2032)
Table 22 Europe Arabinogalactan Revenue (USD Million) By Product (2021-2032)
Table 23 Asia Pacific Arabinogalactan Revenue (USD Million) By Type (2021-2032)
Table 24 Asia Pacific Arabinogalactan Revenue (USD Million) By Application (2021-2032)
Table 25 Asia Pacific Arabinogalactan Revenue (USD Million) By Product (2021-2032)
Table 26 South America Arabinogalactan Revenue (USD Million) By Type (2021-2032)
Table 27 South America Arabinogalactan Revenue (USD Million) By Application (2021-2032)
Table 28 South America Arabinogalactan Revenue (USD Million) By Product (2021-2032)
Table 29 Middle East and Africa Arabinogalactan Revenue (USD Million) By Type (2021-2032)
Table 30 Middle East and Africa Arabinogalactan Revenue (USD Million) By Application (2021-2032)
Table 31 Middle East and Africa Arabinogalactan Revenue (USD Million) By Product (2021-2032)
LIST OF FIGURES
Figure 1. Market Scope
Figure 2. Pricing Forecasts Per Unit, 2023- 2032
Figure 3. Porter’s Five Forces
Figure 4. Global Arabinogalactan Market Revenue (USD Million) By Regions (2021-2032)
Figure 5. Global Arabinogalactan Market Share (%) By Regions (2023)
Figure 6. North America Arabinogalactan Revenue (USD Million) By Country (2021-2032)
Figure 7. United States Arabinogalactan Revenue (USD Million) By Country (2021-2032)
Figure 8. Canada Arabinogalactan Revenue (USD Million) By Country (2021-2032)
Figure 9. Mexico Arabinogalactan Revenue (USD Million) By Country (2021-2032)
Figure 10. Europe Arabinogalactan Revenue (USD Million) By Country (2021-2032)
Figure 11. Germany Arabinogalactan Revenue (USD Million) By Country (2021-2032)
Figure 12. France Arabinogalactan Revenue (USD Million) By Country (2021-2032)
Figure 13. United Kingdom Arabinogalactan Revenue (USD Million) By Country (2021-2032)
Figure 14. Spain Arabinogalactan Revenue (USD Million) By Country (2021-2032)
Figure 15. Italy Arabinogalactan Revenue (USD Million) By Country (2021-2032)
Figure 16. Russia Arabinogalactan Revenue (USD Million) By Country (2021-2032)
Figure 17. Rest of Europe Arabinogalactan Revenue (USD Million) By Country (2021-2032)
Figure 11. Asia Pacific Arabinogalactan Revenue (USD Million) By Country (2021-2032)
Figure 12. China Arabinogalactan Revenue (USD Million) By Country (2021-2032)
Figure 13. Japan Arabinogalactan Revenue (USD Million) By Country (2021-2032)
Figure 14. India Arabinogalactan Revenue (USD Million) By Country (2021-2032)
Figure 15. South Korea Arabinogalactan Revenue (USD Million) By Country (2021-2032)
Figure 16. Australia Arabinogalactan Revenue (USD Million) By Country (2021-2032)
Figure 17. South East Asia Arabinogalactan Revenue (USD Million) By Country (2021-2032)
Figure 18. South America Arabinogalactan Revenue (USD Million) By Country (2021-2032)
Figure 19. Brazil Arabinogalactan Revenue (USD Million) By Country (2021-2032)
Figure 20. Argentina Arabinogalactan Revenue (USD Million) By Country (2021-2032)
Figure 21. Rest of Asia Pacific Arabinogalactan Revenue (USD Million) By Country (2021-2032)
Figure 22. Middle East and Africa Arabinogalactan Revenue (USD Million) By Region (2021-2032)
Figure 23. Saudi Arabia Arabinogalactan Revenue (USD Million) By Region (2021-2032)
Figure 24. The UAE Arabinogalactan Revenue (USD Million) By Region (2021-2032)
Figure 25. Rest of Middle East Arabinogalactan Revenue (USD Million) By Region (2021-2032)
Figure 26. South Africa Arabinogalactan Revenue (USD Million) By Region (2021-2032)
Figure 27. Africa Arabinogalactan Revenue (USD Million) By Region (2021-2032)
Figure 28. North America Arabinogalactan Revenue (USD Million) By Type (2021-2032)
Figure 29. North America Arabinogalactan Revenue (USD Million) By Application (2021-2032)
Figure 30. North America Arabinogalactan Revenue (USD Million) By Product (2021-2032)
Figure 31. Europe Arabinogalactan Revenue (USD Million) By Type (2021-2032)
Figure 32. Europe Arabinogalactan Revenue (USD Million) By Application (2021-2032)
Figure 33. Europe Arabinogalactan Revenue (USD Million) By Product (2021-2032)
Figure 34. Asia Pacific Arabinogalactan Revenue (USD Million) By Type (2021-2032)
Figure 35. Asia Pacific Arabinogalactan Revenue (USD Million) By Application (2021-2032)
Figure 36. Asia Pacific Arabinogalactan Revenue (USD Million) By Product (2021-2032)
Figure 37. South America Arabinogalactan Revenue (USD Million) By Type (2021-2032)
Figure 38. South America Arabinogalactan Revenue (USD Million) By Application (2021-2032)
Figure 39. South America Arabinogalactan Revenue (USD Million) By Product (2021-2032)
Figure 40. Middle East and Africa Arabinogalactan Revenue (USD Million) By Type (2021-2032)
Figure 41. Middle East and Africa Arabinogalactan Revenue (USD Million) By Application (2021-2032)
Figure 42. Middle East and Africa Arabinogalactan Revenue (USD Million) By Product (2021-2032)
By Type
Capsule
Powder
By Application
Food and Beverage
Animal Feed
Pharmaceuticals
Cosmetic
Others
Countries Analyzed
North America (US, Canada, Mexico)
Europe (Germany, UK, France, Spain, Italy, Russia, Rest of Europe)
Asia Pacific (China, India, Japan, South Korea, Australia, South East Asia, Rest of Asia)
South America (Brazil, Argentina, Rest of South America)
Middle East and Africa (Saudi Arabia, UAE, Rest of Middle East, South Africa, Egypt, Rest of Africa)
