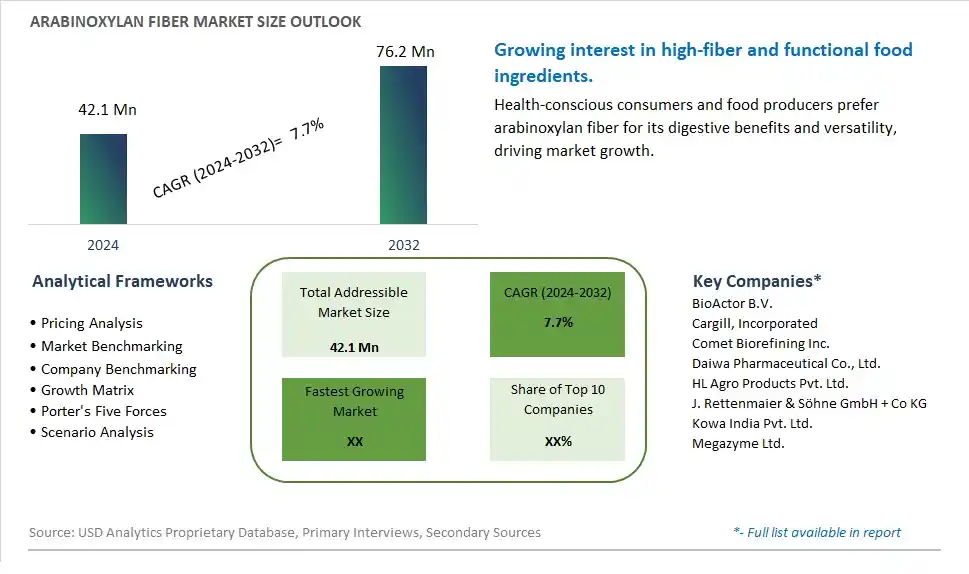
Global Arabinoxylan Fiber Market Size is valued at $42.1 Million in 2024 and is forecast to register a growth rate (CAGR) of 7.7% to reach $76.2 Million by 2032.
The global Arabinoxylan Fiber Market Comprehensive Study analyzes and forecasts the market size across 6 regions and 24 countries for diverse segments -By Type (Wheat, Rice, Barley, Oats, Maize, Others), By Application (Food, Beverages, Pharmaceutical, Animal Nutrition, Others)
An Introduction to Arabinoxylan Fiber Market
The Arabinoxylan Fiber market in 2024 is witnessing robust growth, driven by its applications in the food, beverage, and nutraceutical industries. Arabinoxylan fiber, derived from cereal grains such as wheat and corn, is valued for its dietary fiber content and prebiotic benefits. It is used to enhance the nutritional profile and functional properties of various food products, including baked goods, cereals, and beverages. The market is supported by the increasing demand for high-fiber and gut-friendly foods. Advances in extraction and processing technologies are improving the quality and efficacy of arabinoxylan fiber. The market is also benefiting from the growing awareness of the health benefits of dietary fiber and the trend towards functional and fortified foods.
Arabinoxylan Fiber Competitive Landscape
The market report analyses the leading companies in the industry including BioActor B.V., Cargill, Incorporated, Comet Biorefining Inc., Daiwa Pharmaceutical Co., Ltd., HL Agro Products Pvt. Ltd., J. Rettenmaier & Söhne GmbH + Co KG, Kowa India Pvt. Ltd., Megazyme Ltd., and Others.
Arabinoxylan Fiber Market Dynamics
Arabinoxylan Fiber Market Trend: Increasing Demand for Dietary Fiber
The Arabinoxylan Fiber market is experiencing a significant trend towards increasing demand for dietary fiber. Consumers are becoming more health-conscious and are seeking to improve their digestive health through their diet. Arabinoxylan fiber, derived from cereal grains such as wheat, barley, and rye, is recognized for its ability to support gut health, manage blood sugar levels, and promote satiety. This trend is driven by the growing awareness of the importance of dietary fiber in maintaining overall health and preventing chronic diseases, leading to a surge in the inclusion of arabinoxylan fiber in various food products and supplements.
Arabinoxylan Fiber Market Driver: Rising Health and Wellness Awareness
A major driver for the Arabinoxylan Fiber market is the rising health and wellness awareness among consumers. As more people prioritize healthy eating habits, there is an increasing demand for food products that offer functional health benefits. Arabinoxylan fiber, known for its prebiotic effects and its role in enhancing digestive health, is being increasingly incorporated into health foods, dietary supplements, and functional beverages. The ongoing emphasis on preventive health care and the role of diet in managing health conditions such as diabetes and obesity are significantly driving the demand for arabinoxylan fiber.
Arabinoxylan Fiber Market Opportunity: Innovation in Functional Foods and Beverages
Innovation in functional foods and beverages presents a substantial opportunity for the Arabinoxylan Fiber market. As the market for functional foods continues to expand, there is significant potential for developing new products that incorporate arabinoxylan fiber to enhance their health benefits. This includes high-fiber breads, cereals, health bars, and probiotic drinks. By focusing on innovative product development and leveraging the health benefits of arabinoxylan fiber, manufacturers can tap into the growing consumer demand for foods that support digestive health and overall wellness, driving market growth and differentiation in the competitive functional foods sector.
Arabinoxylan Fiber Market Share Analysis: Arabinoxylan Fiber from Wheat segment generated the highest revenue share in the industry
The largest segment in the Arabinoxylan Fiber Market is Arabinoxylan Fiber from Wheat. Wheat-based Arabinoxylan Fiber holds a dominant position within the market due to several factors. Firstly, wheat is one of the most widely cultivated and consumed grains globally, ensuring a steady and robust supply chain for Arabinoxylan Fiber extraction. Further, wheat-based Arabinoxylan Fiber is renowned for its high nutritional value, containing a significant amount of dietary fiber that contributes to digestive health, cholesterol management, and blood sugar regulation. This inherent nutritional profile has led to its widespread incorporation into various food and beverage products, dietary supplements, and functional foods targeting health-conscious consumers. Additionally, ongoing research and technological advancements in wheat processing techniques have resulted in the development of innovative extraction methods that enhance the yield and quality of Arabinoxylan Fiber from wheat. These factors collectively contribute to the dominance of Arabinoxylan Fiber from Wheat as the largest segment in the Arabinoxylan Fiber Market, with sustained growth expected in the coming years.
Arabinoxylan Fiber Market Share Analysis: Food Industry is the fastest growing segment over the forecast period to 2032
The fastest-growing segment in the Arabinoxylan Fiber Market is its application in the food industry. Arabinoxylan Fiber's rapid growth in this sector is driven by several factors. Firstly, there is a growing consumer awareness and preference for healthy and natural ingredients in food products. Arabinoxylan Fiber, being a soluble dietary fiber derived from plant sources, aligns perfectly with this trend as it offers various health benefits, including improved digestive health, weight management, and cholesterol reduction. Further, food manufacturers are increasingly incorporating Arabinoxylan Fiber into a wide range of food products such as bread, cereal bars, pasta, and snacks to enhance their nutritional profile and appeal to health-conscious consumers. Further, Arabinoxylan Fiber's functional properties, such as water-binding capacity and textural enhancement, make it a versatile ingredient for improving product quality and shelf life. As a result, the demand for Arabinoxylan Fiber in the food industry is expected to experience significant growth and expansion by 2032, driven by evolving consumer preferences and advancements in food technology.
Arabinoxylan Fiber Market Segmentation
By Type
Wheat
Rice
Barley
Oats
Maize
Others
By Application
Food
Beverages
Pharmaceutical
Animal Nutrition
Others
Countries Analyzed
North America (US, Canada, Mexico)
Europe (Germany, UK, France, Spain, Italy, Russia, Rest of Europe)
Asia Pacific (China, India, Japan, South Korea, Australia, South East Asia, Rest of Asia)
South America (Brazil, Argentina, Rest of South America)
Middle East and Africa (Saudi Arabia, UAE, Rest of Middle East, South Africa, Egypt, Rest of Africa)
Arabinoxylan Fiber Companies Profiled in the Study
BioActor B.V.
Cargill, Incorporated
Comet Biorefining Inc.
Daiwa Pharmaceutical Co., Ltd.
HL Agro Products Pvt. Ltd.
J. Rettenmaier & Söhne GmbH + Co KG
Kowa India Pvt. Ltd.
Megazyme Ltd.
*- List Not Exhaustive
Chapter 1. TABLE OF CONTENTS
Chapter 2. Introduction to Arabinoxylan Fiber Market
2.1. Market Overview
2.2. Key Statistics and Report Highlights
2.3. Scope of the Comprehensive Study
2.3.1. Market Definition
2.3.2 Countries and Regions Covered
2.3.3 Research Objective
2.3.4 Units, Currency, and Conversions
2.3.5 Industry Value Chain
2.4. Key Market Segments
2.5. Key Companies
2.6. Study Period
Chapter 3. Strategic Analysis Review
3.1. Arabinoxylan Fiber Pricing Analysis and Forecast
3.2. Porter’s Five Forces
3.3. Market Ecosystem
3.4. SWOT Analysis
3.5. Regulatory Scenario
3.3. Effects of Inflation, Russia-Ukraine War, moderating economic growth, and other macroeconomic factors
Chapter 4. Competitive Landscape
4.1. Market Share Analysis
4.1.1. Global Arabinoxylan Fiber Market Share by Company, 2023
4.1.2. Product Offerings of Leading Arabinoxylan Fiber Companies
4.2. Market Entropy
4.2.1. New Product Launches in the Industry
4.2.2. Mergers, Acquisitions, Joint ventures, and Partnerships
4.3. Key Strategies and Best Practices
Chapter 5. Global Market Projections: Best, Reference, and Low Case Scenarios
5.1. Growth Analysis- Case Scenario Definitions
5.2. Low Growth Case Scenario Forecasts
5.3. Reference Growth Case Scenario Forecasts
5.4. High Growth Case Scenario Forecasts
Chapter 6. Market Dynamics
6.1. Arabinoxylan Fiber Market Drivers
6.2. Arabinoxylan Fiber Market Challenges
6.6. Arabinoxylan Fiber Market Opportunities
6.4. Arabinoxylan Fiber Market Trends
Chapter 7. Global Arabinoxylan Fiber Market Outlook Trends
7.1. Global Arabinoxylan Fiber Revenue (USD Million) and CAGR (%) by Type (2021-2032)
7.2. Global Arabinoxylan Fiber Revenue (USD Million) and CAGR (%) by Application (2021-2032)
7.3. Global Arabinoxylan Fiber Revenue (USD Million) and CAGR (%) by Product (2021-2032)
By Type
Wheat
Rice
Barley
Oats
Maize
Others
By Application
Food
Beverages
Pharmaceutical
Animal Nutrition
Others
Chapter 8. Global Arabinoxylan Fiber Regional Analysis and Outlook
8.1. Global Arabinoxylan Fiber Revenue (USD Million) By Regions (2021- 2032)
8.2. North America Arabinoxylan Fiber Revenue (USD Million) by Country (2021-2032)
8.2.1. United States Arabinoxylan Fiber Regional Analysis and Outlook
8.2.2. Canada Arabinoxylan Fiber Regional Analysis and Outlook
8.2.3. Mexico Arabinoxylan Fiber Regional Analysis and Outlook
8.3. Europe Arabinoxylan Fiber Revenue (USD Million), by Country (2021-2032)
8.3.1. Germany Arabinoxylan Fiber Regional Analysis and Outlook
8.3.2. France Arabinoxylan Fiber Regional Analysis and Outlook
8.3.3. United Kingdom Arabinoxylan Fiber Regional Analysis and Outlook
8.3.4. Spain Arabinoxylan Fiber Regional Analysis and Outlook
8.3.5. Italy Arabinoxylan Fiber Regional Analysis and Outlook
8.3.6. Russia Arabinoxylan Fiber Regional Analysis and Outlook
8.3.7. Rest of Europe Arabinoxylan Fiber Regional Analysis and Outlook
8.4. Asia Pacific Arabinoxylan Fiber Revenue (USD Million) by Country (2021-2032)
8.4.1. China Arabinoxylan Fiber Regional Analysis and Outlook
8.4.2. Japan Arabinoxylan Fiber Regional Analysis and Outlook
8.4.3. India Arabinoxylan Fiber Regional Analysis and Outlook
8.4.4. South Korea Arabinoxylan Fiber Regional Analysis and Outlook
8.4.5. Australia Arabinoxylan Fiber Regional Analysis and Outlook
8.4.6. South East Asia Arabinoxylan Fiber Regional Analysis and Outlook
8.4.7. Rest of Asia Pacific Arabinoxylan Fiber Regional Analysis and Outlook
8.5. South America Arabinoxylan Fiber Revenue (USD Million), by Country (2021-2032)
8.5.1. Brazil Arabinoxylan Fiber Regional Analysis and Outlook
8.5.2. Argentina Arabinoxylan Fiber Regional Analysis and Outlook
8.5.3. Rest of South America Arabinoxylan Fiber Regional Analysis and Outlook
8.6. Middle East and Africa Arabinoxylan Fiber Revenue (USD Million) by Country (2021-2032)
8.6.1. Middle East Arabinoxylan Fiber Regional Analysis and Outlook
8.6.2. Africa Arabinoxylan Fiber Regional Analysis and Outlook
Chapter 9. North America Arabinoxylan Fiber Analysis and Outlook
9.1. North America Arabinoxylan Fiber Revenue (USD Million) by Segments (2021-2032)
9.1.1. North America Arabinoxylan Fiber Revenue (USD Million) by Type (2021-2032)
9.1.2. North America Arabinoxylan Fiber Revenue (USD Million) by Application (2021-2032)
9.1.3. North America Arabinoxylan Fiber Revenue (USD Million) by Product (2021-2032)
By Type
Wheat
Rice
Barley
Oats
Maize
Others
By Application
Food
Beverages
Pharmaceutical
Animal Nutrition
Others
Chapter 10. Europe Arabinoxylan Fiber Analysis and Outlook
10.1. Europe Arabinoxylan Fiber Revenue (USD Million), by Segments (USD Million) (2021-2032)
10.1.1. Europe Arabinoxylan Fiber Revenue (USD Million) by Type (2021-2032)
10.1.2. Europe Arabinoxylan Fiber Revenue (USD Million) by Application (2021-2032)
10.1.3. Europe Arabinoxylan Fiber Revenue (USD Million) by Product (2021-2032)
By Type
Wheat
Rice
Barley
Oats
Maize
Others
By Application
Food
Beverages
Pharmaceutical
Animal Nutrition
Others
Chapter 11. Asia Pacific Arabinoxylan Fiber Analysis and Outlook
11.1. Asia Pacific Arabinoxylan Fiber Revenue (USD Million), and Revenue (USD Million) by Segments (2021-2032)
11.1.1. Asia Pacific Arabinoxylan Fiber Revenue (USD Million) by Type (2021-2032)
11.1.2. Asia Pacific Arabinoxylan Fiber Revenue (USD Million) by Application (2021-2032)
11.1.3. Asia Pacific Arabinoxylan Fiber Revenue (USD Million) by Product (2021-2032)
By Type
Wheat
Rice
Barley
Oats
Maize
Others
By Application
Food
Beverages
Pharmaceutical
Animal Nutrition
Others
Chapter 12. South America Arabinoxylan Fiber Analysis and Outlook
12.1. South America Arabinoxylan Fiber Revenue (USD Million), by Segments (2021-2032)
12.1.1. South America Arabinoxylan Fiber Revenue (USD Million) by Type (2021-2032)
12.1.2. South America Arabinoxylan Fiber Revenue (USD Million) by Application (2021-2032)
12.1.3. South America Arabinoxylan Fiber Revenue (USD Million) by Product (2021-2032)
By Type
Wheat
Rice
Barley
Oats
Maize
Others
By Application
Food
Beverages
Pharmaceutical
Animal Nutrition
Others
Chapter 13. Middle East and Africa Arabinoxylan Fiber Analysis and Outlook
13.1. Middle East and Africa Arabinoxylan Fiber Revenue (USD Million), by Segments (2021-2032)
13.1.1. Middle East and Africa Arabinoxylan Fiber Revenue (USD Million) by Type (2021-2032)
13.1.2. Middle East and Africa Arabinoxylan Fiber Revenue (USD Million) by Application (2021-2032)
13.1.3. Middle East and Africa Arabinoxylan Fiber Revenue (USD Million) by Product (2021-2032)
By Type
Wheat
Rice
Barley
Oats
Maize
Others
By Application
Food
Beverages
Pharmaceutical
Animal Nutrition
Others
Chapter 14. Arabinoxylan Fiber Company Profiles
14.1 Business Overview
14.2 Product Profiles
14.3 SWOT Profiles
14.5 Recent Developments
14.6 Financial Profile
List of Companies
BioActor B.V.
Cargill, Incorporated
Comet Biorefining Inc.
Daiwa Pharmaceutical Co., Ltd.
HL Agro Products Pvt. Ltd.
J. Rettenmaier & Söhne GmbH + Co KG
Kowa India Pvt. Ltd.
Megazyme Ltd.
15. Methodology and Data Sources
15.1 Customization Offerings
15.2 Subscription Services
15.3 Related Reports
15.4 Publisher Expertise
LIST OF TABLES
Table 1 Market Segmentation Analysis
Table 2 Global Arabinoxylan Fiber Market Share of Leading Companies, 2023
Table 3 Product Offerings of Leading Companies
Table 4 Low Growth Scenario Forecasts
Table 5 Reference Case Growth Scenario
Table 6 High Growth Case Scenario
Table 7 Global Arabinoxylan Fiber Revenue (USD Million) And CAGR (%) By Type (2021-2032)
Table 8 Global Arabinoxylan Fiber Revenue (USD Million) And CAGR (%) By Application (2021-2032)
Table 9 Global Arabinoxylan Fiber Revenue (USD Million) And CAGR (%) By Product (2021-2032)
Table 10 Global Arabinoxylan Fiber Market Revenue (USD Million) By Regions (2021-2032)
Table 11 Global Arabinoxylan Fiber Market Share (%) By Regions (2021-2032)
Table 12 North America Arabinoxylan Fiber Revenue (USD Million) By Country (2021-2032)
Table 13 Europe Arabinoxylan Fiber Revenue (USD Million) By Country (2021-2032)
Table 14 Asia Pacific Arabinoxylan Fiber Revenue (USD Million) By Country (2021-2032)
Table 15 South America Arabinoxylan Fiber Revenue (USD Million) By Country (2021-2032)
Table 16 Middle East and Africa Arabinoxylan Fiber Revenue (USD Million) By Region (2021-2032)
Table 17 North America Arabinoxylan Fiber Revenue (USD Million) By Type (2021-2032)
Table 18 North America Arabinoxylan Fiber Revenue (USD Million) By Application (2021-2032)
Table 19 North America Arabinoxylan Fiber Revenue (USD Million) By Product (2021-2032)
Table 20 Europe Arabinoxylan Fiber Revenue (USD Million) By Type (2021-2032)
Table 21 Europe Arabinoxylan Fiber Revenue (USD Million) By Application (2021-2032)
Table 22 Europe Arabinoxylan Fiber Revenue (USD Million) By Product (2021-2032)
Table 23 Asia Pacific Arabinoxylan Fiber Revenue (USD Million) By Type (2021-2032)
Table 24 Asia Pacific Arabinoxylan Fiber Revenue (USD Million) By Application (2021-2032)
Table 25 Asia Pacific Arabinoxylan Fiber Revenue (USD Million) By Product (2021-2032)
Table 26 South America Arabinoxylan Fiber Revenue (USD Million) By Type (2021-2032)
Table 27 South America Arabinoxylan Fiber Revenue (USD Million) By Application (2021-2032)
Table 28 South America Arabinoxylan Fiber Revenue (USD Million) By Product (2021-2032)
Table 29 Middle East and Africa Arabinoxylan Fiber Revenue (USD Million) By Type (2021-2032)
Table 30 Middle East and Africa Arabinoxylan Fiber Revenue (USD Million) By Application (2021-2032)
Table 31 Middle East and Africa Arabinoxylan Fiber Revenue (USD Million) By Product (2021-2032)
LIST OF FIGURES
Figure 1. Market Scope
Figure 2. Pricing Forecasts Per Unit, 2023- 2032
Figure 3. Porter’s Five Forces
Figure 4. Global Arabinoxylan Fiber Market Revenue (USD Million) By Regions (2021-2032)
Figure 5. Global Arabinoxylan Fiber Market Share (%) By Regions (2023)
Figure 6. North America Arabinoxylan Fiber Revenue (USD Million) By Country (2021-2032)
Figure 7. United States Arabinoxylan Fiber Revenue (USD Million) By Country (2021-2032)
Figure 8. Canada Arabinoxylan Fiber Revenue (USD Million) By Country (2021-2032)
Figure 9. Mexico Arabinoxylan Fiber Revenue (USD Million) By Country (2021-2032)
Figure 10. Europe Arabinoxylan Fiber Revenue (USD Million) By Country (2021-2032)
Figure 11. Germany Arabinoxylan Fiber Revenue (USD Million) By Country (2021-2032)
Figure 12. France Arabinoxylan Fiber Revenue (USD Million) By Country (2021-2032)
Figure 13. United Kingdom Arabinoxylan Fiber Revenue (USD Million) By Country (2021-2032)
Figure 14. Spain Arabinoxylan Fiber Revenue (USD Million) By Country (2021-2032)
Figure 15. Italy Arabinoxylan Fiber Revenue (USD Million) By Country (2021-2032)
Figure 16. Russia Arabinoxylan Fiber Revenue (USD Million) By Country (2021-2032)
Figure 17. Rest of Europe Arabinoxylan Fiber Revenue (USD Million) By Country (2021-2032)
Figure 11. Asia Pacific Arabinoxylan Fiber Revenue (USD Million) By Country (2021-2032)
Figure 12. China Arabinoxylan Fiber Revenue (USD Million) By Country (2021-2032)
Figure 13. Japan Arabinoxylan Fiber Revenue (USD Million) By Country (2021-2032)
Figure 14. India Arabinoxylan Fiber Revenue (USD Million) By Country (2021-2032)
Figure 15. South Korea Arabinoxylan Fiber Revenue (USD Million) By Country (2021-2032)
Figure 16. Australia Arabinoxylan Fiber Revenue (USD Million) By Country (2021-2032)
Figure 17. South East Asia Arabinoxylan Fiber Revenue (USD Million) By Country (2021-2032)
Figure 18. South America Arabinoxylan Fiber Revenue (USD Million) By Country (2021-2032)
Figure 19. Brazil Arabinoxylan Fiber Revenue (USD Million) By Country (2021-2032)
Figure 20. Argentina Arabinoxylan Fiber Revenue (USD Million) By Country (2021-2032)
Figure 21. Rest of Asia Pacific Arabinoxylan Fiber Revenue (USD Million) By Country (2021-2032)
Figure 22. Middle East and Africa Arabinoxylan Fiber Revenue (USD Million) By Region (2021-2032)
Figure 23. Saudi Arabia Arabinoxylan Fiber Revenue (USD Million) By Region (2021-2032)
Figure 24. The UAE Arabinoxylan Fiber Revenue (USD Million) By Region (2021-2032)
Figure 25. Rest of Middle East Arabinoxylan Fiber Revenue (USD Million) By Region (2021-2032)
Figure 26. South Africa Arabinoxylan Fiber Revenue (USD Million) By Region (2021-2032)
Figure 27. Africa Arabinoxylan Fiber Revenue (USD Million) By Region (2021-2032)
Figure 28. North America Arabinoxylan Fiber Revenue (USD Million) By Type (2021-2032)
Figure 29. North America Arabinoxylan Fiber Revenue (USD Million) By Application (2021-2032)
Figure 30. North America Arabinoxylan Fiber Revenue (USD Million) By Product (2021-2032)
Figure 31. Europe Arabinoxylan Fiber Revenue (USD Million) By Type (2021-2032)
Figure 32. Europe Arabinoxylan Fiber Revenue (USD Million) By Application (2021-2032)
Figure 33. Europe Arabinoxylan Fiber Revenue (USD Million) By Product (2021-2032)
Figure 34. Asia Pacific Arabinoxylan Fiber Revenue (USD Million) By Type (2021-2032)
Figure 35. Asia Pacific Arabinoxylan Fiber Revenue (USD Million) By Application (2021-2032)
Figure 36. Asia Pacific Arabinoxylan Fiber Revenue (USD Million) By Product (2021-2032)
Figure 37. South America Arabinoxylan Fiber Revenue (USD Million) By Type (2021-2032)
Figure 38. South America Arabinoxylan Fiber Revenue (USD Million) By Application (2021-2032)
Figure 39. South America Arabinoxylan Fiber Revenue (USD Million) By Product (2021-2032)
Figure 40. Middle East and Africa Arabinoxylan Fiber Revenue (USD Million) By Type (2021-2032)
Figure 41. Middle East and Africa Arabinoxylan Fiber Revenue (USD Million) By Application (2021-2032)
Figure 42. Middle East and Africa Arabinoxylan Fiber Revenue (USD Million) By Product (2021-2032)
By Type
Wheat
Rice
Barley
Oats
Maize
Others
By Application
Food
Beverages
Pharmaceutical
Animal Nutrition
Others
Countries Analyzed
North America (US, Canada, Mexico)
Europe (Germany, UK, France, Spain, Italy, Russia, Rest of Europe)
Asia Pacific (China, India, Japan, South Korea, Australia, South East Asia, Rest of Asia)
South America (Brazil, Argentina, Rest of South America)
Middle East and Africa (Saudi Arabia, UAE, Rest of Middle East, South Africa, Egypt, Rest of Africa)
