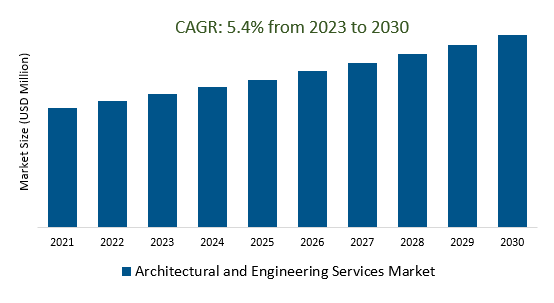
The Global Architectural and Engineering Services Market Size is estimated to register 5.4% growth over the forecast period from 2023 to 2030.
The architectural and engineering industry is undergoing a digital transformation that is fueling its market growth. This transformation is characterized by a growing emphasis on collaboration platforms and cloud-based tools, enabling real-time collaboration among architects, engineers, contractors, and clients, leading to more efficient project management and remote work. Integrated software solutions, including project management systems and document management tools, are playing a vital role in enhancing communication and data sharing across the project's lifecycle. Leading Companies focusing on Smart Cities and Infrastructure Development, Renewable Energy and Net-Zero Buildings, Aging Infrastructure Renovation, Healthcare and Biotechnology Facilities, Resilience and Disaster Preparedness, and others to boost market shares in the industry.
Market Overview
The architectural and engineering services market encompasses a range of professional services related to construction projects, including architecture, engineering, and consulting. Key trends include a focus on sustainability, technological advancements like BIM and AI, and the need to address aging infrastructure. Challenges include economic sensitivity, competition, talent shortages, and increasing project complexity.
Market Dynamics
Market Trends- Architectural and engineering services play a crucial role in fortifying the built environment, ensuring its resilience against various challenges, and shaping a more sustainable and adaptable future.
Architectural and engineering services are instrumental in ensuring the resilience and sustainability of the built environment. These professionals design structures that withstand challenges like climate change and urbanization while embracing energy efficiency and environmental considerations. Their work harmonizes human needs and technological advancements to create a more resilient and sustainable world.
Market Driver- The rapid advancement of technologies is transforming the architectural and engineering services market, fueling demand for innovative solutions that enhance efficiency, sustainability, and design capabilities.
The rapid advancement of technologies is driving transformation in the architectural and engineering services market, with a focus on innovations like Building Information Modeling (BIM), artificial intelligence (AI), augmented reality (AR), and virtual reality (VR). These technologies are enhancing efficiency, sustainability, and design capabilities, offering more immersive visualization and automating tasks, ultimately pushing the industry into an era of unprecedented innovation.
Market Opportunity- Sustainability and green design principles are increasingly influencing the architectural and engineering services market, driving demand for solutions that minimize environmental impact and promote resource efficiency throughout the building lifecycle.
Sustainability and green design principles are wielding a substantial influence over the architectural and engineering services market, fueling a growing demand for solutions that emphasize environmental conscientiousness and resource efficiency throughout the building lifecycle. This trend underscores the industry's dedication to diminishing its ecological impact and confronting the challenges of climate change. Architects and engineers are increasingly incorporating sustainable materials, energy-efficient technologies, and renewable energy sources into their designs. Concepts like net-zero energy structures, passive design methods, and green building certifications, including LEED (Leadership in Energy and Environmental Design), are steadily gaining momentum. With a strong focus on reducing carbon emissions and safeguarding natural resources, the architectural and engineering sector is at the forefront of promoting a more ecologically responsible and sustainable built environment.
Market Share Analysis- Architectural Services Architectural and Engineering Services Market will register the fastest growth
The Global Architectural and Engineering Services Market is analyzed across Architectural Services, Engineering Services, and others. Architectural Services is poised to register the fastest growth. Architectural services are a core component of the architectural and engineering services market, involving the design and coordination of architectural elements in construction projects. Architects are responsible for the aesthetic and functional aspects of buildings, while the broader market encompasses various engineering disciplines, addressing the technical and structural aspects of construction. This sector is influenced by trends like sustainability and technological advancements, shaping the future of construction and infrastructure development.
Market Share Analysis- Building construction held a significant market share in 2023
The Global Architectural and Engineering Services Market is analyzed across various applications including Building Construction, Mining, Information Technology, Power and Energy, Transportation, Manufacturing Industries, and others. Of these, building construction held a significant market share in 2023. The building construction sector is closely intertwined with the architectural and engineering services market, where the latter provides the design and technical specifications for construction projects. Building construction involves the physical realization of these designs, spanning various types of structures. Architectural and engineering expertise is essential for the efficient and safe execution of construction projects, with collaboration among professionals being key. This sector is influenced by sustainability and technology trends, aiming to create more efficient and resilient built environments.
Architectural and Engineering Services Market Segmentation
By Type
- Architectural Services
- Engineering services
- Others
By Application
- Building Construction
- Mining
- Information Technology
- Power and Energy
- Transportation
- Manufacturing Industries
- Others
By Region
- North America (United States, Canada, Mexico)
- Europe (Germany, France, United Kingdom, Spain, Italy, Others)
- Asia Pacific (China, India, Japan, South Korea, Australia, Others)
- Latin America (Brazil, Argentina, Others)
- Middle East and Africa (Saudi Arabia, UAE, Kuwait, Other Middle East, South Africa, Nigeria, Other Africa)
Architectural and Engineering Services Market Companies
- HDR Architecture
- IBI Group Inc
- AECOM
- Perkins Eastman
- Gensler
- Nikken Sekkei
- Foster & Partners Limited
- HOCHTIEF AG
- Jacobs
- SNC-Lavalin
- Perkins & Will
- PCL Constructors Inc
- DP Architects
- Fluor
- HKS, INC
- HOK
- WorleyParsons
- Bechtel
- Aedas
- Stantec
*List not exhaustive
Architectural and Engineering Services Market Outlook 2023
1 Market Overview
1.1 Introduction to the Architectural and Engineering Services Market
1.2 Scope of the Study
1.3 Research Objective
1.3.1 Key Market Scope and Segments
1.3.2 Players Covered
1.3.3 Years Considered
2 Executive Summary
2.1 2023 Architectural and Engineering Services Industry- Market Statistics
3 Market Dynamics
3.1 Market Drivers
3.2 Market Challenges
3.3 Market Opportunities
3.4 Market Trends
4 Market Factor Analysis
4.1 Porter’s Five Forces
4.2 Market Entropy
4.2.1 Global Architectural and Engineering Services Market Companies with Area Served
4.2.2 Products Offerings Global Architectural and Engineering Services Market
5 COVID-19 Impact Analysis and Outlook Scenarios
5.1.1 Covid-19 Impact Analysis
5.1.2 post-COVID-19 Scenario- Low Growth Case
5.1.3 post-COVID-19 Scenario- Reference Growth Case
5.1.4 post-COVID-19 Scenario- Low Growth Case
6 Global Architectural and Engineering Services Market Trends
6.1 Global Architectural and Engineering Services Revenue (USD Million) and CAGR (%) by Type (2018-2030)
6.2 Global Architectural and Engineering Services Revenue (USD Million) and CAGR (%) by Applications (2018-2030)
6.3 Global Architectural and Engineering Services Revenue (USD Million) and CAGR (%) by regions (2018-2030)
7 Global Architectural and Engineering Services Market Revenue (USD Million) by Type, and Applications (2018-2022)
7.1 Global Architectural and Engineering Services Revenue (USD Million) by Type (2018-2022)
7.1.1 Global Architectural and Engineering Services Revenue (USD Million), Market Share (%) by Type (2018-2022)
7.2 Global Architectural and Engineering Services Revenue (USD Million) by Applications (2018-2022)
7.2.1 Global Architectural and Engineering Services Revenue (USD Million), Market Share (%) by Applications (2018-2022)
8 Global Architectural and Engineering Services Development Regional Status and Outlook
8.1 Global Architectural and Engineering Services Revenue (USD Million) By Regions (2018-2022)
8.2 North America Architectural and Engineering Services Revenue (USD Million) by Type, and Application (2018-2022)
8.2.1 North America Architectural and Engineering Services Revenue (USD Million) by Country (2018-2022)
8.2.2 North America Architectural and Engineering Services Revenue (USD Million) by Type (2018-2022)
8.2.3 North America Architectural and Engineering Services Revenue (USD Million) by Applications (2018-2022)
8.3 Europe Architectural and Engineering Services Revenue (USD Million), by Type, and Applications (USD Million) (2018-2022)
8.3.1 Europe Architectural and Engineering Services Revenue (USD Million), by Country (2018-2022)
8.3.2 Europe Architectural and Engineering Services Revenue (USD Million) by Type (2018-2022)
8.3.3 Europe Architectural and Engineering Services Revenue (USD Million) by Applications (2018-2022)
8.4 Asia Pacific Architectural and Engineering Services Revenue (USD Million), and Revenue (USD Million) by Type, and Applications (2018-2022)
8.4.1 Asia Pacific Architectural and Engineering Services Revenue (USD Million) by Country (2018-2022)
8.4.2 Asia Pacific Architectural and Engineering Services Revenue (USD Million) by Type (2018-2022)
8.4.3 Asia Pacific Architectural and Engineering Services Revenue (USD Million) by Applications (2018-2022)
8.5 South America Architectural and Engineering Services Revenue (USD Million), by Type, and Applications (2018-2022)
8.5.1 South America Architectural and Engineering Services Revenue (USD Million), by Country (2018-2022)
8.5.2 South America Architectural and Engineering Services Revenue (USD Million) by Type (2018-2022)
8.5.3 South America Architectural and Engineering Services Revenue (USD Million) by Applications (2018-2022)
8.6 Middle East and Africa Architectural and Engineering Services Revenue (USD Million), by Type, Technology, Application, Thickness (2018-2022)
8.6.1 Middle East and Africa Architectural and Engineering Services Revenue (USD Million) by Country (2018-2022)
8.6.2 Middle East and Africa Architectural and Engineering Services Revenue (USD Million) by Type (2018-2022)
8.6.3 Middle East and Africa Architectural and Engineering Services Revenue (USD Million) by Applications (2018-2022)
9 Company Profiles
10 Global Architectural and Engineering Services Market Revenue (USD Million), by Type, and Applications (2023-2030)
10.1 Global Architectural and Engineering Services Revenue (USD Million) and Market Share (%) by Type (2023-2030)
10.1.1 Global Architectural and Engineering Services Revenue (USD Million), and Market Share (%) by Type (2023-2030)
10.2 Global Architectural and Engineering Services Revenue (USD Million) and Market Share (%) by Applications (2023-2030)
10.2.1 Global Architectural and Engineering Services Revenue (USD Million), and Market Share (%) by Applications (2023-2030)
11 Global Architectural and Engineering Services Development Regional Status and Outlook Forecast
11.1 Global Architectural and Engineering Services Revenue (USD Million) By Regions (2023-2030)
11.2 North America Architectural and Engineering Services Revenue (USD Million) by Type, and Applications (2023-2030)
11.2.1 North America Architectural and Engineering Services Revenue (USD) Million by Country (2023-2030)
11.2.2 North America Architectural and Engineering Services Revenue (USD Million), by Type (2023-2030)
11.2.3 North America Architectural and Engineering Services Revenue (USD Million), Market Share (%) by Applications (2023-2030)
11.3 Europe Architectural and Engineering Services Revenue (USD Million), by Type, and Applications (2023-2030)
11.3.1 Europe Architectural and Engineering Services Revenue (USD Million), by Country (2023-2030)
11.3.2 Europe Architectural and Engineering Services Revenue (USD Million), by Type (2023-2030)
11.3.3 Europe Architectural and Engineering Services Revenue (USD Million), by Applications (2023-2030)
11.4 Asia Pacific Architectural and Engineering Services Revenue (USD Million) by Type, and Applications (2023-2030)
11.4.1 Asia Pacific Architectural and Engineering Services Revenue (USD Million), by Country (2023-2030)
11.4.2 Asia Pacific Architectural and Engineering Services Revenue (USD Million), by Type (2023-2030)
11.4.3 Asia Pacific Architectural and Engineering Services Revenue (USD Million), by Applications (2023-2030)
11.5 South America Architectural and Engineering Services Revenue (USD Million), by Type, and Applications (2023-2030)
11.5.1 South America Architectural and Engineering Services Revenue (USD Million), by Country (2023-2030)
11.5.2 South America Architectural and Engineering Services Revenue (USD Million), by Type (2023-2030)
11.5.3 South America Architectural and Engineering Services Revenue (USD Million), by Applications (2023-2030)
11.6 Middle East and Africa Architectural and Engineering Services Revenue (USD Million), by Type, and Applications (2023-2030)
11.6.1 Middle East and Africa Architectural and Engineering Services Revenue (USD Million), by region (2023-2030)
11.6.2 Middle East and Africa Architectural and Engineering Services Revenue (USD Million), by Type (2023-2030)
11.6.3 Middle East and Africa Architectural and Engineering Services Revenue (USD Million), by Applications (2023-2030)
12 Methodology and Data Sources
12.1 Methodology/Research Approach
12.1.1 Research Programs/Design
12.1.2 Market Size Estimation
12.1.3 Market Breakdown and Data Triangulation
12.2 Data Sources
12.2.1 Secondary Sources
12.2.2 Primary Sources
12.3 Disclaimer
List of Tables
Table 1 Market Segmentation Analysis
Table 2 Global Architectural and Engineering Services Market Companies with Areas Served
Table 3 Products Offerings Global Architectural and Engineering Services Market
Table 4 Low Growth Scenario Forecasts
Table 5 Reference Case Growth Scenario
Table 6 High Growth Case Scenario
Table 7 Global Architectural and Engineering Services Revenue (USD Million) And CAGR (%) By Type (2018-2030)
Table 8 Global Architectural and Engineering Services Revenue (USD Million) And CAGR (%) By Applications (2018-2030)
Table 9 Global Architectural and Engineering Services Revenue (USD Million) And CAGR (%) By Regions (2018-2030)
Table 10 Global Architectural and Engineering Services Revenue (USD Million) By Type (2018-2022)
Table 11 Global Architectural and Engineering Services Revenue Market Share (%) By Type (2018-2022)
Table 12 Global Architectural and Engineering Services Revenue (USD Million) By Applications (2018-2022)
Table 13 Global Architectural and Engineering Services Revenue Market Share (%) By Applications (2018-2022)
Table 14 Global Architectural and Engineering Services Market Revenue (USD Million) By Regions (2018-2022)
Table 15 Global Architectural and Engineering Services Market Share (%) By Regions (2018-2022)
Table 16 North America Architectural and Engineering Services Revenue (USD Million) By Country (2018-2022)
Table 17 North America Architectural and Engineering Services Revenue (USD Million) By Type (2018-2022)
Table 18 North America Architectural and Engineering Services Revenue (USD Million) By Applications (2018-2022)
Table 19 Europe Architectural and Engineering Services Revenue (USD Million) By Country (2018-2022)
Table 20 Europe Architectural and Engineering Services Revenue (USD Million) By Type (2018-2022)
Table 21 Europe Architectural and Engineering Services Revenue (USD Million) By Applications (2018-2022)
Table 22 Asia Pacific Architectural and Engineering Services Revenue (USD Million) By Country (2018-2022)
Table 23 Asia Pacific Architectural and Engineering Services Revenue (USD Million) By Type (2018-2022)
Table 24 Asia Pacific Architectural and Engineering Services Revenue (USD Million) By Applications (2018-2022)
Table 25 South America Architectural and Engineering Services Revenue (USD Million) By Country (2018-2022)
Table 26 South America Architectural and Engineering Services Revenue (USD Million) By Type (2018-2022)
Table 27 South America Architectural and Engineering Services Revenue (USD Million) By Applications (2018-2022)
Table 28 Middle East and Africa Architectural and Engineering Services Revenue (USD Million) By Region (2018-2022)
Table 29 Middle East and Africa Architectural and Engineering Services Revenue (USD Million) By Type (2018-2022)
Table 30 Middle East and Africa Architectural and Engineering Services Revenue (USD Million) By Applications (2018-2022)
Table 31 Financial Analysis
Table 32 Global Architectural and Engineering Services Revenue (USD Million) By Type (2023-2030)
Table 33 Global Architectural and Engineering Services Revenue Market Share (%) By Type (2023-2030)
Table 34 Global Architectural and Engineering Services Revenue (USD Million) By Applications (2023-2030)
Table 35 Global Architectural and Engineering Services Revenue Market Share (%) By Applications (2023-2030)
Table 36 Global Architectural and Engineering Services Market Revenue (USD Million), And Revenue (USD Million) By Regions (2023-2030)
Table 37 North America Architectural and Engineering Services Revenue (USD)By Country (2023-2030)
Table 38 North America Architectural and Engineering Services Revenue (USD Million) By Type (2023-2030)
Table 39 North America Architectural and Engineering Services Revenue (USD Million) By Applications (2023-2030)
Table 40 Europe Architectural and Engineering Services Revenue (USD Million) By Country (2023-2030)
Table 41 Europe Architectural and Engineering Services Revenue (USD Million) By Type (2023-2030)
Table 42 Europe Architectural and Engineering Services Revenue (USD Million) By Applications (2023-2030)
Table 43 Asia Pacific Architectural and Engineering Services Revenue (USD Million) By Country (2023-2030)
Table 44 Asia Pacific Architectural and Engineering Services Revenue (USD Million) By Type (2023-2030)
Table 45 Asia Pacific Architectural and Engineering Services Revenue (USD Million) By Applications (2023-2030)
Table 46 South America Architectural and Engineering Services Revenue (USD Million) By Country (2023-2030)
Table 47 South America Architectural and Engineering Services Revenue (USD Million) By Type (2023-2030)
Table 48 South America Architectural and Engineering Services Revenue (USD Million) By Applications (2023-2030)
Table 49 Middle East and Africa Architectural and Engineering Services Revenue (USD Million) By Region (2023-2030)
Table 50 Middle East and Africa Architectural and Engineering Services Revenue (USD Million) By Region (2023-2030)
Table 51 Middle East and Africa Architectural and Engineering Services Revenue (USD Million) By Type (2023-2030)
Table 52 Middle East and Africa Architectural and Engineering Services Revenue (USD Million) By Applications (2023-2030)
Table 53 Research Programs/Design for This Report
Table 54 Key Data Information from Secondary Sources
Table 55 Key Data Information from Primary Sources
List of Figures
Figure 1 Market Scope
Figure 2 Porter’s Five Forces
Figure 3 Global Architectural and Engineering Services Revenue (USD Million) By Type (2018-2022)
Figure 4 Global Architectural and Engineering Services Revenue Market Share (%) By Type (2022)
Figure 5 Global Architectural and Engineering Services Revenue (USD Million) By Applications (2018-2022)
Figure 6 Global Architectural and Engineering Services Revenue Market Share (%) By Applications (2022)
Figure 7 Global Architectural and Engineering Services Market Revenue (USD Million) By Regions (2018-2022)
Figure 8 Global Architectural and Engineering Services Market Share (%) By Regions (2022)
Figure 9 North America Architectural and Engineering Services Revenue (USD Million) By Country (2018-2022)
Figure 10 North America Architectural and Engineering Services Revenue (USD Million) By Type (2018-2022)
Figure 11 North America Architectural and Engineering Services Revenue (USD Million) By Applications (2018-2022)
Figure 12 Europe Architectural and Engineering Services Revenue (USD Million) By Country (2018-2022)
Figure 13 Europe Architectural and Engineering Services Revenue (USD Million) By Type (2018-2022)
Figure 14 Europe Architectural and Engineering Services Revenue (USD Million) By Applications (2018-2022)
Figure 15 Asia Pacific Architectural and Engineering Services Revenue (USD Million) By Country (2018-2022)
Figure 16 Asia Pacific Architectural and Engineering Services Revenue (USD Million) By Type (2018-2022)
Figure 17 Asia Pacific Architectural and Engineering Services Revenue (USD Million) By Applications (2018-2022)
Figure 18 South America Architectural and Engineering Services Revenue (USD Million) By Country (2018-2022)
Figure 19 South America Architectural and Engineering Services Revenue (USD Million) By Type (2018-2022)
Figure 20 South America Architectural and Engineering Services Revenue (USD Million) By Applications (2018-2022)
Figure 21 Middle East and Africa Architectural and Engineering Services Revenue (USD Million) By Region (2018-2022)
Figure 22 Middle East and Africa Architectural and Engineering Services Revenue (USD Million) By Type (2018-2022)
Figure 23 Middle East and Africa Architectural and Engineering Services Revenue (USD Million) By Applications (2018-2022)
Figure 24 Global Architectural and Engineering Services Revenue (USD Million) By Type (2023-2030)
Figure 25 Global Architectural and Engineering Services Revenue Market Share (%) By Type (2030)
Figure 26 Global Architectural and Engineering Services Revenue (USD Million) By Applications (2023-2030)
Figure 27 Global Architectural and Engineering Services Revenue Market Share (%) By Applications (2030)
Figure 28 Global Architectural and Engineering Services Market Revenue (USD Million) By Regions (2023-2030)
Figure 29 North America Architectural and Engineering Services Revenue (USD Million) By Country (2023-2030)
Figure 30 North America Architectural and Engineering Services Revenue (USD Million) By Type (2023-2030)
Figure 31 North America Architectural and Engineering Services Revenue (USD Million) By Applications (2023-2030)
Figure 32 Europe Architectural and Engineering Services Revenue (USD Million) By Country (2023-2030)
Figure 33 Europe Architectural and Engineering Services Revenue (USD Million) By Type (2023-2030)
Figure 34 Europe Architectural and Engineering Services Revenue (USD Million) By Applications (2023-2030)
Figure 35 Asia Pacific Architectural and Engineering Services Revenue (USD Million) By Country (2023-2030)
Figure 36 Asia Pacific Architectural and Engineering Services Revenue (USD Million) By Type (2023-2030)
Figure 37 Asia Pacific Architectural and Engineering Services Revenue (USD Million) By Applications (2023-2030)
Figure 38 South America Architectural and Engineering Services Revenue (USD Million) By Country (2023-2030)
Figure 39 South America Architectural and Engineering Services Revenue (USD Million) By Type (2023-2030)
Figure 40 South America Architectural and Engineering Services Revenue (USD Million) By Applications (2023-2030)
Figure 41 Middle East and Africa Architectural and Engineering Services Revenue (USD Million) By Region (2023-2030)
Figure 42 Middle East and Africa Architectural and Engineering Services Revenue (USD Million) By Region (2023-2030)
Figure 43 Middle East and Africa Architectural and Engineering Services Revenue (USD Million) By Type (2023-2030)
Figure 44 Middle East and Africa Architectural and Engineering Services Revenue (USD Million) By Applications (2023-2030)
Figure 45 Bottom-Up and Top-Down Approaches for This Report
Figure 46 Data Triangulation
