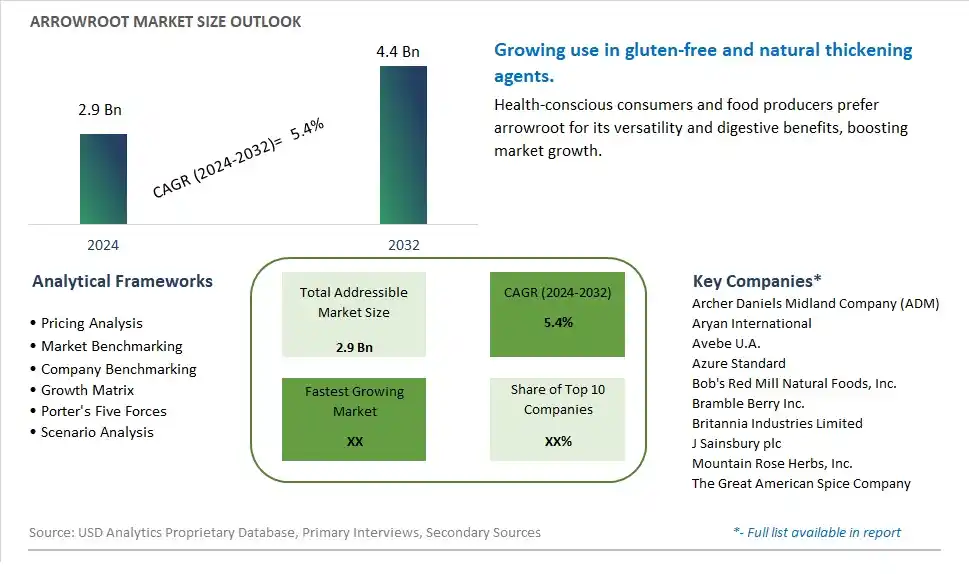
Global Arrowroot Market Size is valued at $2.9 Billion in 2024 and is forecast to register a growth rate (CAGR) of 5.4% to reach $4.4 Billion by 2032.
The global Arrowroot Market Comprehensive Study analyzes and forecasts the market size across 6 regions and 24 countries for diverse segments -By Type (Organic, Conventional), By Application (Food and Beverages, Pharmaceuticals, Nutraceuticals, Others)
An Introduction to Arrowroot Market
The Arrowroot market in 2024 is witnessing robust growth, driven by the increasing demand for gluten-free and natural thickening agents in the food industry. Arrowroot, a starch obtained from the rhizomes of the arrowroot plant, is valued for its neutral taste, ease of digestion, and suitability for gluten-free diets. The market is supported by the growing awareness of food intolerances and the rising popularity of clean-label and minimally processed ingredients. Advances in cultivation and processing technologies are enhancing the quality and application versatility of arrowroot starch. The market is also benefiting from the trend towards home cooking and baking, where arrowroot is used in sauces, soups, and baked goods.
Arrowroot Competitive Landscape
The market report analyses the leading companies in the industry including Archer Daniels Midland Company (ADM), Aryan International, Avebe U.A., Azure Standard, Bob's Red Mill Natural Foods, Inc., Bramble Berry Inc., Britannia Industries Limited, J Sainsbury plc, Mountain Rose Herbs, Inc., The Great American Spice Company, and Others.
Arrowroot Market Dynamics
Arrowroot Market Trend: Increasing Popularity of Gluten-Free and Grain-Free Diets
The Arrowroot market is experiencing a significant trend towards the increasing popularity of gluten-free and grain-free diets. As more consumers adopt these dietary lifestyles due to gluten sensitivities, celiac disease, or general health preferences, arrowroot has gained prominence as a versatile and natural alternative to traditional flours and starches. Its easy digestibility and neutral flavor make it an ideal ingredient for gluten-free baking, thickening sauces, and enhancing the texture of various foods. This trend is driven by the growing demand for clean-label and allergen-free products, positioning arrowroot as a valuable component in health-conscious and specialty food markets.
Arrowroot Market Driver: Rising Consumer Awareness of Health Benefits
A major driver for the Arrowroot market is the rising consumer awareness of its health benefits. Arrowroot is recognized for its high nutritional value, being rich in essential vitamins and minerals while also being easily digestible. It is often used in natural remedies to soothe digestive issues and improve gut health. As consumers become more knowledgeable about functional foods and their impact on health, the demand for nutrient-dense, natural ingredients like arrowroot is increasing. This driver is further supported by the trend towards holistic health and the use of food as medicine, encouraging the incorporation of arrowroot in various dietary applications.
Arrowroot Market Opportunity: Expansion into Functional Foods and Nutraceuticals
Expansion into functional foods and nutraceuticals presents a substantial opportunity for the Arrowroot market. With the growing interest in foods that offer additional health benefits, there is significant potential for developing new products that leverage the unique properties of arrowroot. This includes its use in dietary supplements, health bars, protein shakes, and other functional food products aimed at promoting digestive health and overall wellness. By focusing on innovation and highlighting the health benefits of arrowroot, manufacturers can tap into the expanding market for functional foods and nutraceuticals, driving growth and creating new revenue streams.
Arrowroot Market Share Analysis: Conventional Arrowroot Market segment generated the highest revenue share in the industry
The largest segment in the Arrowroot Market is the Conventional Arrowroot segment. This segment encompasses arrowroot products that are grown and processed using conventional farming methods, without specific certifications or standards related to organic farming practices. The Conventional Arrowroot Market holds a dominant position due to several reasons. Firstly, conventional arrowroot production often benefits from established farming practices and infrastructure, leading to higher yields and more accessible supply chains compared to organic alternatives. This accessibility translates into a wider availability of conventional arrowroot products in various retail outlets and distribution channels. Further, conventional arrowroot may be more competitively priced compared to organic varieties, making it a preferred choice for cost-conscious consumers or businesses in the food industry seeking affordable ingredients. Lastly, while the demand for organic and natural products is growing, conventional arrowroot still holds a significant market share due to its established presence and suitability for various culinary and industrial applications. Thus, the Conventional Arrowroot Market remains the largest segment within the Arrowroot Market, catering to a diverse range of consumers and industries worldwide.
Arrowroot Market Share Analysis: Pharmaceuticals is the fastest growing segment over the forecast period to 2032
The Arrowroot Market in Pharmaceuticals is identified as the fastest-growing segment to 2032. This growth can be attributed to several key factors driving demand within the pharmaceutical industry. Arrowroot, known for its natural and beneficial properties, has gained significant attention as a potential ingredient in pharmaceutical formulations. The pharmaceutical sector is increasingly focusing on incorporating natural and plant-based ingredients into medications and supplements due to their perceived health benefits and minimal side effects. Arrowroot offers various health-promoting properties, including its role as a digestive aid, anti-inflammatory agent, and source of nutrients like potassium and fiber. These attributes make it a desirable ingredient for pharmaceutical companies developing products aimed at digestive health, anti-inflammatory medications, and nutritional supplements. Further, the rising consumer preference for natural and organic alternatives in healthcare further propels the demand for arrowroot-based pharmaceutical products. As a result, the Arrowroot Market in Pharmaceuticals is anticipated to experience rapid growth, driven by the increasing adoption of natural ingredients in the pharmaceutical industry and the expanding market for digestive health and nutritional supplements.
Arrowroot Market Segmentation
By Type
Organic
Conventional
By Application
Food and Beverages
Pharmaceuticals
Nutraceuticals
Others
Countries Analyzed
North America (US, Canada, Mexico)
Europe (Germany, UK, France, Spain, Italy, Russia, Rest of Europe)
Asia Pacific (China, India, Japan, South Korea, Australia, South East Asia, Rest of Asia)
South America (Brazil, Argentina, Rest of South America)
Middle East and Africa (Saudi Arabia, UAE, Rest of Middle East, South Africa, Egypt, Rest of Africa)
Arrowroot Companies Profiled in the Study
Archer Daniels Midland Company (ADM)
Aryan International
Avebe U.A.
Azure Standard
Bob's Red Mill Natural Foods, Inc.
Bramble Berry Inc.
Britannia Industries Limited
J Sainsbury plc
Mountain Rose Herbs, Inc.
The Great American Spice Company
*- List Not Exhaustive
Chapter 1. TABLE OF CONTENTS
Chapter 2. Introduction to Arrowroot Market
2.1. Market Overview
2.2. Key Statistics and Report Highlights
2.3. Scope of the Comprehensive Study
2.3.1. Market Definition
2.3.2 Countries and Regions Covered
2.3.3 Research Objective
2.3.4 Units, Currency, and Conversions
2.3.5 Industry Value Chain
2.4. Key Market Segments
2.5. Key Companies
2.6. Study Period
Chapter 3. Strategic Analysis Review
3.1. Arrowroot Pricing Analysis and Forecast
3.2. Porter’s Five Forces
3.3. Market Ecosystem
3.4. SWOT Analysis
3.5. Regulatory Scenario
3.3. Effects of Inflation, Russia-Ukraine War, moderating economic growth, and other macroeconomic factors
Chapter 4. Competitive Landscape
4.1. Market Share Analysis
4.1.1. Global Arrowroot Market Share by Company, 2023
4.1.2. Product Offerings of Leading Arrowroot Companies
4.2. Market Entropy
4.2.1. New Product Launches in the Industry
4.2.2. Mergers, Acquisitions, Joint ventures, and Partnerships
4.3. Key Strategies and Best Practices
Chapter 5. Global Market Projections: Best, Reference, and Low Case Scenarios
5.1. Growth Analysis- Case Scenario Definitions
5.2. Low Growth Case Scenario Forecasts
5.3. Reference Growth Case Scenario Forecasts
5.4. High Growth Case Scenario Forecasts
Chapter 6. Market Dynamics
6.1. Arrowroot Market Drivers
6.2. Arrowroot Market Challenges
6.6. Arrowroot Market Opportunities
6.4. Arrowroot Market Trends
Chapter 7. Global Arrowroot Market Outlook Trends
7.1. Global Arrowroot Revenue (USD Million) and CAGR (%) by Type (2021-2032)
7.2. Global Arrowroot Revenue (USD Million) and CAGR (%) by Application (2021-2032)
7.3. Global Arrowroot Revenue (USD Million) and CAGR (%) by Product (2021-2032)
By Type
Organic
Conventional
By Application
Food and Beverages
Pharmaceuticals
Nutraceuticals
Others
Chapter 8. Global Arrowroot Regional Analysis and Outlook
8.1. Global Arrowroot Revenue (USD Million) By Regions (2021- 2032)
8.2. North America Arrowroot Revenue (USD Million) by Country (2021-2032)
8.2.1. United States Arrowroot Regional Analysis and Outlook
8.2.2. Canada Arrowroot Regional Analysis and Outlook
8.2.3. Mexico Arrowroot Regional Analysis and Outlook
8.3. Europe Arrowroot Revenue (USD Million), by Country (2021-2032)
8.3.1. Germany Arrowroot Regional Analysis and Outlook
8.3.2. France Arrowroot Regional Analysis and Outlook
8.3.3. United Kingdom Arrowroot Regional Analysis and Outlook
8.3.4. Spain Arrowroot Regional Analysis and Outlook
8.3.5. Italy Arrowroot Regional Analysis and Outlook
8.3.6. Russia Arrowroot Regional Analysis and Outlook
8.3.7. Rest of Europe Arrowroot Regional Analysis and Outlook
8.4. Asia Pacific Arrowroot Revenue (USD Million) by Country (2021-2032)
8.4.1. China Arrowroot Regional Analysis and Outlook
8.4.2. Japan Arrowroot Regional Analysis and Outlook
8.4.3. India Arrowroot Regional Analysis and Outlook
8.4.4. South Korea Arrowroot Regional Analysis and Outlook
8.4.5. Australia Arrowroot Regional Analysis and Outlook
8.4.6. South East Asia Arrowroot Regional Analysis and Outlook
8.4.7. Rest of Asia Pacific Arrowroot Regional Analysis and Outlook
8.5. South America Arrowroot Revenue (USD Million), by Country (2021-2032)
8.5.1. Brazil Arrowroot Regional Analysis and Outlook
8.5.2. Argentina Arrowroot Regional Analysis and Outlook
8.5.3. Rest of South America Arrowroot Regional Analysis and Outlook
8.6. Middle East and Africa Arrowroot Revenue (USD Million) by Country (2021-2032)
8.6.1. Middle East Arrowroot Regional Analysis and Outlook
8.6.2. Africa Arrowroot Regional Analysis and Outlook
Chapter 9. North America Arrowroot Analysis and Outlook
9.1. North America Arrowroot Revenue (USD Million) by Segments (2021-2032)
9.1.1. North America Arrowroot Revenue (USD Million) by Type (2021-2032)
9.1.2. North America Arrowroot Revenue (USD Million) by Application (2021-2032)
9.1.3. North America Arrowroot Revenue (USD Million) by Product (2021-2032)
By Type
Organic
Conventional
By Application
Food and Beverages
Pharmaceuticals
Nutraceuticals
Others
Chapter 10. Europe Arrowroot Analysis and Outlook
10.1. Europe Arrowroot Revenue (USD Million), by Segments (USD Million) (2021-2032)
10.1.1. Europe Arrowroot Revenue (USD Million) by Type (2021-2032)
10.1.2. Europe Arrowroot Revenue (USD Million) by Application (2021-2032)
10.1.3. Europe Arrowroot Revenue (USD Million) by Product (2021-2032)
By Type
Organic
Conventional
By Application
Food and Beverages
Pharmaceuticals
Nutraceuticals
Others
Chapter 11. Asia Pacific Arrowroot Analysis and Outlook
11.1. Asia Pacific Arrowroot Revenue (USD Million), and Revenue (USD Million) by Segments (2021-2032)
11.1.1. Asia Pacific Arrowroot Revenue (USD Million) by Type (2021-2032)
11.1.2. Asia Pacific Arrowroot Revenue (USD Million) by Application (2021-2032)
11.1.3. Asia Pacific Arrowroot Revenue (USD Million) by Product (2021-2032)
By Type
Organic
Conventional
By Application
Food and Beverages
Pharmaceuticals
Nutraceuticals
Others
Chapter 12. South America Arrowroot Analysis and Outlook
12.1. South America Arrowroot Revenue (USD Million), by Segments (2021-2032)
12.1.1. South America Arrowroot Revenue (USD Million) by Type (2021-2032)
12.1.2. South America Arrowroot Revenue (USD Million) by Application (2021-2032)
12.1.3. South America Arrowroot Revenue (USD Million) by Product (2021-2032)
By Type
Organic
Conventional
By Application
Food and Beverages
Pharmaceuticals
Nutraceuticals
Others
Chapter 13. Middle East and Africa Arrowroot Analysis and Outlook
13.1. Middle East and Africa Arrowroot Revenue (USD Million), by Segments (2021-2032)
13.1.1. Middle East and Africa Arrowroot Revenue (USD Million) by Type (2021-2032)
13.1.2. Middle East and Africa Arrowroot Revenue (USD Million) by Application (2021-2032)
13.1.3. Middle East and Africa Arrowroot Revenue (USD Million) by Product (2021-2032)
By Type
Organic
Conventional
By Application
Food and Beverages
Pharmaceuticals
Nutraceuticals
Others
Chapter 14. Arrowroot Company Profiles
14.1 Business Overview
14.2 Product Profiles
14.3 SWOT Profiles
14.5 Recent Developments
14.6 Financial Profile
List of Companies
Archer Daniels Midland Company (ADM)
Aryan International
Avebe U.A.
Azure Standard
Bob's Red Mill Natural Foods, Inc.
Bramble Berry Inc.
Britannia Industries Limited
J Sainsbury plc
Mountain Rose Herbs, Inc.
The Great American Spice Company
15. Methodology and Data Sources
15.1 Customization Offerings
15.2 Subscription Services
15.3 Related Reports
15.4 Publisher Expertise
LIST OF TABLES
Table 1 Market Segmentation Analysis
Table 2 Global Arrowroot Market Share of Leading Companies, 2023
Table 3 Product Offerings of Leading Companies
Table 4 Low Growth Scenario Forecasts
Table 5 Reference Case Growth Scenario
Table 6 High Growth Case Scenario
Table 7 Global Arrowroot Revenue (USD Million) And CAGR (%) By Type (2021-2032)
Table 8 Global Arrowroot Revenue (USD Million) And CAGR (%) By Application (2021-2032)
Table 9 Global Arrowroot Revenue (USD Million) And CAGR (%) By Product (2021-2032)
Table 10 Global Arrowroot Market Revenue (USD Million) By Regions (2021-2032)
Table 11 Global Arrowroot Market Share (%) By Regions (2021-2032)
Table 12 North America Arrowroot Revenue (USD Million) By Country (2021-2032)
Table 13 Europe Arrowroot Revenue (USD Million) By Country (2021-2032)
Table 14 Asia Pacific Arrowroot Revenue (USD Million) By Country (2021-2032)
Table 15 South America Arrowroot Revenue (USD Million) By Country (2021-2032)
Table 16 Middle East and Africa Arrowroot Revenue (USD Million) By Region (2021-2032)
Table 17 North America Arrowroot Revenue (USD Million) By Type (2021-2032)
Table 18 North America Arrowroot Revenue (USD Million) By Application (2021-2032)
Table 19 North America Arrowroot Revenue (USD Million) By Product (2021-2032)
Table 20 Europe Arrowroot Revenue (USD Million) By Type (2021-2032)
Table 21 Europe Arrowroot Revenue (USD Million) By Application (2021-2032)
Table 22 Europe Arrowroot Revenue (USD Million) By Product (2021-2032)
Table 23 Asia Pacific Arrowroot Revenue (USD Million) By Type (2021-2032)
Table 24 Asia Pacific Arrowroot Revenue (USD Million) By Application (2021-2032)
Table 25 Asia Pacific Arrowroot Revenue (USD Million) By Product (2021-2032)
Table 26 South America Arrowroot Revenue (USD Million) By Type (2021-2032)
Table 27 South America Arrowroot Revenue (USD Million) By Application (2021-2032)
Table 28 South America Arrowroot Revenue (USD Million) By Product (2021-2032)
Table 29 Middle East and Africa Arrowroot Revenue (USD Million) By Type (2021-2032)
Table 30 Middle East and Africa Arrowroot Revenue (USD Million) By Application (2021-2032)
Table 31 Middle East and Africa Arrowroot Revenue (USD Million) By Product (2021-2032)
LIST OF FIGURES
Figure 1. Market Scope
Figure 2. Pricing Forecasts Per Unit, 2023- 2032
Figure 3. Porter’s Five Forces
Figure 4. Global Arrowroot Market Revenue (USD Million) By Regions (2021-2032)
Figure 5. Global Arrowroot Market Share (%) By Regions (2023)
Figure 6. North America Arrowroot Revenue (USD Million) By Country (2021-2032)
Figure 7. United States Arrowroot Revenue (USD Million) By Country (2021-2032)
Figure 8. Canada Arrowroot Revenue (USD Million) By Country (2021-2032)
Figure 9. Mexico Arrowroot Revenue (USD Million) By Country (2021-2032)
Figure 10. Europe Arrowroot Revenue (USD Million) By Country (2021-2032)
Figure 11. Germany Arrowroot Revenue (USD Million) By Country (2021-2032)
Figure 12. France Arrowroot Revenue (USD Million) By Country (2021-2032)
Figure 13. United Kingdom Arrowroot Revenue (USD Million) By Country (2021-2032)
Figure 14. Spain Arrowroot Revenue (USD Million) By Country (2021-2032)
Figure 15. Italy Arrowroot Revenue (USD Million) By Country (2021-2032)
Figure 16. Russia Arrowroot Revenue (USD Million) By Country (2021-2032)
Figure 17. Rest of Europe Arrowroot Revenue (USD Million) By Country (2021-2032)
Figure 11. Asia Pacific Arrowroot Revenue (USD Million) By Country (2021-2032)
Figure 12. China Arrowroot Revenue (USD Million) By Country (2021-2032)
Figure 13. Japan Arrowroot Revenue (USD Million) By Country (2021-2032)
Figure 14. India Arrowroot Revenue (USD Million) By Country (2021-2032)
Figure 15. South Korea Arrowroot Revenue (USD Million) By Country (2021-2032)
Figure 16. Australia Arrowroot Revenue (USD Million) By Country (2021-2032)
Figure 17. South East Asia Arrowroot Revenue (USD Million) By Country (2021-2032)
Figure 18. South America Arrowroot Revenue (USD Million) By Country (2021-2032)
Figure 19. Brazil Arrowroot Revenue (USD Million) By Country (2021-2032)
Figure 20. Argentina Arrowroot Revenue (USD Million) By Country (2021-2032)
Figure 21. Rest of Asia Pacific Arrowroot Revenue (USD Million) By Country (2021-2032)
Figure 22. Middle East and Africa Arrowroot Revenue (USD Million) By Region (2021-2032)
Figure 23. Saudi Arabia Arrowroot Revenue (USD Million) By Region (2021-2032)
Figure 24. The UAE Arrowroot Revenue (USD Million) By Region (2021-2032)
Figure 25. Rest of Middle East Arrowroot Revenue (USD Million) By Region (2021-2032)
Figure 26. South Africa Arrowroot Revenue (USD Million) By Region (2021-2032)
Figure 27. Africa Arrowroot Revenue (USD Million) By Region (2021-2032)
Figure 28. North America Arrowroot Revenue (USD Million) By Type (2021-2032)
Figure 29. North America Arrowroot Revenue (USD Million) By Application (2021-2032)
Figure 30. North America Arrowroot Revenue (USD Million) By Product (2021-2032)
Figure 31. Europe Arrowroot Revenue (USD Million) By Type (2021-2032)
Figure 32. Europe Arrowroot Revenue (USD Million) By Application (2021-2032)
Figure 33. Europe Arrowroot Revenue (USD Million) By Product (2021-2032)
Figure 34. Asia Pacific Arrowroot Revenue (USD Million) By Type (2021-2032)
Figure 35. Asia Pacific Arrowroot Revenue (USD Million) By Application (2021-2032)
Figure 36. Asia Pacific Arrowroot Revenue (USD Million) By Product (2021-2032)
Figure 37. South America Arrowroot Revenue (USD Million) By Type (2021-2032)
Figure 38. South America Arrowroot Revenue (USD Million) By Application (2021-2032)
Figure 39. South America Arrowroot Revenue (USD Million) By Product (2021-2032)
Figure 40. Middle East and Africa Arrowroot Revenue (USD Million) By Type (2021-2032)
Figure 41. Middle East and Africa Arrowroot Revenue (USD Million) By Application (2021-2032)
Figure 42. Middle East and Africa Arrowroot Revenue (USD Million) By Product (2021-2032)
By Type
Organic
Conventional
By Application
Food and Beverages
Pharmaceuticals
Nutraceuticals
Others
Countries Analyzed
North America (US, Canada, Mexico)
Europe (Germany, UK, France, Spain, Italy, Russia, Rest of Europe)
Asia Pacific (China, India, Japan, South Korea, Australia, South East Asia, Rest of Asia)
South America (Brazil, Argentina, Rest of South America)
Middle East and Africa (Saudi Arabia, UAE, Rest of Middle East, South Africa, Egypt, Rest of Africa)
