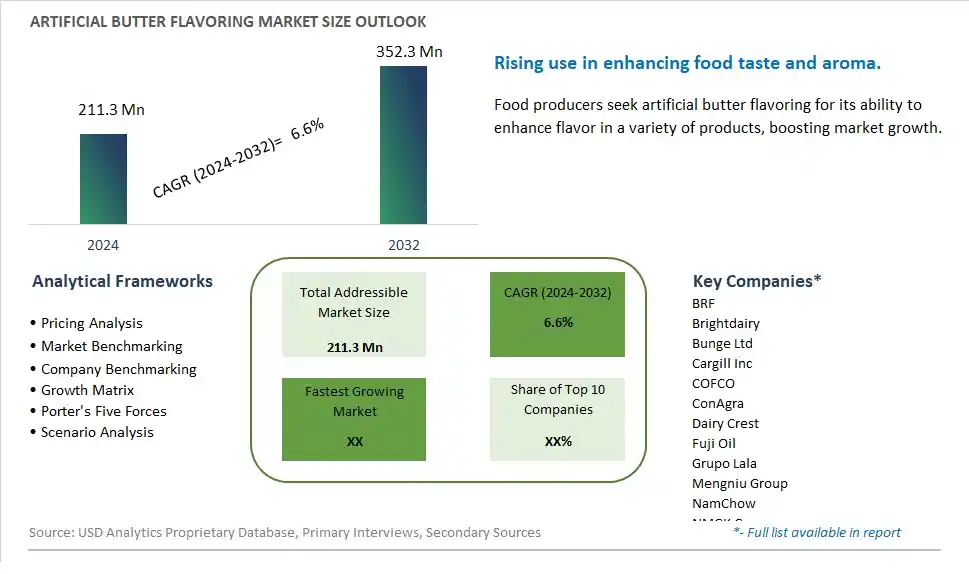
Global Artificial Butter Flavoring Market Size is valued at $211.3 Million in 2024 and is forecast to register a growth rate (CAGR) of 6.6% to reach $352.3 Million by 2032.
The global Artificial Butter Flavoring Market Comprehensive Study analyzes and forecasts the market size across 6 regions and 24 countries for diverse segments -By Type (Special, Universal), By Application (Food, Household, Business)
An Introduction to Artificial Butter Flavoring Market
The Artificial Butter Flavoring market in 2024 is growing steadily, driven by its widespread use in the food industry to enhance the taste of various products. Artificial butter flavoring is valued for its ability to provide a rich, buttery taste without the use of actual butter, making it a cost-effective and versatile ingredient. The market is supported by the increasing demand for flavored snacks, baked goods, and convenience foods. Advances in flavor formulation and delivery systems are improving the authenticity and stability of artificial butter flavoring. The market is also benefiting from the trend towards vegan and lactose-free products, where artificial flavors play a crucial role in replicating traditional tastes.
Artificial Butter Flavoring Competitive Landscape
The market report analyses the leading companies in the industry including BRF, Brightdairy, Bunge Ltd, Cargill Inc, COFCO, ConAgra, Dairy Crest, Fuji Oil, Grupo Lala, Mengniu Group, NamChow, NMGK Group, Sunnyfoods, Unilever, Uni-President, Wilmar International Ltd, Yildiz Holding, Yili Group, Zydus Cadila, and Others.
Artificial Butter Flavoring Market Dynamics
Artificial Butter Flavoring Market Trend: Shift Towards Healthier Alternatives
The prominent market trend for Artificial Butter Flavoring is the ongoing shift towards healthier alternatives in the food industry. With consumers becoming more health-conscious and seeking products with cleaner labels and fewer artificial ingredients, there's a growing demand for natural and healthier butter flavoring options. This trend is driven by concerns about the health implications of artificial additives and a preference for ingredients that are perceived as more natural and wholesome.
Artificial Butter Flavoring Market Driver: Consumer Preference for Authentic Flavors
A key market driver for Artificial Butter Flavoring is the consumer preference for authentic flavors in food products. While there is a growing demand for healthier alternatives, consumers still value the taste and aroma of butter in various food items such as popcorn, baked goods, and sauces. Artificial butter flavorings provide a convenient way for manufacturers to replicate the rich, buttery taste without using actual butter, meeting consumer expectations for flavor authenticity while also addressing dietary preferences and restrictions.
Artificial Butter Flavoring Market Opportunity: Innovating with Clean Label Solutions
An opportunity within the Artificial Butter Flavoring market lies in innovating with clean label solutions. As consumers continue to prioritize natural and clean label products, there is an opportunity for manufacturers to develop artificial butter flavorings using natural and recognizable ingredients. This includes utilizing ingredients such as natural flavors, plant-based fats, and clean-label emulsifiers to create buttery flavors that align with consumer preferences for clean and transparent ingredient lists. By tapping into this opportunity, manufacturers can cater to the growing demand for healthier and more authentic butter flavorings while also differentiating their products in the market.
Artificial Butter Flavoring Market Share Analysis: Universal Type segment generated the highest revenue share in the industry
The largest segment in the Artificial Butter Flavoring Market is the Universal type. Universal artificial butter flavorings are versatile and widely used across various food and beverage applications. They are designed to mimic the taste and aroma of real butter, making them a popular choice among manufacturers looking to enhance the flavor profile of their products. Universal artificial butter flavorings are used in a wide range of food items, including snacks, baked goods, sauces, dressings, and confectionery products. Their ability to provide a rich and creamy buttery taste without the need for actual butter makes them highly sought after in the food industry. Additionally, universal artificial butter flavorings are often preferred for their cost-effectiveness and ease of incorporation into different food formulations. As a result of their widespread application and consumer appeal, the Universal type dominates the Artificial Butter Flavoring Market as the largest segment.
Artificial Butter Flavoring Market Share Analysis: Food Application is the fastest growing segment over the forecast period to 2032
The fastest-growing segment in the Artificial Butter Flavoring Market is the Food Application segment. This growth is primarily driven by the increasing demand for processed food products that require artificial butter flavorings to enhance their taste profiles. Food manufacturers are constantly innovating to meet consumer preferences for rich and savory flavors, especially in snacks, baked goods, ready-to-eat meals, and convenience foods. The use of artificial butter flavorings in these food categories not only imparts a delicious buttery taste but also helps in achieving consistency in flavor across batches. Additionally, the growing popularity of plant-based and vegan food products has further boosted the demand for artificial butter flavorings as they provide an alternative to animal-derived butter flavors. With advancements in food technology and flavor formulation, the Food Application segment of the Artificial Butter Flavoring Market is expected to experience rapid growth and significant market expansion by 2032.
Artificial Butter Flavoring Market Segmentation
By Type
Special
Universal
By Application
Food
Household
Business
Countries Analyzed
North America (US, Canada, Mexico)
Europe (Germany, UK, France, Spain, Italy, Russia, Rest of Europe)
Asia Pacific (China, India, Japan, South Korea, Australia, South East Asia, Rest of Asia)
South America (Brazil, Argentina, Rest of South America)
Middle East and Africa (Saudi Arabia, UAE, Rest of Middle East, South Africa, Egypt, Rest of Africa)
Artificial Butter Flavoring Companies Profiled in the Study
BRF
Brightdairy
Bunge Ltd
Cargill Inc
COFCO
ConAgra
Dairy Crest
Fuji Oil
Grupo Lala
Mengniu Group
NamChow
NMGK Group
Sunnyfoods
Unilever
Uni-President
Wilmar International Ltd
Yildiz Holding
Yili Group
Zydus Cadila
*- List Not Exhaustive
Chapter 1. TABLE OF CONTENTS
Chapter 2. Introduction to Artificial Butter Flavoring Market
2.1. Market Overview
2.2. Key Statistics and Report Highlights
2.3. Scope of the Comprehensive Study
2.3.1. Market Definition
2.3.2 Countries and Regions Covered
2.3.3 Research Objective
2.3.4 Units, Currency, and Conversions
2.3.5 Industry Value Chain
2.4. Key Market Segments
2.5. Key Companies
2.6. Study Period
Chapter 3. Strategic Analysis Review
3.1. Artificial Butter Flavoring Pricing Analysis and Forecast
3.2. Porter’s Five Forces
3.3. Market Ecosystem
3.4. SWOT Analysis
3.5. Regulatory Scenario
3.3. Effects of Inflation, Russia-Ukraine War, moderating economic growth, and other macroeconomic factors
Chapter 4. Competitive Landscape
4.1. Market Share Analysis
4.1.1. Global Artificial Butter Flavoring Market Share by Company, 2023
4.1.2. Product Offerings of Leading Artificial Butter Flavoring Companies
4.2. Market Entropy
4.2.1. New Product Launches in the Industry
4.2.2. Mergers, Acquisitions, Joint ventures, and Partnerships
4.3. Key Strategies and Best Practices
Chapter 5. Global Market Projections: Best, Reference, and Low Case Scenarios
5.1. Growth Analysis- Case Scenario Definitions
5.2. Low Growth Case Scenario Forecasts
5.3. Reference Growth Case Scenario Forecasts
5.4. High Growth Case Scenario Forecasts
Chapter 6. Market Dynamics
6.1. Artificial Butter Flavoring Market Drivers
6.2. Artificial Butter Flavoring Market Challenges
6.6. Artificial Butter Flavoring Market Opportunities
6.4. Artificial Butter Flavoring Market Trends
Chapter 7. Global Artificial Butter Flavoring Market Outlook Trends
7.1. Global Artificial Butter Flavoring Revenue (USD Million) and CAGR (%) by Type (2021-2032)
7.2. Global Artificial Butter Flavoring Revenue (USD Million) and CAGR (%) by Application (2021-2032)
7.3. Global Artificial Butter Flavoring Revenue (USD Million) and CAGR (%) by Product (2021-2032)
By Type
Special
Universal
By Application
Food
Household
Business
Chapter 8. Global Artificial Butter Flavoring Regional Analysis and Outlook
8.1. Global Artificial Butter Flavoring Revenue (USD Million) By Regions (2021- 2032)
8.2. North America Artificial Butter Flavoring Revenue (USD Million) by Country (2021-2032)
8.2.1. United States Artificial Butter Flavoring Regional Analysis and Outlook
8.2.2. Canada Artificial Butter Flavoring Regional Analysis and Outlook
8.2.3. Mexico Artificial Butter Flavoring Regional Analysis and Outlook
8.3. Europe Artificial Butter Flavoring Revenue (USD Million), by Country (2021-2032)
8.3.1. Germany Artificial Butter Flavoring Regional Analysis and Outlook
8.3.2. France Artificial Butter Flavoring Regional Analysis and Outlook
8.3.3. United Kingdom Artificial Butter Flavoring Regional Analysis and Outlook
8.3.4. Spain Artificial Butter Flavoring Regional Analysis and Outlook
8.3.5. Italy Artificial Butter Flavoring Regional Analysis and Outlook
8.3.6. Russia Artificial Butter Flavoring Regional Analysis and Outlook
8.3.7. Rest of Europe Artificial Butter Flavoring Regional Analysis and Outlook
8.4. Asia Pacific Artificial Butter Flavoring Revenue (USD Million) by Country (2021-2032)
8.4.1. China Artificial Butter Flavoring Regional Analysis and Outlook
8.4.2. Japan Artificial Butter Flavoring Regional Analysis and Outlook
8.4.3. India Artificial Butter Flavoring Regional Analysis and Outlook
8.4.4. South Korea Artificial Butter Flavoring Regional Analysis and Outlook
8.4.5. Australia Artificial Butter Flavoring Regional Analysis and Outlook
8.4.6. South East Asia Artificial Butter Flavoring Regional Analysis and Outlook
8.4.7. Rest of Asia Pacific Artificial Butter Flavoring Regional Analysis and Outlook
8.5. South America Artificial Butter Flavoring Revenue (USD Million), by Country (2021-2032)
8.5.1. Brazil Artificial Butter Flavoring Regional Analysis and Outlook
8.5.2. Argentina Artificial Butter Flavoring Regional Analysis and Outlook
8.5.3. Rest of South America Artificial Butter Flavoring Regional Analysis and Outlook
8.6. Middle East and Africa Artificial Butter Flavoring Revenue (USD Million) by Country (2021-2032)
8.6.1. Middle East Artificial Butter Flavoring Regional Analysis and Outlook
8.6.2. Africa Artificial Butter Flavoring Regional Analysis and Outlook
Chapter 9. North America Artificial Butter Flavoring Analysis and Outlook
9.1. North America Artificial Butter Flavoring Revenue (USD Million) by Segments (2021-2032)
9.1.1. North America Artificial Butter Flavoring Revenue (USD Million) by Type (2021-2032)
9.1.2. North America Artificial Butter Flavoring Revenue (USD Million) by Application (2021-2032)
9.1.3. North America Artificial Butter Flavoring Revenue (USD Million) by Product (2021-2032)
By Type
Special
Universal
By Application
Food
Household
Business
Chapter 10. Europe Artificial Butter Flavoring Analysis and Outlook
10.1. Europe Artificial Butter Flavoring Revenue (USD Million), by Segments (USD Million) (2021-2032)
10.1.1. Europe Artificial Butter Flavoring Revenue (USD Million) by Type (2021-2032)
10.1.2. Europe Artificial Butter Flavoring Revenue (USD Million) by Application (2021-2032)
10.1.3. Europe Artificial Butter Flavoring Revenue (USD Million) by Product (2021-2032)
By Type
Special
Universal
By Application
Food
Household
Business
Chapter 11. Asia Pacific Artificial Butter Flavoring Analysis and Outlook
11.1. Asia Pacific Artificial Butter Flavoring Revenue (USD Million), and Revenue (USD Million) by Segments (2021-2032)
11.1.1. Asia Pacific Artificial Butter Flavoring Revenue (USD Million) by Type (2021-2032)
11.1.2. Asia Pacific Artificial Butter Flavoring Revenue (USD Million) by Application (2021-2032)
11.1.3. Asia Pacific Artificial Butter Flavoring Revenue (USD Million) by Product (2021-2032)
By Type
Special
Universal
By Application
Food
Household
Business
Chapter 12. South America Artificial Butter Flavoring Analysis and Outlook
12.1. South America Artificial Butter Flavoring Revenue (USD Million), by Segments (2021-2032)
12.1.1. South America Artificial Butter Flavoring Revenue (USD Million) by Type (2021-2032)
12.1.2. South America Artificial Butter Flavoring Revenue (USD Million) by Application (2021-2032)
12.1.3. South America Artificial Butter Flavoring Revenue (USD Million) by Product (2021-2032)
By Type
Special
Universal
By Application
Food
Household
Business
Chapter 13. Middle East and Africa Artificial Butter Flavoring Analysis and Outlook
13.1. Middle East and Africa Artificial Butter Flavoring Revenue (USD Million), by Segments (2021-2032)
13.1.1. Middle East and Africa Artificial Butter Flavoring Revenue (USD Million) by Type (2021-2032)
13.1.2. Middle East and Africa Artificial Butter Flavoring Revenue (USD Million) by Application (2021-2032)
13.1.3. Middle East and Africa Artificial Butter Flavoring Revenue (USD Million) by Product (2021-2032)
By Type
Special
Universal
By Application
Food
Household
Business
Chapter 14. Artificial Butter Flavoring Company Profiles
14.1 Business Overview
14.2 Product Profiles
14.3 SWOT Profiles
14.5 Recent Developments
14.6 Financial Profile
List of Companies
BRF
Brightdairy
Bunge Ltd
Cargill Inc
COFCO
ConAgra
Dairy Crest
Fuji Oil
Grupo Lala
Mengniu Group
NamChow
NMGK Group
Sunnyfoods
Unilever
Uni-President
Wilmar International Ltd
Yildiz Holding
Yili Group
Zydus Cadila
15. Methodology and Data Sources
15.1 Customization Offerings
15.2 Subscription Services
15.3 Related Reports
15.4 Publisher Expertise
LIST OF TABLES
Table 1 Market Segmentation Analysis
Table 2 Global Artificial Butter Flavoring Market Share of Leading Companies, 2023
Table 3 Product Offerings of Leading Companies
Table 4 Low Growth Scenario Forecasts
Table 5 Reference Case Growth Scenario
Table 6 High Growth Case Scenario
Table 7 Global Artificial Butter Flavoring Revenue (USD Million) And CAGR (%) By Type (2021-2032)
Table 8 Global Artificial Butter Flavoring Revenue (USD Million) And CAGR (%) By Application (2021-2032)
Table 9 Global Artificial Butter Flavoring Revenue (USD Million) And CAGR (%) By Product (2021-2032)
Table 10 Global Artificial Butter Flavoring Market Revenue (USD Million) By Regions (2021-2032)
Table 11 Global Artificial Butter Flavoring Market Share (%) By Regions (2021-2032)
Table 12 North America Artificial Butter Flavoring Revenue (USD Million) By Country (2021-2032)
Table 13 Europe Artificial Butter Flavoring Revenue (USD Million) By Country (2021-2032)
Table 14 Asia Pacific Artificial Butter Flavoring Revenue (USD Million) By Country (2021-2032)
Table 15 South America Artificial Butter Flavoring Revenue (USD Million) By Country (2021-2032)
Table 16 Middle East and Africa Artificial Butter Flavoring Revenue (USD Million) By Region (2021-2032)
Table 17 North America Artificial Butter Flavoring Revenue (USD Million) By Type (2021-2032)
Table 18 North America Artificial Butter Flavoring Revenue (USD Million) By Application (2021-2032)
Table 19 North America Artificial Butter Flavoring Revenue (USD Million) By Product (2021-2032)
Table 20 Europe Artificial Butter Flavoring Revenue (USD Million) By Type (2021-2032)
Table 21 Europe Artificial Butter Flavoring Revenue (USD Million) By Application (2021-2032)
Table 22 Europe Artificial Butter Flavoring Revenue (USD Million) By Product (2021-2032)
Table 23 Asia Pacific Artificial Butter Flavoring Revenue (USD Million) By Type (2021-2032)
Table 24 Asia Pacific Artificial Butter Flavoring Revenue (USD Million) By Application (2021-2032)
Table 25 Asia Pacific Artificial Butter Flavoring Revenue (USD Million) By Product (2021-2032)
Table 26 South America Artificial Butter Flavoring Revenue (USD Million) By Type (2021-2032)
Table 27 South America Artificial Butter Flavoring Revenue (USD Million) By Application (2021-2032)
Table 28 South America Artificial Butter Flavoring Revenue (USD Million) By Product (2021-2032)
Table 29 Middle East and Africa Artificial Butter Flavoring Revenue (USD Million) By Type (2021-2032)
Table 30 Middle East and Africa Artificial Butter Flavoring Revenue (USD Million) By Application (2021-2032)
Table 31 Middle East and Africa Artificial Butter Flavoring Revenue (USD Million) By Product (2021-2032)
LIST OF FIGURES
Figure 1. Market Scope
Figure 2. Pricing Forecasts Per Unit, 2023- 2032
Figure 3. Porter’s Five Forces
Figure 4. Global Artificial Butter Flavoring Market Revenue (USD Million) By Regions (2021-2032)
Figure 5. Global Artificial Butter Flavoring Market Share (%) By Regions (2023)
Figure 6. North America Artificial Butter Flavoring Revenue (USD Million) By Country (2021-2032)
Figure 7. United States Artificial Butter Flavoring Revenue (USD Million) By Country (2021-2032)
Figure 8. Canada Artificial Butter Flavoring Revenue (USD Million) By Country (2021-2032)
Figure 9. Mexico Artificial Butter Flavoring Revenue (USD Million) By Country (2021-2032)
Figure 10. Europe Artificial Butter Flavoring Revenue (USD Million) By Country (2021-2032)
Figure 11. Germany Artificial Butter Flavoring Revenue (USD Million) By Country (2021-2032)
Figure 12. France Artificial Butter Flavoring Revenue (USD Million) By Country (2021-2032)
Figure 13. United Kingdom Artificial Butter Flavoring Revenue (USD Million) By Country (2021-2032)
Figure 14. Spain Artificial Butter Flavoring Revenue (USD Million) By Country (2021-2032)
Figure 15. Italy Artificial Butter Flavoring Revenue (USD Million) By Country (2021-2032)
Figure 16. Russia Artificial Butter Flavoring Revenue (USD Million) By Country (2021-2032)
Figure 17. Rest of Europe Artificial Butter Flavoring Revenue (USD Million) By Country (2021-2032)
Figure 11. Asia Pacific Artificial Butter Flavoring Revenue (USD Million) By Country (2021-2032)
Figure 12. China Artificial Butter Flavoring Revenue (USD Million) By Country (2021-2032)
Figure 13. Japan Artificial Butter Flavoring Revenue (USD Million) By Country (2021-2032)
Figure 14. India Artificial Butter Flavoring Revenue (USD Million) By Country (2021-2032)
Figure 15. South Korea Artificial Butter Flavoring Revenue (USD Million) By Country (2021-2032)
Figure 16. Australia Artificial Butter Flavoring Revenue (USD Million) By Country (2021-2032)
Figure 17. South East Asia Artificial Butter Flavoring Revenue (USD Million) By Country (2021-2032)
Figure 18. South America Artificial Butter Flavoring Revenue (USD Million) By Country (2021-2032)
Figure 19. Brazil Artificial Butter Flavoring Revenue (USD Million) By Country (2021-2032)
Figure 20. Argentina Artificial Butter Flavoring Revenue (USD Million) By Country (2021-2032)
Figure 21. Rest of Asia Pacific Artificial Butter Flavoring Revenue (USD Million) By Country (2021-2032)
Figure 22. Middle East and Africa Artificial Butter Flavoring Revenue (USD Million) By Region (2021-2032)
Figure 23. Saudi Arabia Artificial Butter Flavoring Revenue (USD Million) By Region (2021-2032)
Figure 24. The UAE Artificial Butter Flavoring Revenue (USD Million) By Region (2021-2032)
Figure 25. Rest of Middle East Artificial Butter Flavoring Revenue (USD Million) By Region (2021-2032)
Figure 26. South Africa Artificial Butter Flavoring Revenue (USD Million) By Region (2021-2032)
Figure 27. Africa Artificial Butter Flavoring Revenue (USD Million) By Region (2021-2032)
Figure 28. North America Artificial Butter Flavoring Revenue (USD Million) By Type (2021-2032)
Figure 29. North America Artificial Butter Flavoring Revenue (USD Million) By Application (2021-2032)
Figure 30. North America Artificial Butter Flavoring Revenue (USD Million) By Product (2021-2032)
Figure 31. Europe Artificial Butter Flavoring Revenue (USD Million) By Type (2021-2032)
Figure 32. Europe Artificial Butter Flavoring Revenue (USD Million) By Application (2021-2032)
Figure 33. Europe Artificial Butter Flavoring Revenue (USD Million) By Product (2021-2032)
Figure 34. Asia Pacific Artificial Butter Flavoring Revenue (USD Million) By Type (2021-2032)
Figure 35. Asia Pacific Artificial Butter Flavoring Revenue (USD Million) By Application (2021-2032)
Figure 36. Asia Pacific Artificial Butter Flavoring Revenue (USD Million) By Product (2021-2032)
Figure 37. South America Artificial Butter Flavoring Revenue (USD Million) By Type (2021-2032)
Figure 38. South America Artificial Butter Flavoring Revenue (USD Million) By Application (2021-2032)
Figure 39. South America Artificial Butter Flavoring Revenue (USD Million) By Product (2021-2032)
Figure 40. Middle East and Africa Artificial Butter Flavoring Revenue (USD Million) By Type (2021-2032)
Figure 41. Middle East and Africa Artificial Butter Flavoring Revenue (USD Million) By Application (2021-2032)
Figure 42. Middle East and Africa Artificial Butter Flavoring Revenue (USD Million) By Product (2021-2032)
By Type
Special
Universal
By Application
Food
Household
Business
Countries Analyzed
North America (US, Canada, Mexico)
Europe (Germany, UK, France, Spain, Italy, Russia, Rest of Europe)
Asia Pacific (China, India, Japan, South Korea, Australia, South East Asia, Rest of Asia)
South America (Brazil, Argentina, Rest of South America)
Middle East and Africa (Saudi Arabia, UAE, Rest of Middle East, South Africa, Egypt, Rest of Africa)
