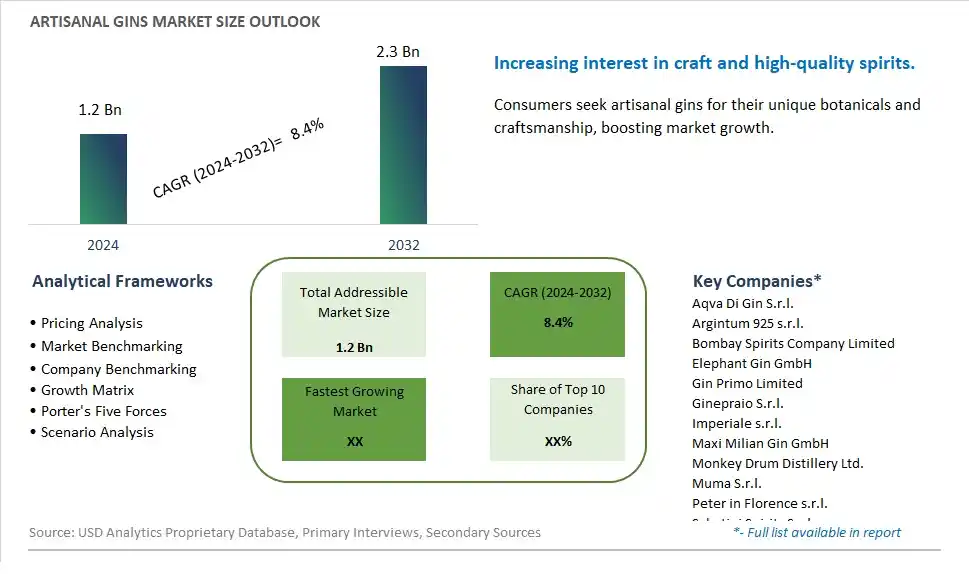
Global Artisanal Gins Market Size is valued at $1.2 Billion in 2024 and is forecast to register a growth rate (CAGR) of 8.4% to reach $2.3 Billion by 2032.
The global Artisanal Gins Market Comprehensive Study analyzes and forecasts the market size across 6 regions and 24 countries for diverse segments -By Alcohol (Up to 45%, Above 45%), By Sales Channel (Online, Offline)
An Introduction to Artisanal Gins Market
The Artisanal Gins market in 2024 is expanding rapidly, fueled by the rising popularity of craft spirits and the gin renaissance. Artisanal gins, produced in small batches with unique botanical blends, are highly sought after for their distinctive flavors and premium quality. The market is supported by the increasing consumer interest in innovative and locally sourced spirits. Innovations in distillation techniques and botanical experimentation are driving the development of new and exciting gin profiles. The market is also benefiting from the growing cocktail culture and the demand for bespoke and high-end drinking experiences, where artisanal gins play a central role.
Artisanal Gins Competitive Landscape
The market report analyses the leading companies in the industry including Aqva Di Gin S.r.l., Argintum 925 s.r.l., Bombay Spirits Company Limited, Elephant Gin GmbH, Gin Primo Limited, Ginepraio S.r.l., Imperiale s.r.l., Maxi Milian Gin GmbH, Monkey Drum Distillery Ltd., Muma S.r.l., Peter in Florence s.r.l., Sabatini Spirits S.r.l., Selvatiq Spirits Ltd., Torino Distillati S.r.l. (Malfy Gin), and Others.
Artisanal Gins Market Dynamics
Artisanal Gins Market Trend: Surge in Craft Spirits and Artisanal Beverages
The most prominent market trend for Artisanal Gins is the surge in craft spirits and artisanal beverages. Consumers are increasingly drawn to unique, handcrafted products that offer distinctive flavors and a personalized drinking experience. Artisanal gins, with their focus on small-batch production, premium ingredients, and innovative botanical blends, align perfectly with this trend. The growing appreciation for quality spirits and the desire for authentic, artisanal offerings contribute to the rising popularity of artisanal gins among discerning consumers and mixologists.
Artisanal Gins Market Driver: Flavor Innovation and Mixology Culture
A key market driver for Artisanal Gins is flavor innovation and the thriving mixology culture. As consumers seek new and exciting flavor profiles in their cocktails and beverages, artisanal gins provide a canvas for experimentation and creativity. Distillers and mixologists are pushing boundaries by infusing gins with botanicals, herbs, spices, and unconventional ingredients to craft unique and memorable flavor experiences. The growing trend of home bartending and cocktail enthusiasts further drives the demand for artisanal gins, creating opportunities for producers to showcase their craftsmanship and creativity.
Artisanal Gins Market Opportunity: Premiumization and Global Expansion
A potential opportunity within the Artisanal Gins market lies in premiumization and global expansion. With consumers willing to pay a premium for high-quality and artisanal spirits, there's an opportunity for artisanal gin producers to position their products as luxury offerings targeted at affluent consumers and enthusiasts seeking exclusivity. Additionally, tapping into international markets and exploring export opportunities can broaden the reach of artisanal gins, introducing them to new audiences and expanding market share. Collaborations with local distillers, strategic marketing initiatives, and participation in industry events can further enhance visibility and create a niche for artisanal gins in the global spirits market.
Artisanal Gins Market Share Analysis: Up to 45% Alcohol segment generated the highest revenue share in the industry
The largest segment in the Artisanal Gins Market is those gins with an alcohol content of up to 45%. This segment dominates the market due to several key factors. Firstly, gins with lower alcohol content are generally more accessible to a wider consumer base, including those who prefer milder alcoholic beverages or are new to gin consumption. This broader appeal contributes significantly to the popularity and market share of this segment. Additionally, many consumers appreciate the versatility of lower-alcohol gins, as they can be enjoyed neat, mixed in cocktails, or used as a base for various drinks and infusions. The growing trend towards mindful drinking and the demand for lighter alcoholic options further boost the consumption of gins with up to 45% alcohol content. Further, artisanal gins in this category often highlight unique botanical blends and flavor profiles, attracting enthusiasts looking for distinct and premium offerings. As a result, the Up to 45% Alcohol segment stands out as the largest and most influential segment within the Artisanal Gins Market.
Artisanal Gins Market Share Analysis: Online Sales is the fastest growing segment over the forecast period to 2032
The fastest-growing segment in the Artisanal Gins Market is Online Sales. This growth can be attributed to several key factors driving the shift towards online purchasing of artisanal gins. Firstly, the convenience and accessibility offered by online platforms have made it easier for consumers to explore and purchase a wide variety of artisanal gins from the comfort of their homes. This convenience factor is especially appealing to busy consumers who may not have the time to visit physical stores. Additionally, online platforms provide a wealth of information about different gins, including detailed descriptions, customer reviews, and recommendations, empowering consumers to make informed purchasing decisions. The global reach of online sales also allows artisanal gin producers to tap into new markets and reach a diverse customer base beyond their geographical locations. Furthermore, the rise of e-commerce and digital marketing strategies has led to increased visibility and promotion of artisanal gins, attracting a growing number of enthusiasts and connoisseurs to explore and purchase these unique spirits online. As a result, the Online Sales segment is experiencing rapid growth and is poised to continue expanding significantly in the Artisanal Gins Market up to 2032.
Artisanal Gins Market Segmentation
By Alcohol
Up to 45%
Above 45%
By Sales Channel
Online
Offline
Countries Analyzed
North America (US, Canada, Mexico)
Europe (Germany, UK, France, Spain, Italy, Russia, Rest of Europe)
Asia Pacific (China, India, Japan, South Korea, Australia, South East Asia, Rest of Asia)
South America (Brazil, Argentina, Rest of South America)
Middle East and Africa (Saudi Arabia, UAE, Rest of Middle East, South Africa, Egypt, Rest of Africa)
Artisanal Gins Companies Profiled in the Study
Aqva Di Gin S.r.l.
Argintum 925 s.r.l.
Bombay Spirits Company Limited
Elephant Gin GmbH
Gin Primo Limited
Ginepraio S.r.l.
Imperiale s.r.l.
Maxi Milian Gin GmbH
Monkey Drum Distillery Ltd.
Muma S.r.l.
Peter in Florence s.r.l.
Sabatini Spirits S.r.l.
Selvatiq Spirits Ltd.
Torino Distillati S.r.l. (Malfy Gin)
*- List Not Exhaustive
Chapter 1. TABLE OF CONTENTS
Chapter 2. Introduction to Artisanal Gins Market
2.1. Market Overview
2.2. Key Statistics and Report Highlights
2.3. Scope of the Comprehensive Study
2.3.1. Market Definition
2.3.2 Countries and Regions Covered
2.3.3 Research Objective
2.3.4 Units, Currency, and Conversions
2.3.5 Industry Value Chain
2.4. Key Market Segments
2.5. Key Companies
2.6. Study Period
Chapter 3. Strategic Analysis Review
3.1. Artisanal Gins Pricing Analysis and Forecast
3.2. Porter’s Five Forces
3.3. Market Ecosystem
3.4. SWOT Analysis
3.5. Regulatory Scenario
3.3. Effects of Inflation, Russia-Ukraine War, moderating economic growth, and other macroeconomic factors
Chapter 4. Competitive Landscape
4.1. Market Share Analysis
4.1.1. Global Artisanal Gins Market Share by Company, 2023
4.1.2. Product Offerings of Leading Artisanal Gins Companies
4.2. Market Entropy
4.2.1. New Product Launches in the Industry
4.2.2. Mergers, Acquisitions, Joint ventures, and Partnerships
4.3. Key Strategies and Best Practices
Chapter 5. Global Market Projections: Best, Reference, and Low Case Scenarios
5.1. Growth Analysis- Case Scenario Definitions
5.2. Low Growth Case Scenario Forecasts
5.3. Reference Growth Case Scenario Forecasts
5.4. High Growth Case Scenario Forecasts
Chapter 6. Market Dynamics
6.1. Artisanal Gins Market Drivers
6.2. Artisanal Gins Market Challenges
6.6. Artisanal Gins Market Opportunities
6.4. Artisanal Gins Market Trends
Chapter 7. Global Artisanal Gins Market Outlook Trends
7.1. Global Artisanal Gins Revenue (USD Million) and CAGR (%) by Type (2021-2032)
7.2. Global Artisanal Gins Revenue (USD Million) and CAGR (%) by Application (2021-2032)
7.3. Global Artisanal Gins Revenue (USD Million) and CAGR (%) by Product (2021-2032)
By Alcohol
Up to 45%
Above 45%
By Sales Channel
Online
Offline
Chapter 8. Global Artisanal Gins Regional Analysis and Outlook
8.1. Global Artisanal Gins Revenue (USD Million) By Regions (2021- 2032)
8.2. North America Artisanal Gins Revenue (USD Million) by Country (2021-2032)
8.2.1. United States Artisanal Gins Regional Analysis and Outlook
8.2.2. Canada Artisanal Gins Regional Analysis and Outlook
8.2.3. Mexico Artisanal Gins Regional Analysis and Outlook
8.3. Europe Artisanal Gins Revenue (USD Million), by Country (2021-2032)
8.3.1. Germany Artisanal Gins Regional Analysis and Outlook
8.3.2. France Artisanal Gins Regional Analysis and Outlook
8.3.3. United Kingdom Artisanal Gins Regional Analysis and Outlook
8.3.4. Spain Artisanal Gins Regional Analysis and Outlook
8.3.5. Italy Artisanal Gins Regional Analysis and Outlook
8.3.6. Russia Artisanal Gins Regional Analysis and Outlook
8.3.7. Rest of Europe Artisanal Gins Regional Analysis and Outlook
8.4. Asia Pacific Artisanal Gins Revenue (USD Million) by Country (2021-2032)
8.4.1. China Artisanal Gins Regional Analysis and Outlook
8.4.2. Japan Artisanal Gins Regional Analysis and Outlook
8.4.3. India Artisanal Gins Regional Analysis and Outlook
8.4.4. South Korea Artisanal Gins Regional Analysis and Outlook
8.4.5. Australia Artisanal Gins Regional Analysis and Outlook
8.4.6. South East Asia Artisanal Gins Regional Analysis and Outlook
8.4.7. Rest of Asia Pacific Artisanal Gins Regional Analysis and Outlook
8.5. South America Artisanal Gins Revenue (USD Million), by Country (2021-2032)
8.5.1. Brazil Artisanal Gins Regional Analysis and Outlook
8.5.2. Argentina Artisanal Gins Regional Analysis and Outlook
8.5.3. Rest of South America Artisanal Gins Regional Analysis and Outlook
8.6. Middle East and Africa Artisanal Gins Revenue (USD Million) by Country (2021-2032)
8.6.1. Middle East Artisanal Gins Regional Analysis and Outlook
8.6.2. Africa Artisanal Gins Regional Analysis and Outlook
Chapter 9. North America Artisanal Gins Analysis and Outlook
9.1. North America Artisanal Gins Revenue (USD Million) by Segments (2021-2032)
9.1.1. North America Artisanal Gins Revenue (USD Million) by Type (2021-2032)
9.1.2. North America Artisanal Gins Revenue (USD Million) by Application (2021-2032)
9.1.3. North America Artisanal Gins Revenue (USD Million) by Product (2021-2032)
By Alcohol
Up to 45%
Above 45%
By Sales Channel
Online
Offline
Chapter 10. Europe Artisanal Gins Analysis and Outlook
10.1. Europe Artisanal Gins Revenue (USD Million), by Segments (USD Million) (2021-2032)
10.1.1. Europe Artisanal Gins Revenue (USD Million) by Type (2021-2032)
10.1.2. Europe Artisanal Gins Revenue (USD Million) by Application (2021-2032)
10.1.3. Europe Artisanal Gins Revenue (USD Million) by Product (2021-2032)
By Alcohol
Up to 45%
Above 45%
By Sales Channel
Online
Offline
Chapter 11. Asia Pacific Artisanal Gins Analysis and Outlook
11.1. Asia Pacific Artisanal Gins Revenue (USD Million), and Revenue (USD Million) by Segments (2021-2032)
11.1.1. Asia Pacific Artisanal Gins Revenue (USD Million) by Type (2021-2032)
11.1.2. Asia Pacific Artisanal Gins Revenue (USD Million) by Application (2021-2032)
11.1.3. Asia Pacific Artisanal Gins Revenue (USD Million) by Product (2021-2032)
By Alcohol
Up to 45%
Above 45%
By Sales Channel
Online
Offline
Chapter 12. South America Artisanal Gins Analysis and Outlook
12.1. South America Artisanal Gins Revenue (USD Million), by Segments (2021-2032)
12.1.1. South America Artisanal Gins Revenue (USD Million) by Type (2021-2032)
12.1.2. South America Artisanal Gins Revenue (USD Million) by Application (2021-2032)
12.1.3. South America Artisanal Gins Revenue (USD Million) by Product (2021-2032)
By Alcohol
Up to 45%
Above 45%
By Sales Channel
Online
Offline
Chapter 13. Middle East and Africa Artisanal Gins Analysis and Outlook
13.1. Middle East and Africa Artisanal Gins Revenue (USD Million), by Segments (2021-2032)
13.1.1. Middle East and Africa Artisanal Gins Revenue (USD Million) by Type (2021-2032)
13.1.2. Middle East and Africa Artisanal Gins Revenue (USD Million) by Application (2021-2032)
13.1.3. Middle East and Africa Artisanal Gins Revenue (USD Million) by Product (2021-2032)
By Alcohol
Up to 45%
Above 45%
By Sales Channel
Online
Offline
Chapter 14. Artisanal Gins Company Profiles
14.1 Business Overview
14.2 Product Profiles
14.3 SWOT Profiles
14.5 Recent Developments
14.6 Financial Profile
List of Companies
Aqva Di Gin S.r.l.
Argintum 925 s.r.l.
Bombay Spirits Company Limited
Elephant Gin GmbH
Gin Primo Limited
Ginepraio S.r.l.
Imperiale s.r.l.
Maxi Milian Gin GmbH
Monkey Drum Distillery Ltd.
Muma S.r.l.
Peter in Florence s.r.l.
Sabatini Spirits S.r.l.
Selvatiq Spirits Ltd.
Torino Distillati S.r.l. (Malfy Gin)
15. Methodology and Data Sources
15.1 Customization Offerings
15.2 Subscription Services
15.3 Related Reports
15.4 Publisher Expertise
LIST OF TABLES
Table 1 Market Segmentation Analysis
Table 2 Global Artisanal Gins Market Share of Leading Companies, 2023
Table 3 Product Offerings of Leading Companies
Table 4 Low Growth Scenario Forecasts
Table 5 Reference Case Growth Scenario
Table 6 High Growth Case Scenario
Table 7 Global Artisanal Gins Revenue (USD Million) And CAGR (%) By Type (2021-2032)
Table 8 Global Artisanal Gins Revenue (USD Million) And CAGR (%) By Application (2021-2032)
Table 9 Global Artisanal Gins Revenue (USD Million) And CAGR (%) By Product (2021-2032)
Table 10 Global Artisanal Gins Market Revenue (USD Million) By Regions (2021-2032)
Table 11 Global Artisanal Gins Market Share (%) By Regions (2021-2032)
Table 12 North America Artisanal Gins Revenue (USD Million) By Country (2021-2032)
Table 13 Europe Artisanal Gins Revenue (USD Million) By Country (2021-2032)
Table 14 Asia Pacific Artisanal Gins Revenue (USD Million) By Country (2021-2032)
Table 15 South America Artisanal Gins Revenue (USD Million) By Country (2021-2032)
Table 16 Middle East and Africa Artisanal Gins Revenue (USD Million) By Region (2021-2032)
Table 17 North America Artisanal Gins Revenue (USD Million) By Type (2021-2032)
Table 18 North America Artisanal Gins Revenue (USD Million) By Application (2021-2032)
Table 19 North America Artisanal Gins Revenue (USD Million) By Product (2021-2032)
Table 20 Europe Artisanal Gins Revenue (USD Million) By Type (2021-2032)
Table 21 Europe Artisanal Gins Revenue (USD Million) By Application (2021-2032)
Table 22 Europe Artisanal Gins Revenue (USD Million) By Product (2021-2032)
Table 23 Asia Pacific Artisanal Gins Revenue (USD Million) By Type (2021-2032)
Table 24 Asia Pacific Artisanal Gins Revenue (USD Million) By Application (2021-2032)
Table 25 Asia Pacific Artisanal Gins Revenue (USD Million) By Product (2021-2032)
Table 26 South America Artisanal Gins Revenue (USD Million) By Type (2021-2032)
Table 27 South America Artisanal Gins Revenue (USD Million) By Application (2021-2032)
Table 28 South America Artisanal Gins Revenue (USD Million) By Product (2021-2032)
Table 29 Middle East and Africa Artisanal Gins Revenue (USD Million) By Type (2021-2032)
Table 30 Middle East and Africa Artisanal Gins Revenue (USD Million) By Application (2021-2032)
Table 31 Middle East and Africa Artisanal Gins Revenue (USD Million) By Product (2021-2032)
LIST OF FIGURES
Figure 1. Market Scope
Figure 2. Pricing Forecasts Per Unit, 2023- 2032
Figure 3. Porter’s Five Forces
Figure 4. Global Artisanal Gins Market Revenue (USD Million) By Regions (2021-2032)
Figure 5. Global Artisanal Gins Market Share (%) By Regions (2023)
Figure 6. North America Artisanal Gins Revenue (USD Million) By Country (2021-2032)
Figure 7. United States Artisanal Gins Revenue (USD Million) By Country (2021-2032)
Figure 8. Canada Artisanal Gins Revenue (USD Million) By Country (2021-2032)
Figure 9. Mexico Artisanal Gins Revenue (USD Million) By Country (2021-2032)
Figure 10. Europe Artisanal Gins Revenue (USD Million) By Country (2021-2032)
Figure 11. Germany Artisanal Gins Revenue (USD Million) By Country (2021-2032)
Figure 12. France Artisanal Gins Revenue (USD Million) By Country (2021-2032)
Figure 13. United Kingdom Artisanal Gins Revenue (USD Million) By Country (2021-2032)
Figure 14. Spain Artisanal Gins Revenue (USD Million) By Country (2021-2032)
Figure 15. Italy Artisanal Gins Revenue (USD Million) By Country (2021-2032)
Figure 16. Russia Artisanal Gins Revenue (USD Million) By Country (2021-2032)
Figure 17. Rest of Europe Artisanal Gins Revenue (USD Million) By Country (2021-2032)
Figure 11. Asia Pacific Artisanal Gins Revenue (USD Million) By Country (2021-2032)
Figure 12. China Artisanal Gins Revenue (USD Million) By Country (2021-2032)
Figure 13. Japan Artisanal Gins Revenue (USD Million) By Country (2021-2032)
Figure 14. India Artisanal Gins Revenue (USD Million) By Country (2021-2032)
Figure 15. South Korea Artisanal Gins Revenue (USD Million) By Country (2021-2032)
Figure 16. Australia Artisanal Gins Revenue (USD Million) By Country (2021-2032)
Figure 17. South East Asia Artisanal Gins Revenue (USD Million) By Country (2021-2032)
Figure 18. South America Artisanal Gins Revenue (USD Million) By Country (2021-2032)
Figure 19. Brazil Artisanal Gins Revenue (USD Million) By Country (2021-2032)
Figure 20. Argentina Artisanal Gins Revenue (USD Million) By Country (2021-2032)
Figure 21. Rest of Asia Pacific Artisanal Gins Revenue (USD Million) By Country (2021-2032)
Figure 22. Middle East and Africa Artisanal Gins Revenue (USD Million) By Region (2021-2032)
Figure 23. Saudi Arabia Artisanal Gins Revenue (USD Million) By Region (2021-2032)
Figure 24. The UAE Artisanal Gins Revenue (USD Million) By Region (2021-2032)
Figure 25. Rest of Middle East Artisanal Gins Revenue (USD Million) By Region (2021-2032)
Figure 26. South Africa Artisanal Gins Revenue (USD Million) By Region (2021-2032)
Figure 27. Africa Artisanal Gins Revenue (USD Million) By Region (2021-2032)
Figure 28. North America Artisanal Gins Revenue (USD Million) By Type (2021-2032)
Figure 29. North America Artisanal Gins Revenue (USD Million) By Application (2021-2032)
Figure 30. North America Artisanal Gins Revenue (USD Million) By Product (2021-2032)
Figure 31. Europe Artisanal Gins Revenue (USD Million) By Type (2021-2032)
Figure 32. Europe Artisanal Gins Revenue (USD Million) By Application (2021-2032)
Figure 33. Europe Artisanal Gins Revenue (USD Million) By Product (2021-2032)
Figure 34. Asia Pacific Artisanal Gins Revenue (USD Million) By Type (2021-2032)
Figure 35. Asia Pacific Artisanal Gins Revenue (USD Million) By Application (2021-2032)
Figure 36. Asia Pacific Artisanal Gins Revenue (USD Million) By Product (2021-2032)
Figure 37. South America Artisanal Gins Revenue (USD Million) By Type (2021-2032)
Figure 38. South America Artisanal Gins Revenue (USD Million) By Application (2021-2032)
Figure 39. South America Artisanal Gins Revenue (USD Million) By Product (2021-2032)
Figure 40. Middle East and Africa Artisanal Gins Revenue (USD Million) By Type (2021-2032)
Figure 41. Middle East and Africa Artisanal Gins Revenue (USD Million) By Application (2021-2032)
Figure 42. Middle East and Africa Artisanal Gins Revenue (USD Million) By Product (2021-2032)
By Alcohol
Up to 45%
Above 45%
By Sales Channel
Online
Offline
Countries Analyzed
North America (US, Canada, Mexico)
Europe (Germany, UK, France, Spain, Italy, Russia, Rest of Europe)
Asia Pacific (China, India, Japan, South Korea, Australia, South East Asia, Rest of Asia)
South America (Brazil, Argentina, Rest of South America)
Middle East and Africa (Saudi Arabia, UAE, Rest of Middle East, South Africa, Egypt, Rest of Africa)
