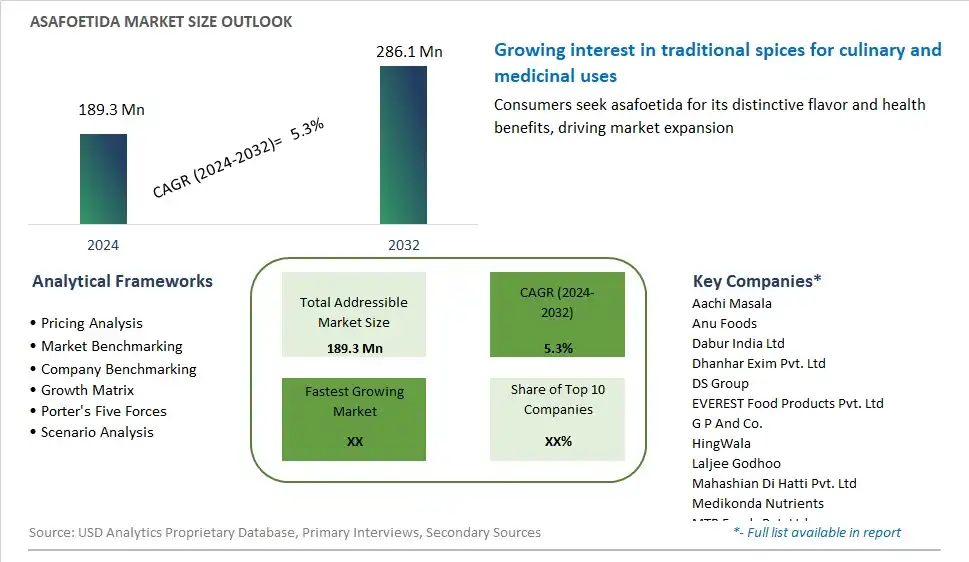
Global Asafoetida Market Size is valued at $189.3 Million in 2024 and is forecast to register a growth rate (CAGR) of 5.3% to reach $286.1 Million by 2032.
The global Asafoetida Market Comprehensive Study analyzes and forecasts the market size across 6 regions and 24 countries for diverse segments -By Product (Milky white asafoetida, Red asafoetida), By Distribution Channel (Offline, Online)
An Introduction to Asafoetida Market
Asafoetida, also known as "hing," occupies a significant place in the culinary landscape of 2024. This pungent spice, derived from the resin of the Ferula plant, has long been valued for its distinctive flavor and medicinal properties in various cuisines, particularly in Indian and Middle Eastern cooking. In recent years, the global demand for asafoetida has surged, driven by its versatility in enhancing the taste of dishes and its perceived health benefits, such as aiding digestion and reducing bloating. Asafoetida is increasingly being incorporated into mainstream recipes and packaged foods as consumers become more adventurous in their culinary pursuits and seek out authentic flavors from around the world. Additionally, the rising popularity of plant-based and vegetarian diets has contributed to the growing demand for asafoetida as a natural flavor enhancer in meat-free dishes.
Asafoetida Competitive Landscape
The market report analyses the leading companies in the industry including Aachi Masala, Anu Foods, Dabur India Ltd, Dhanhar Exim Pvt. Ltd, DS Group, EVEREST Food Products Pvt. Ltd, G P And Co., HingWala, Laljee Godhoo, Mahashian Di Hatti Pvt. Ltd, Medikonda Nutrients, MTR Foods Pvt. Ltd, MVM Asafoetida, Patanjali Ayurved Ltd, Qualfis Foodz Pvt. Ltd, S S Pandian and Sons, Simhas Spices and Herbals, SRK Traders and Manufacturers, Tata Sons Pvt. Ltd , VKA Food Products, and Others.
Asafoetida Market Dynamics
Asafoetida Market Trend: Rising Demand for Authentic and Ethnic Cuisine
One prominent trend in the asafoetida market is the rising demand for authentic and ethnic cuisine. As global culinary trends continue to evolve, there is a growing interest among consumers in exploring diverse and traditional flavors from around the world. Asafoetida, also known as "hing," is a key ingredient in many South Asian and Middle Eastern dishes, prized for its unique aroma and flavor profile. This trend is driven by increasing cultural diversity, globalization, and the popularity of ethnic cuisines in mainstream culinary circles. As consumers seek to replicate authentic flavors at home or explore new dining experiences, the demand for asafoetida as a staple spice ingredient is expected to rise, presenting opportunities for growth in the market.
Market Driver: Growing Awareness of Health Benefits and Culinary Uses
A key driver shaping the asafoetida market is the growing awareness of its health benefits and culinary uses. Asafoetida has been traditionally used in Ayurvedic medicine for its digestive and medicinal properties, including its ability to aid in digestion, alleviate flatulence, and treat respiratory ailments. Additionally, it is valued for its unique umami flavor, which adds depth and complexity to savory dishes. As consumers become more health-conscious and adventurous in their cooking endeavors, there is a heightened interest in incorporating asafoetida into everyday cooking as a natural flavor enhancer and digestive aid. This driver is fueled by the increasing availability of information about traditional herbs and spices, the popularity of holistic health practices, and the trend towards home cooking and DIY culinary experimentation, driving demand for asafoetida in both consumer and commercial markets.
Market Opportunity: Expansion into New Culinary Applications and Product Formats
An opportunity for growth in the asafoetida market lies in expansion into new culinary applications and product formats. While traditionally used as a powdered spice in Indian and Middle Eastern cuisines, there is potential to innovate and diversify product offerings to appeal to a wider audience. This includes introducing asafoetida-infused condiments, sauces, marinades, and seasoning blends that cater to modern cooking styles and flavor preferences. Additionally, there is opportunity to explore value-added forms of asafoetida such as oil extracts, tinctures, or ready-to-use paste formulations, offering convenience and versatility to consumers. By tapping into emerging culinary trends, experimenting with new product formulations, and exploring partnerships with food manufacturers and chefs, stakeholders in the asafoetida market can unlock new opportunities for market expansion and differentiation.
Asafoetida Market Share Analysis: Milky White Asafoetida held the dominant market share in 2024
The Milky White Asafoetida segment stands as the largest within the Asafoetida Market due to its widespread usage, versatile culinary applications, and cultural significance in various cuisines. Milky white asafoetida, also known as hing or heeng, is a resin obtained from the roots of the Ferula species, primarily Ferula assa-foetida. This variety of asafoetida is preferred by consumers for its strong flavor profile, pungent aroma, and distinctive taste, which adds depth and complexity to dishes. Milky white asafoetida is commonly used as a flavoring agent and digestive aid in Indian, Middle Eastern, and Central Asian cuisines, where it is added to lentil dishes, curries, pickles, and spice blends. Additionally, milky white asafoetida is valued for its medicinal properties and is often used in traditional medicine practices for its purported health benefits, including digestive support, anti-inflammatory effects, and respiratory relief. With its rich cultural heritage and widespread culinary use, the Milky White Asafoetida segment maintains its dominance in the Asafoetida Market, catering to the diverse tastes and preferences of consumers worldwide.
Asafoetida Market Share Analysis: Online market is poised to register the fastest growth rae over the forecast period to 2032
The Online segment within the Asafoetida Market is the fastest-growing, propelled by the increasing adoption of e-commerce platforms and the convenience of online shopping for spices and culinary ingredients. Asafoetida, known for its unique flavor and medicinal properties, has garnered significant attention from consumers seeking authentic and high-quality products. Online platforms offer a wide variety of asafoetida brands and grades, providing consumers with a diverse range of options to suit their preferences. Additionally, the COVID-19 pandemic has accelerated the shift towards online shopping as consumers prioritize safety and social distancing measures. Furthermore, online retailers often provide competitive pricing, special promotions, and convenient delivery options, enhancing the overall shopping experience and driving consumer preference towards online channels. As a result, the Online segment of the Asafoetida Market experiences rapid growth, reshaping the distribution landscape and driving innovation in digital marketing strategies within the culinary industry.
Asafoetida Market Segmentation
By Product
Milky white asafoetida
Red asafoetida
By Distribution Channel
Offline
Online
Countries Analyzed
North America (US, Canada, Mexico)
Europe (Germany, UK, France, Spain, Italy, Russia, Rest of Europe)
Asia Pacific (China, India, Japan, South Korea, Australia, South East Asia, Rest of Asia)
South America (Brazil, Argentina, Rest of South America)
Middle East and Africa (Saudi Arabia, UAE, Rest of Middle East, South Africa, Egypt, Rest of Africa)
Asafoetida Companies Profiled in the Study
Aachi Masala
Anu Foods
Dabur India Ltd
Dhanhar Exim Pvt. Ltd
DS Group
EVEREST Food Products Pvt. Ltd
G P And Co.
HingWala
Laljee Godhoo
Mahashian Di Hatti Pvt. Ltd
Medikonda Nutrients
MTR Foods Pvt. Ltd
MVM Asafoetida
Patanjali Ayurved Ltd
Qualfis Foodz Pvt. Ltd
S S Pandian and Sons
Simhas Spices and Herbals
SRK Traders and Manufacturers
Tata Sons Pvt. Ltd
VKA Food Products
*- List Not Exhaustive
Chapter 1. TABLE OF CONTENTS
Chapter 2. Introduction to Asafoetida Market
2.1. Market Overview
2.2. Key Statistics and Report Highlights
2.3. Scope of the Comprehensive Study
2.3.1. Market Definition
2.3.2 Countries and Regions Covered
2.3.3 Research Objective
2.3.4 Units, Currency, and Conversions
2.3.5 Industry Value Chain
2.4. Key Market Segments
2.5. Key Companies
2.6. Study Period
Chapter 3. Strategic Analysis Review
3.1. Asafoetida Pricing Analysis and Forecast
3.2. Porter’s Five Forces
3.3. Market Ecosystem
3.4. SWOT Analysis
3.5. Regulatory Scenario
3.3. Effects of Inflation, Russia-Ukraine War, moderating economic growth, and other macroeconomic factors
Chapter 4. Competitive Landscape
4.1. Market Share Analysis
4.1.1. Global Asafoetida Market Share by Company, 2023
4.1.2. Product Offerings of Leading Asafoetida Companies
4.2. Market Entropy
4.2.1. New Product Launches in the Industry
4.2.2. Mergers, Acquisitions, Joint ventures, and Partnerships
4.3. Key Strategies and Best Practices
Chapter 5. Global Market Projections: Best, Reference, and Low Case Scenarios
5.1. Growth Analysis- Case Scenario Definitions
5.2. Low Growth Case Scenario Forecasts
5.3. Reference Growth Case Scenario Forecasts
5.4. High Growth Case Scenario Forecasts
Chapter 6. Market Dynamics
6.1. Asafoetida Market Drivers
6.2. Asafoetida Market Challenges
6.6. Asafoetida Market Opportunities
6.4. Asafoetida Market Trends
Chapter 7. Global Asafoetida Market Outlook Trends
7.1. Global Asafoetida Revenue (USD Million) and CAGR (%) by Type (2021-2032)
7.2. Global Asafoetida Revenue (USD Million) and CAGR (%) by Application (2021-2032)
7.3. Global Asafoetida Revenue (USD Million) and CAGR (%) by Product (2021-2032)
By Product
Milky white asafoetida
Red asafoetida
By Distribution Channel
Offline
Online
Chapter 8. Global Asafoetida Regional Analysis and Outlook
8.1. Global Asafoetida Revenue (USD Million) By Regions (2021- 2032)
8.2. North America Asafoetida Revenue (USD Million) by Country (2021-2032)
8.2.1. United States Asafoetida Regional Analysis and Outlook
8.2.2. Canada Asafoetida Regional Analysis and Outlook
8.2.3. Mexico Asafoetida Regional Analysis and Outlook
8.3. Europe Asafoetida Revenue (USD Million), by Country (2021-2032)
8.3.1. Germany Asafoetida Regional Analysis and Outlook
8.3.2. France Asafoetida Regional Analysis and Outlook
8.3.3. United Kingdom Asafoetida Regional Analysis and Outlook
8.3.4. Spain Asafoetida Regional Analysis and Outlook
8.3.5. Italy Asafoetida Regional Analysis and Outlook
8.3.6. Russia Asafoetida Regional Analysis and Outlook
8.3.7. Rest of Europe Asafoetida Regional Analysis and Outlook
8.4. Asia Pacific Asafoetida Revenue (USD Million) by Country (2021-2032)
8.4.1. China Asafoetida Regional Analysis and Outlook
8.4.2. Japan Asafoetida Regional Analysis and Outlook
8.4.3. India Asafoetida Regional Analysis and Outlook
8.4.4. South Korea Asafoetida Regional Analysis and Outlook
8.4.5. Australia Asafoetida Regional Analysis and Outlook
8.4.6. South East Asia Asafoetida Regional Analysis and Outlook
8.4.7. Rest of Asia Pacific Asafoetida Regional Analysis and Outlook
8.5. South America Asafoetida Revenue (USD Million), by Country (2021-2032)
8.5.1. Brazil Asafoetida Regional Analysis and Outlook
8.5.2. Argentina Asafoetida Regional Analysis and Outlook
8.5.3. Rest of South America Asafoetida Regional Analysis and Outlook
8.6. Middle East and Africa Asafoetida Revenue (USD Million) by Country (2021-2032)
8.6.1. Middle East Asafoetida Regional Analysis and Outlook
8.6.2. Africa Asafoetida Regional Analysis and Outlook
Chapter 9. North America Asafoetida Analysis and Outlook
9.1. North America Asafoetida Revenue (USD Million) by Segments (2021-2032)
9.1.1. North America Asafoetida Revenue (USD Million) by Type (2021-2032)
9.1.2. North America Asafoetida Revenue (USD Million) by Application (2021-2032)
9.1.3. North America Asafoetida Revenue (USD Million) by Product (2021-2032)
By Product
Milky white asafoetida
Red asafoetida
By Distribution Channel
Offline
Online
Chapter 10. Europe Asafoetida Analysis and Outlook
10.1. Europe Asafoetida Revenue (USD Million), by Segments (USD Million) (2021-2032)
10.1.1. Europe Asafoetida Revenue (USD Million) by Type (2021-2032)
10.1.2. Europe Asafoetida Revenue (USD Million) by Application (2021-2032)
10.1.3. Europe Asafoetida Revenue (USD Million) by Product (2021-2032)
By Product
Milky white asafoetida
Red asafoetida
By Distribution Channel
Offline
Online
Chapter 11. Asia Pacific Asafoetida Analysis and Outlook
11.1. Asia Pacific Asafoetida Revenue (USD Million), and Revenue (USD Million) by Segments (2021-2032)
11.1.1. Asia Pacific Asafoetida Revenue (USD Million) by Type (2021-2032)
11.1.2. Asia Pacific Asafoetida Revenue (USD Million) by Application (2021-2032)
11.1.3. Asia Pacific Asafoetida Revenue (USD Million) by Product (2021-2032)
By Product
Milky white asafoetida
Red asafoetida
By Distribution Channel
Offline
Online
Chapter 12. South America Asafoetida Analysis and Outlook
12.1. South America Asafoetida Revenue (USD Million), by Segments (2021-2032)
12.1.1. South America Asafoetida Revenue (USD Million) by Type (2021-2032)
12.1.2. South America Asafoetida Revenue (USD Million) by Application (2021-2032)
12.1.3. South America Asafoetida Revenue (USD Million) by Product (2021-2032)
By Product
Milky white asafoetida
Red asafoetida
By Distribution Channel
Offline
Online
Chapter 13. Middle East and Africa Asafoetida Analysis and Outlook
13.1. Middle East and Africa Asafoetida Revenue (USD Million), by Segments (2021-2032)
13.1.1. Middle East and Africa Asafoetida Revenue (USD Million) by Type (2021-2032)
13.1.2. Middle East and Africa Asafoetida Revenue (USD Million) by Application (2021-2032)
13.1.3. Middle East and Africa Asafoetida Revenue (USD Million) by Product (2021-2032)
By Product
Milky white asafoetida
Red asafoetida
By Distribution Channel
Offline
Online
Chapter 14. Asafoetida Company Profiles
14.1 Business Overview
14.2 Product Profiles
14.3 SWOT Profiles
14.5 Recent Developments
14.6 Financial Profile
List of Companies
Aachi Masala
Anu Foods
Dabur India Ltd
Dhanhar Exim Pvt. Ltd
DS Group
EVEREST Food Products Pvt. Ltd
G P And Co.
HingWala
Laljee Godhoo
Mahashian Di Hatti Pvt. Ltd
Medikonda Nutrients
MTR Foods Pvt. Ltd
MVM Asafoetida
Patanjali Ayurved Ltd
Qualfis Foodz Pvt. Ltd
S S Pandian and Sons
Simhas Spices and Herbals
SRK Traders and Manufacturers
Tata Sons Pvt. Ltd
VKA Food Products
15. Methodology and Data Sources
15.1 Customization Offerings
15.2 Subscription Services
15.3 Related Reports
15.4 Publisher Expertise
LIST OF TABLES
Table 1 Market Segmentation Analysis
Table 2 Global Asafoetida Market Share of Leading Companies, 2023
Table 3 Product Offerings of Leading Companies
Table 4 Low Growth Scenario Forecasts
Table 5 Reference Case Growth Scenario
Table 6 High Growth Case Scenario
Table 7 Global Asafoetida Revenue (USD Million) And CAGR (%) By Type (2021-2032)
Table 8 Global Asafoetida Revenue (USD Million) And CAGR (%) By Application (2021-2032)
Table 9 Global Asafoetida Revenue (USD Million) And CAGR (%) By Product (2021-2032)
Table 10 Global Asafoetida Market Revenue (USD Million) By Regions (2021-2032)
Table 11 Global Asafoetida Market Share (%) By Regions (2021-2032)
Table 12 North America Asafoetida Revenue (USD Million) By Country (2021-2032)
Table 13 Europe Asafoetida Revenue (USD Million) By Country (2021-2032)
Table 14 Asia Pacific Asafoetida Revenue (USD Million) By Country (2021-2032)
Table 15 South America Asafoetida Revenue (USD Million) By Country (2021-2032)
Table 16 Middle East and Africa Asafoetida Revenue (USD Million) By Region (2021-2032)
Table 17 North America Asafoetida Revenue (USD Million) By Type (2021-2032)
Table 18 North America Asafoetida Revenue (USD Million) By Application (2021-2032)
Table 19 North America Asafoetida Revenue (USD Million) By Product (2021-2032)
Table 20 Europe Asafoetida Revenue (USD Million) By Type (2021-2032)
Table 21 Europe Asafoetida Revenue (USD Million) By Application (2021-2032)
Table 22 Europe Asafoetida Revenue (USD Million) By Product (2021-2032)
Table 23 Asia Pacific Asafoetida Revenue (USD Million) By Type (2021-2032)
Table 24 Asia Pacific Asafoetida Revenue (USD Million) By Application (2021-2032)
Table 25 Asia Pacific Asafoetida Revenue (USD Million) By Product (2021-2032)
Table 26 South America Asafoetida Revenue (USD Million) By Type (2021-2032)
Table 27 South America Asafoetida Revenue (USD Million) By Application (2021-2032)
Table 28 South America Asafoetida Revenue (USD Million) By Product (2021-2032)
Table 29 Middle East and Africa Asafoetida Revenue (USD Million) By Type (2021-2032)
Table 30 Middle East and Africa Asafoetida Revenue (USD Million) By Application (2021-2032)
Table 31 Middle East and Africa Asafoetida Revenue (USD Million) By Product (2021-2032)
LIST OF FIGURES
Figure 1. Market Scope
Figure 2. Pricing Forecasts Per Unit, 2023- 2032
Figure 3. Porter’s Five Forces
Figure 4. Global Asafoetida Market Revenue (USD Million) By Regions (2021-2032)
Figure 5. Global Asafoetida Market Share (%) By Regions (2023)
Figure 6. North America Asafoetida Revenue (USD Million) By Country (2021-2032)
Figure 7. United States Asafoetida Revenue (USD Million) By Country (2021-2032)
Figure 8. Canada Asafoetida Revenue (USD Million) By Country (2021-2032)
Figure 9. Mexico Asafoetida Revenue (USD Million) By Country (2021-2032)
Figure 10. Europe Asafoetida Revenue (USD Million) By Country (2021-2032)
Figure 11. Germany Asafoetida Revenue (USD Million) By Country (2021-2032)
Figure 12. France Asafoetida Revenue (USD Million) By Country (2021-2032)
Figure 13. United Kingdom Asafoetida Revenue (USD Million) By Country (2021-2032)
Figure 14. Spain Asafoetida Revenue (USD Million) By Country (2021-2032)
Figure 15. Italy Asafoetida Revenue (USD Million) By Country (2021-2032)
Figure 16. Russia Asafoetida Revenue (USD Million) By Country (2021-2032)
Figure 17. Rest of Europe Asafoetida Revenue (USD Million) By Country (2021-2032)
Figure 11. Asia Pacific Asafoetida Revenue (USD Million) By Country (2021-2032)
Figure 12. China Asafoetida Revenue (USD Million) By Country (2021-2032)
Figure 13. Japan Asafoetida Revenue (USD Million) By Country (2021-2032)
Figure 14. India Asafoetida Revenue (USD Million) By Country (2021-2032)
Figure 15. South Korea Asafoetida Revenue (USD Million) By Country (2021-2032)
Figure 16. Australia Asafoetida Revenue (USD Million) By Country (2021-2032)
Figure 17. South East Asia Asafoetida Revenue (USD Million) By Country (2021-2032)
Figure 18. South America Asafoetida Revenue (USD Million) By Country (2021-2032)
Figure 19. Brazil Asafoetida Revenue (USD Million) By Country (2021-2032)
Figure 20. Argentina Asafoetida Revenue (USD Million) By Country (2021-2032)
Figure 21. Rest of Asia Pacific Asafoetida Revenue (USD Million) By Country (2021-2032)
Figure 22. Middle East and Africa Asafoetida Revenue (USD Million) By Region (2021-2032)
Figure 23. Saudi Arabia Asafoetida Revenue (USD Million) By Region (2021-2032)
Figure 24. The UAE Asafoetida Revenue (USD Million) By Region (2021-2032)
Figure 25. Rest of Middle East Asafoetida Revenue (USD Million) By Region (2021-2032)
Figure 26. South Africa Asafoetida Revenue (USD Million) By Region (2021-2032)
Figure 27. Africa Asafoetida Revenue (USD Million) By Region (2021-2032)
Figure 28. North America Asafoetida Revenue (USD Million) By Type (2021-2032)
Figure 29. North America Asafoetida Revenue (USD Million) By Application (2021-2032)
Figure 30. North America Asafoetida Revenue (USD Million) By Product (2021-2032)
Figure 31. Europe Asafoetida Revenue (USD Million) By Type (2021-2032)
Figure 32. Europe Asafoetida Revenue (USD Million) By Application (2021-2032)
Figure 33. Europe Asafoetida Revenue (USD Million) By Product (2021-2032)
Figure 34. Asia Pacific Asafoetida Revenue (USD Million) By Type (2021-2032)
Figure 35. Asia Pacific Asafoetida Revenue (USD Million) By Application (2021-2032)
Figure 36. Asia Pacific Asafoetida Revenue (USD Million) By Product (2021-2032)
Figure 37. South America Asafoetida Revenue (USD Million) By Type (2021-2032)
Figure 38. South America Asafoetida Revenue (USD Million) By Application (2021-2032)
Figure 39. South America Asafoetida Revenue (USD Million) By Product (2021-2032)
Figure 40. Middle East and Africa Asafoetida Revenue (USD Million) By Type (2021-2032)
Figure 41. Middle East and Africa Asafoetida Revenue (USD Million) By Application (2021-2032)
Figure 42. Middle East and Africa Asafoetida Revenue (USD Million) By Product (2021-2032)
By Product
Milky white asafoetida
Red asafoetida
By Distribution Channel
Offline
Online
Countries Analyzed
North America (US, Canada, Mexico)
Europe (Germany, UK, France, Spain, Italy, Russia, Rest of Europe)
Asia Pacific (China, India, Japan, South Korea, Australia, South East Asia, Rest of Asia)
South America (Brazil, Argentina, Rest of South America)
Middle East and Africa (Saudi Arabia, UAE, Rest of Middle East, South Africa, Egypt, Rest of Africa)
