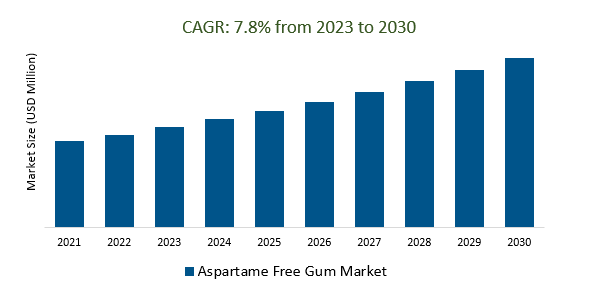
The Aspartame Free Gum Market Size is estimated to register 7.8% growth over the forecast period from 2023 to 2030.
Aspartame Free Gum Market Overview
Heightened awareness and preference among consumers for healthier alternatives are fueling the demand for aspartame-free chewing gums. Concerns regarding potential health risks associated with aspartame consumption are leading health-conscious consumers to seek gum options free from this artificial sweetener. Manufacturers are introducing gums sweetened with natural alternatives like stevia, xylitol, or sorbitol, addressing both the health concerns related to aspartame and the general trend towards reduced sugar intake. Additionally, changing dietary preferences and an increasing focus on natural and clean-label products are prompting manufacturers to innovate and introduce chewing gum formulations without aspartame. Further, the rising prevalence of health conditions like allergies or sensitivities to specific food additives are contributing to the demand for market growth.
Aspartame Free Gum Market Dynamics
Market Trends- The Aspartame Free Gum Market prioritizes flavour innovation and heightened sensory appeal to meet evolving consumer preferences
Evolving consumer preferences for engaging taste experiences and enjoyable chewing gum encounters are fueling the market.
With the absence of aspartame, companies are exploring an array of natural sweeteners and flavouring agents, aiming to craft unique and enticing gum flavours.
Further, Manufacturers and producers are intensifying efforts to diversify flavour profiles in gum products, focusing on enhancing sensory experiences encompassing texture, aroma, and mouthfeel.
Market Driver- Health consciousness is the driving force behind the increased demand for aspartame-free gum in the market
Consumers' escalating concerns regarding health risks associated with aspartame consumption are prompting a shift toward aspartame-free gum options.
Businesses are offering gum products free from aspartame, targeting health-conscious consumers and capitalizing on this demand to bolster market presence and meet evolving consumer preferences.
Additionally, Gums offering additional benefits like teeth whitening, breath freshening, or digestive support are gaining traction, thus driving the market growth.
Market Opportunity- Shift Towards Natural and Clean Label Preferences in Aspartame Free Gum Market.
Growing consumer inclination towards more transparent and natural alternatives within the chewing gum segment are fueling the market.
Producers are launching aspartame-free gum formulas that incorporate natural sweeteners such as stevia, xylitol, and other plant-based alternatives, prioritizing transparency, authenticity, and healthier options.
Additionally, increasing demand for gum products that steer clear of artificial sweeteners, particularly aspartame, and align with cleaner ingredient labels are driving the market growth.
Market Share Analysis- Tab Gum will register the fastest growth
The Aspartame Free Gum Market is analyzed across Stick Gum and Tab Gum. Tab Gum is poised to register the fastest growth. In the Aspartame Free Gum Market, tab gum stands as a noteworthy variation that gained prominence for its convenience and discrete form. These gums typically come in small, compressed tablet shapes and are known for their portability and ease of use. Tab gum often offers a measured dose of flavour and sweetness, contributing to its appeal among consumers seeking controlled chewing experiences. Manufacturers frequently produce aspartame-free tab gum formulations to cater to health-conscious consumers who avoid artificial sweeteners. Aspartame-free tab gum variants commonly utilize alternative natural sweeteners like xylitol, stevia, or erythritol to provide sweetness without compromising on taste. This form of gum has gained traction due to its suitability for on-the-go consumption and the convenience of carrying smaller, individually wrapped pieces, aligning with consumer preferences for discrete, portion-controlled, and aspartame-free gum options.
Market Share Analysis- Erythritol held a significant market share in 2023
The Aspartame Free Gum Market is analyzed across various Polyol types including Erythritol, Xylitol and Others. Of these, Erythritol held a significant market share in 2023. It is a natural sugar alcohol found in fruits and fermented foods, known for its sugar-like taste without the added calories. Erythritol's significance in aspartame-free gums lies in its ability to offer sweetness with minimal impact on blood sugar levels and negligible calories, making it an appealing choice for health-conscious consumers seeking reduced-calorie or sugar-free alternatives. Within the realm of aspartame-free gum formulations, erythritol serves as a key ingredient, providing a sweet taste without causing dental issues or contributing to spikes in blood sugar. Its non-cariogenic properties make it a favourable option for oral health-focused gums, where it helps inhibit the growth of bacteria, reducing the risk of cavities. Manufacturers often favour erythritol in formulating aspartame-free gums due to its natural origin and low-calorie content, aligning with consumer preferences for clean-label and healthier products.
Aspartame Free Gum Market Segmentation
By Type
By Polyol Type
- Erythritol
- Xylitol
- Others
By Sales Channel
- Online Sales
- Offline Sales
By Region
- North America (United States, Canada, Mexico)
- Europe (Germany, France, United Kingdom, Spain, Italy, Others)
- Asia Pacific (China, India, Japan, South Korea, Australia, Others)
- Latin America (Brazil, Argentina, Others)
- Middle East and Africa (Saudi Arabia, UAE, Kuwait, Other Middle East, South Africa, Nigeria, Other Africa)
Aspartame Free Gum Market Companies
- Mars Inc (United States)
- Cadbury (United Kingdom)
- Lotte Corporation (South Korea)
- Perfetti Van Melle (Italy)
- The Hershey Company (United States)
- Roquette (France)
- The PUR Company Inc (Canada)
- Neuro (United States)
*List not exhaustive
Aspartame Free Gum Market Outlook 2023
1 Market Overview
1.1 Introduction to the Aspartame Free Gum Market
1.2 Scope of the Study
1.3 Research Objective
1.3.1 Key Market Scope and Segments
1.3.2 Players Covered
1.3.3 Years Considered
2 Executive Summary
2.1 2023 Aspartame Free Gum Industry- Market Statistics
3 Market Dynamics
3.1 Market Drivers
3.2 Market Challenges
3.3 Market Opportunities
3.4 Market Trends
4 Market Factor Analysis
4.1 Porter’s Five Forces
4.2 Market Entropy
4.2.1 Global Aspartame Free Gum Market Companies with Area Served
4.2.2 Products Offerings Global Aspartame Free Gum Market
5 COVID-19 Impact Analysis and Outlook Scenarios
5.1.1 Covid-19 Impact Analysis
5.1.2 post-COVID-19 Scenario- Low Growth Case
5.1.3 Post-COVID-19 Scenario- Reference Growth Case
5.1.4 Post-COVID-19 Scenario- Low Growth Case
6 Global Aspartame Free Gum Market Trends
6.1 Global Aspartame Free Gum Revenue (USD Million) and CAGR (%) by Type (2018-2030)
6.2 Global Aspartame Free Gum Revenue (USD Million) and CAGR (%) by Applications (2018-2030)
6.3 Global Aspartame Free Gum Revenue (USD Million) and CAGR (%) by Regions (2018-2030)
7 Global Aspartame Free Gum Market Revenue (USD Million) by Type, and Applications (2018-2022)
7.1 Global Aspartame Free Gum Revenue (USD Million) by Type (2018-2022)
7.1.1 Global Aspartame Free Gum Revenue (USD Million), Market Share (%) by Type (2018-2022)
7.2 Global Aspartame Free Gum Revenue (USD Million) by Applications (2018-2022)
7.2.1 Global Aspartame Free Gum Revenue (USD Million), Market Share (%) by Applications (2018-2022)
8 Global Aspartame Free Gum Development Regional Status and Outlook
8.1 Global Aspartame Free Gum Revenue (USD Million) By Regions (2018-2022)
8.2 North America Aspartame Free Gum Revenue (USD Million) by Type, and Application (2018-2022)
8.2.1 North America Aspartame Free Gum Revenue (USD Million) by Country (2018-2022)
8.2.2 North America Aspartame Free Gum Revenue (USD Million) by Type (2018-2022)
8.2.3 North America Aspartame Free Gum Revenue (USD Million) by Applications (2018-2022)
8.3 Europe Aspartame Free Gum Revenue (USD Million), by Type, and Applications (USD Million) (2018-2022)
8.3.1 Europe Aspartame Free Gum Revenue (USD Million), by Country (2018-2022)
8.3.2 Europe Aspartame Free Gum Revenue (USD Million) by Type (2018-2022)
8.3.3 Europe Aspartame Free Gum Revenue (USD Million) by Applications (2018-2022)
8.4 Asia Pacific Aspartame Free Gum Revenue (USD Million), and Revenue (USD Million) by Type, and Applications (2018-2022)
8.4.1 Asia Pacific Aspartame Free Gum Revenue (USD Million) by Country (2018-2022)
8.4.2 Asia Pacific Aspartame Free Gum Revenue (USD Million) by Type (2018-2022)
8.4.3 Asia Pacific Aspartame Free Gum Revenue (USD Million) by Applications (2018-2022)
8.5 South America Aspartame Free Gum Revenue (USD Million), by Type, and Applications (2018-2022)
8.5.1 South America Aspartame Free Gum Revenue (USD Million), by Country (2018-2022)
8.5.2 South America Aspartame Free Gum Revenue (USD Million) by Type (2018-2022)
8.5.3 South America Aspartame Free Gum Revenue (USD Million) by Applications (2018-2022)
8.6 Middle East and Africa Aspartame Free Gum Revenue (USD Million), by Type, Technology, Application, Thickness (2018-2022)
8.6.1 Middle East and Africa Aspartame Free Gum Revenue (USD Million) by Country (2018-2022)
8.6.2 Middle East and Africa Aspartame Free Gum Revenue (USD Million) by Type (2018-2022)
8.6.3 Middle East and Africa Aspartame Free Gum Revenue (USD Million) by Applications (2018-2022)
9 Company Profiles
10 Global Aspartame Free Gum Market Revenue (USD Million), by Type, and Applications (2023-2030)
10.1 Global Aspartame Free Gum Revenue (USD Million) and Market Share (%) by Type (2023-2030)
10.1.1 Global Aspartame Free Gum Revenue (USD Million), and Market Share (%) by Type (2023-2030)
10.2 Global Aspartame Free Gum Revenue (USD Million) and Market Share (%) by Applications (2023-2030)
10.2.1 Global Aspartame Free Gum Revenue (USD Million), and Market Share (%) by Applications (2023-2030)
11 Global Aspartame Free Gum Development Regional Status and Outlook Forecast
11.1 Global Aspartame Free Gum Revenue (USD Million) By Regions (2023-2030)
11.2 North America Aspartame Free Gum Revenue (USD Million) by Type, and Applications (2023-2030)
11.2.1 North America Aspartame Free Gum Revenue (USD) Million by Country (2023-2030)
11.2.2 North America Aspartame Free Gum Revenue (USD Million), by Type (2023-2030)
11.2.3 North America Aspartame Free Gum Revenue (USD Million), Market Share (%) by Applications (2023-2030)
11.3 Europe Aspartame Free Gum Revenue (USD Million), by Type, and Applications (2023-2030)
11.3.1 Europe Aspartame Free Gum Revenue (USD Million), by Country (2023-2030)
11.3.2 Europe Aspartame Free Gum Revenue (USD Million), by Type (2023-2030)
11.3.3 Europe Aspartame Free Gum Revenue (USD Million), by Applications (2023-2030)
11.4 Asia Pacific Aspartame Free Gum Revenue (USD Million) by Type, and Applications (2023-2030)
11.4.1 Asia Pacific Aspartame Free Gum Revenue (USD Million), by Country (2023-2030)
11.4.2 Asia Pacific Aspartame Free Gum Revenue (USD Million), by Type (2023-2030)
11.4.3 Asia Pacific Aspartame Free Gum Revenue (USD Million), by Applications (2023-2030)
11.5 South America Aspartame Free Gum Revenue (USD Million), by Type, and Applications (2023-2030)
11.5.1 South America Aspartame Free Gum Revenue (USD Million), by Country (2023-2030)
11.5.2 South America Aspartame Free Gum Revenue (USD Million), by Type (2023-2030)
11.5.3 South America Aspartame Free Gum Revenue (USD Million), by Applications (2023-2030)
11.6 Middle East and Africa Aspartame Free Gum Revenue (USD Million), by Type, and Applications (2023-2030)
11.6.1 Middle East and Africa Aspartame Free Gum Revenue (USD Million), by Region (2023-2030)
11.6.2 Middle East and Africa Aspartame Free Gum Revenue (USD Million), by Type (2023-2030)
11.6.3 Middle East and Africa Aspartame Free Gum Revenue (USD Million), by Applications (2023-2030)
12 Methodology and Data Sources
12.1 Methodology/Research Approach
12.1.1 Research Programs/Design
12.1.2 Market Size Estimation
12.1.3 Market Breakdown and Data Triangulation
12.2 Data Sources
12.2.1 Secondary Sources
12.2.2 Primary Sources
12.3 Disclaimer
List of Tables
Table 1 Market Segmentation Analysis
Table 2 Global Aspartame Free Gum Market Companies with Areas Served
Table 3 Products Offerings Global Aspartame Free Gum Market
Table 4 Low Growth Scenario Forecasts
Table 5 Reference Case Growth Scenario
Table 6 High Growth Case Scenario
Table 7 Global Aspartame Free Gum Revenue (USD Million) And CAGR (%) By Type (2018-2030)
Table 8 Global Aspartame Free Gum Revenue (USD Million) And CAGR (%) By Applications (2018-2030)
Table 9 Global Aspartame Free Gum Revenue (USD Million) And CAGR (%) By Regions (2018-2030)
Table 10 Global Aspartame Free Gum Revenue (USD Million) By Type (2018-2022)
Table 11 Global Aspartame Free Gum Revenue Market Share (%) By Type (2018-2022)
Table 12 Global Aspartame Free Gum Revenue (USD Million) By Applications (2018-2022)
Table 13 Global Aspartame Free Gum Revenue Market Share (%) By Applications (2018-2022)
Table 14 Global Aspartame Free Gum Market Revenue (USD Million) By Regions (2018-2022)
Table 15 Global Aspartame Free Gum Market Share (%) By Regions (2018-2022)
Table 16 North America Aspartame Free Gum Revenue (USD Million) By Country (2018-2022)
Table 17 North America Aspartame Free Gum Revenue (USD Million) By Type (2018-2022)
Table 18 North America Aspartame Free Gum Revenue (USD Million) By Applications (2018-2022)
Table 19 Europe Aspartame Free Gum Revenue (USD Million) By Country (2018-2022)
Table 20 Europe Aspartame Free Gum Revenue (USD Million) By Type (2018-2022)
Table 21 Europe Aspartame Free Gum Revenue (USD Million) By Applications (2018-2022)
Table 22 Asia Pacific Aspartame Free Gum Revenue (USD Million) By Country (2018-2022)
Table 23 Asia Pacific Aspartame Free Gum Revenue (USD Million) By Type (2018-2022)
Table 24 Asia Pacific Aspartame Free Gum Revenue (USD Million) By Applications (2018-2022)
Table 25 South America Aspartame Free Gum Revenue (USD Million) By Country (2018-2022)
Table 26 South America Aspartame Free Gum Revenue (USD Million) By Type (2018-2022)
Table 27 South America Aspartame Free Gum Revenue (USD Million) By Applications (2018-2022)
Table 28 Middle East and Africa Aspartame Free Gum Revenue (USD Million) By Region (2018-2022)
Table 29 Middle East and Africa Aspartame Free Gum Revenue (USD Million) By Type (2018-2022)
Table 30 Middle East and Africa Aspartame Free Gum Revenue (USD Million) By Applications (2018-2022)
Table 31 Financial Analysis
Table 32 Global Aspartame Free Gum Revenue (USD Million) By Type (2023-2030)
Table 33 Global Aspartame Free Gum Revenue Market Share (%) By Type (2023-2030)
Table 34 Global Aspartame Free Gum Revenue (USD Million) By Applications (2023-2030)
Table 35 Global Aspartame Free Gum Revenue Market Share (%) By Applications (2023-2030)
Table 36 Global Aspartame Free Gum Market Revenue (USD Million), And Revenue (USD Million) By Regions (2023-2030)
Table 37 North America Aspartame Free Gum Revenue (USD)By Country (2023-2030)
Table 38 North America Aspartame Free Gum Revenue (USD Million) By Type (2023-2030)
Table 39 North America Aspartame Free Gum Revenue (USD Million) By Applications (2023-2030)
Table 40 Europe Aspartame Free Gum Revenue (USD Million) By Country (2023-2030)
Table 41 Europe Aspartame Free Gum Revenue (USD Million) By Type (2023-2030)
Table 42 Europe Aspartame Free Gum Revenue (USD Million) By Applications (2023-2030)
Table 43 Asia Pacific Aspartame Free Gum Revenue (USD Million) By Country (2023-2030)
Table 44 Asia Pacific Aspartame Free Gum Revenue (USD Million) By Type (2023-2030)
Table 45 Asia Pacific Aspartame Free Gum Revenue (USD Million) By Applications (2023-2030)
Table 46 South America Aspartame Free Gum Revenue (USD Million) By Country (2023-2030)
Table 47 South America Aspartame Free Gum Revenue (USD Million) By Type (2023-2030)
Table 48 South America Aspartame Free Gum Revenue (USD Million) By Applications (2023-2030)
Table 49 Middle East and Africa Aspartame Free Gum Revenue (USD Million) By Region (2023-2030)
Table 50 Middle East and Africa Aspartame Free Gum Revenue (USD Million) By Region (2023-2030)
Table 51 Middle East and Africa Aspartame Free Gum Revenue (USD Million) By Type (2023-2030)
Table 52 Middle East and Africa Aspartame Free Gum Revenue (USD Million) By Applications (2023-2030)
Table 53 Research Programs/Design for This Report
Table 54 Key Data Information from Secondary Sources
Table 55 Key Data Information from Primary Sources
List of Figures
Figure 1 Market Scope
Figure 2 Porter’s Five Forces
Figure 3 Global Aspartame Free Gum Revenue (USD Million) By Type (2018-2022)
Figure 4 Global Aspartame Free Gum Revenue Market Share (%) By Type (2022)
Figure 5 Global Aspartame Free Gum Revenue (USD Million) By Applications (2018-2022)
Figure 6 Global Aspartame Free Gum Revenue Market Share (%) By Applications (2022)
Figure 7 Global Aspartame Free Gum Market Revenue (USD Million) By Regions (2018-2022)
Figure 8 Global Aspartame Free Gum Market Share (%) By Regions (2022)
Figure 9 North America Aspartame Free Gum Revenue (USD Million) By Country (2018-2022)
Figure 10 North America Aspartame Free Gum Revenue (USD Million) By Type (2018-2022)
Figure 11 North America Aspartame Free Gum Revenue (USD Million) By Applications (2018-2022)
Figure 12 Europe Aspartame Free Gum Revenue (USD Million) By Country (2018-2022)
Figure 13 Europe Aspartame Free Gum Revenue (USD Million) By Type (2018-2022)
Figure 14 Europe Aspartame Free Gum Revenue (USD Million) By Applications (2018-2022)
Figure 15 Asia Pacific Aspartame Free Gum Revenue (USD Million) By Country (2018-2022)
Figure 16 Asia Pacific Aspartame Free Gum Revenue (USD Million) By Type (2018-2022)
Figure 17 Asia Pacific Aspartame Free Gum Revenue (USD Million) By Applications (2018-2022)
Figure 18 South America Aspartame Free Gum Revenue (USD Million) By Country (2018-2022)
Figure 19 South America Aspartame Free Gum Revenue (USD Million) By Type (2018-2022)
Figure 20 South America Aspartame Free Gum Revenue (USD Million) By Applications (2018-2022)
Figure 21 Middle East and Africa Aspartame Free Gum Revenue (USD Million) By Region (2018-2022)
Figure 22 Middle East and Africa Aspartame Free Gum Revenue (USD Million) By Type (2018-2022)
Figure 23 Middle East and Africa Aspartame Free Gum Revenue (USD Million) By Applications (2018-2022)
Figure 24 Global Aspartame Free Gum Revenue (USD Million) By Type (2023-2030)
Figure 25 Global Aspartame Free Gum Revenue Market Share (%) By Type (2030)
Figure 26 Global Aspartame Free Gum Revenue (USD Million) By Applications (2023-2030)
Figure 27 Global Aspartame Free Gum Revenue Market Share (%) By Applications (2030)
Figure 28 Global Aspartame Free Gum Market Revenue (USD Million) By Regions (2023-2030)
Figure 29 North America Aspartame Free Gum Revenue (USD Million) By Country (2023-2030)
Figure 30 North America Aspartame Free Gum Revenue (USD Million) By Type (2023-2030)
Figure 31 North America Aspartame Free Gum Revenue (USD Million) By Applications (2023-2030)
Figure 32 Europe Aspartame Free Gum Revenue (USD Million) By Country (2023-2030)
Figure 33 Europe Aspartame Free Gum Revenue (USD Million) By Type (2023-2030)
Figure 34 Europe Aspartame Free Gum Revenue (USD Million) By Applications (2023-2030)
Figure 35 Asia Pacific Aspartame Free Gum Revenue (USD Million) By Country (2023-2030)
Figure 36 Asia Pacific Aspartame Free Gum Revenue (USD Million) By Type (2023-2030)
Figure 37 Asia Pacific Aspartame Free Gum Revenue (USD Million) By Applications (2023-2030)
Figure 38 South America Aspartame Free Gum Revenue (USD Million) By Country (2023-2030)
Figure 39 South America Aspartame Free Gum Revenue (USD Million) By Type (2023-2030)
Figure 40 South America Aspartame Free Gum Revenue (USD Million) By Applications (2023-2030)
Figure 41 Middle East and Africa Aspartame Free Gum Revenue (USD Million) By Region (2023-2030)
Figure 42 Middle East and Africa Aspartame Free Gum Revenue (USD Million) By Region (2023-2030)
Figure 43 Middle East and Africa Aspartame Free Gum Revenue (USD Million) By Type (2023-2030)
Figure 44 Middle East and Africa Aspartame Free Gum Revenue (USD Million) By Applications (2023-2030)
Figure 45 Bottom-Up and Top-Down Approaches For This Report
Figure 46 Data Triangulation
