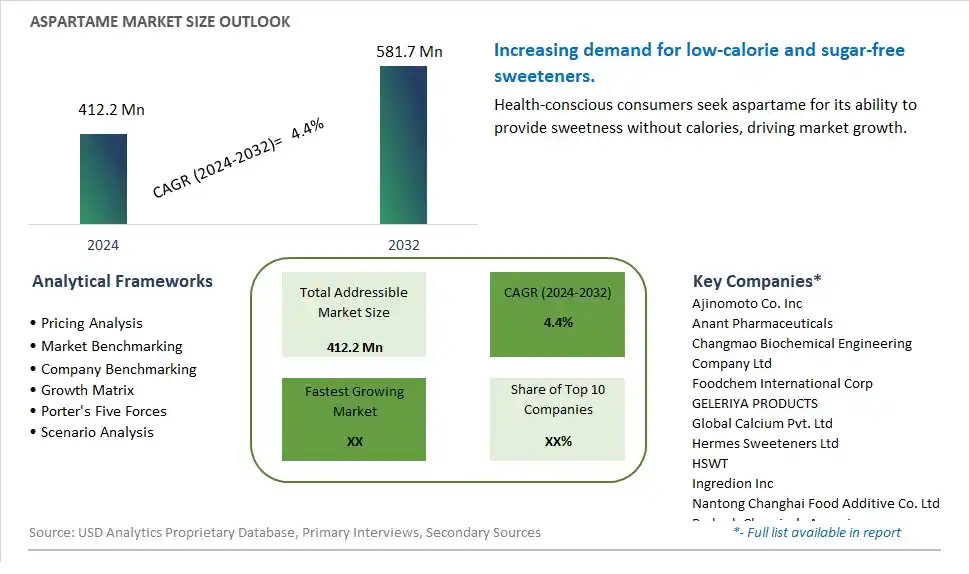
Global Aspartame Market Size is valued at $412.2 Million in 2024 and is forecast to register a growth rate (CAGR) of 4.4% to reach $581.7 Million by 2032.
The global Aspartame Market Comprehensive Study analyzes and forecasts the market size across 6 regions and 24 countries for diverse segments -By Form (Powder, Granular), By End-User (Beverages, Bakery and Confectionery, Dietary, Dairy, Pharmaceuticals, Table Top Sweeteners, Others), By Sales Channel (Offline, Online)
An Introduction to Aspartame Market
The Aspartame market in 2024 is witnessing steady growth, driven by its extensive use as a low-calorie sweetener in the food and beverage industry. Aspartame, known for its high sweetness intensity and low caloric content, is widely used in diet sodas, sugar-free gums, and low-calorie desserts. The market is supported by the growing demand for sugar substitutes amid increasing health consciousness and concerns about obesity and diabetes. Advances in production technologies are enhancing the quality and cost-efficiency of aspartame. The market is also benefiting from regulatory approvals and its acceptance in various global markets, ensuring its continued use in a wide range of products.
Aspartame Competitive Landscape
The market report analyses the leading companies in the industry including Ajinomoto Co. Inc, Anant Pharmaceuticals, Changmao Biochemical Engineering Company Ltd, Foodchem International Corp, GELERIYA PRODUCTS, Global Calcium Pvt. Ltd, Hermes Sweeteners Ltd, HSWT, Ingredion Inc, Nantong Changhai Food Additive Co. Ltd, Prakash Chemicals Agencies, Taj Pharmaceuticals Ltd, Vitasweet Co. Ltd, Whole Earth Brands, Yogi Dye Chem Industries, and Others.
Aspartame Market Dynamics
Aspartame Market Trend: Shift Towards Healthier Sugar Substitutes
The most prominent market trend for Aspartame is the ongoing shift towards healthier sugar substitutes in the food and beverage industry. With increasing concerns about sugar consumption and its impact on health, consumers are actively seeking alternatives that offer sweetness without the calories or negative health effects associated with sugar. Aspartame, a low-calorie artificial sweetener, is positioned to capitalize on this trend as a sugar substitute in a wide range of products, including beverages, desserts, and low-calorie snacks, meeting consumer demands for healthier options without compromising taste.
Aspartame Market Driver: Rising Demand for Low-Calorie and Sugar-Free Products
A key market driver for Aspartame is the rising demand for low-calorie and sugar-free products driven by health-conscious consumers. Aspartame's ability to provide sweetness without contributing significant calories makes it a preferred choice for manufacturers looking to formulate products targeted at calorie-conscious consumers, diabetics, and individuals aiming to reduce their sugar intake. The increasing awareness of the adverse effects of excessive sugar consumption, such as obesity, diabetes, and dental issues, fuels the demand for aspartame as a sugar substitute in products marketed as healthier alternatives.
Aspartame Market Opportunity: Expansion in Functional Foods and Beverages
A potential opportunity within the Aspartame market lies in its expansion within the functional foods and beverages segment. As consumers seek functional benefits from their food and beverage choices, there's an opportunity to incorporate aspartame into formulations that offer additional health benefits, such as fortified beverages, sugar-free energy drinks, and functional snacks. Collaborating with nutritionists, dietitians, and health experts to develop products that address specific health concerns while maintaining sweetness and palatability can help unlock new market opportunities for aspartame as a versatile ingredient in functional and healthier food options.
Aspartame Market Share Analysis: Powder Form segment generated the highest revenue share in the industry
The largest segment in the Aspartame Market is the Powder Form. Powdered aspartame is widely used in various food and beverage applications due to its ease of handling, versatility, and compatibility with different recipes. It is a highly sought-after sweetener in the food industry, known for its intense sweetness and ability to enhance flavors without adding significant calories. The Powder Form of aspartame is extensively utilized in the production of beverages, desserts, confectionery items, dairy products, and pharmaceuticals. Its popularity can be attributed to factors such as its stability, solubility, and cost-effectiveness in formulation processes. The convenience of measuring and incorporating powdered aspartame into recipes makes it a preferred choice for manufacturers aiming to create low-calorie and sugar-free products to meet consumer demands for healthier alternatives. The Powder Form segment of the Aspartame Market dominates due to its widespread applications and favorable characteristics for food and beverage production.
Aspartame Market Share Analysis: Dietary End-User is the fastest growing segment over the forecast period to 2032
The fastest growing segment in the Aspartame Market is the Dietary End-User segment. This growth can be attributed to several key factors driving consumer preferences and market trends. With the rising awareness of health and wellness, more consumers are adopting dietary habits focused on low-calorie and sugar-free options. Aspartame, known for its intense sweetness and minimal caloric content, has gained significant traction in the dietary segment. It is widely used as a sugar substitute in various dietary products such as low-calorie beverages, sugar-free snacks, and diet-friendly desserts. The demand for dietary products incorporating aspartame continues to surge as consumers seek alternatives that allow them to enjoy sweet flavors without compromising on their health goals. Further, advancements in food technology and formulation techniques are further fueling the growth of the Dietary End-User segment, enabling manufacturers to develop innovative and appealing products that cater to the evolving dietary preferences of consumers.
Aspartame Market Share Analysis: Offline Sales Channel segment generated the highest revenue share in the industry
The largest segment in the Aspartame Market is the Offline Sales Channel. Despite the increasing popularity of online shopping across various industries, the offline sales channel remains dominant in the distribution of aspartame products. This is due to several factors that favor offline retail channels, especially in the food and beverage industry. One of the primary reasons is the preference of many consumers, particularly in certain demographics, to physically inspect and purchase food and beverage products before making a purchase. Additionally, the offline sales channel provides a personalized shopping experience, allowing consumers to interact with sales representatives, seek recommendations, and receive immediate assistance. This personal touch often leads to increased consumer trust and loyalty, driving higher sales volumes in offline retail outlets. Furthermore, the widespread presence of supermarkets, convenience stores, specialty food shops, and pharmacies contributes to the dominance of the offline sales channel in the distribution of aspartame products. Despite the growth of online sales channels, the offline segment continues to hold a substantial market share, making it the largest segment in the Aspartame Market.
Aspartame Market Segmentation
By Form
Powder
Granular
By End-User
Beverages
Bakery and Confectionery
Dietary
Dairy
Pharmaceuticals
Table Top Sweeteners
Others
By Sales Channel
Offline
Online
Countries Analyzed
North America (US, Canada, Mexico)
Europe (Germany, UK, France, Spain, Italy, Russia, Rest of Europe)
Asia Pacific (China, India, Japan, South Korea, Australia, South East Asia, Rest of Asia)
South America (Brazil, Argentina, Rest of South America)
Middle East and Africa (Saudi Arabia, UAE, Rest of Middle East, South Africa, Egypt, Rest of Africa)
Aspartame Companies Profiled in the Study
Ajinomoto Co. Inc
Anant Pharmaceuticals
Changmao Biochemical Engineering Company Ltd
Foodchem International Corp
GELERIYA PRODUCTS
Global Calcium Pvt. Ltd
Hermes Sweeteners Ltd
HSWT
Ingredion Inc
Nantong Changhai Food Additive Co. Ltd
Prakash Chemicals Agencies
Taj Pharmaceuticals Ltd
Vitasweet Co. Ltd
Whole Earth Brands
Yogi Dye Chem Industries
*- List Not Exhaustive
Chapter 1. TABLE OF CONTENTS
Chapter 2. Introduction to Aspartame Market
2.1. Market Overview
2.2. Key Statistics and Report Highlights
2.3. Scope of the Comprehensive Study
2.3.1. Market Definition
2.3.2 Countries and Regions Covered
2.3.3 Research Objective
2.3.4 Units, Currency, and Conversions
2.3.5 Industry Value Chain
2.4. Key Market Segments
2.5. Key Companies
2.6. Study Period
Chapter 3. Strategic Analysis Review
3.1. Aspartame Pricing Analysis and Forecast
3.2. Porter’s Five Forces
3.3. Market Ecosystem
3.4. SWOT Analysis
3.5. Regulatory Scenario
3.3. Effects of Inflation, Russia-Ukraine War, moderating economic growth, and other macroeconomic factors
Chapter 4. Competitive Landscape
4.1. Market Share Analysis
4.1.1. Global Aspartame Market Share by Company, 2023
4.1.2. Product Offerings of Leading Aspartame Companies
4.2. Market Entropy
4.2.1. New Product Launches in the Industry
4.2.2. Mergers, Acquisitions, Joint ventures, and Partnerships
4.3. Key Strategies and Best Practices
Chapter 5. Global Market Projections: Best, Reference, and Low Case Scenarios
5.1. Growth Analysis- Case Scenario Definitions
5.2. Low Growth Case Scenario Forecasts
5.3. Reference Growth Case Scenario Forecasts
5.4. High Growth Case Scenario Forecasts
Chapter 6. Market Dynamics
6.1. Aspartame Market Drivers
6.2. Aspartame Market Challenges
6.6. Aspartame Market Opportunities
6.4. Aspartame Market Trends
Chapter 7. Global Aspartame Market Outlook Trends
7.1. Global Aspartame Revenue (USD Million) and CAGR (%) by Type (2021-2032)
7.2. Global Aspartame Revenue (USD Million) and CAGR (%) by Application (2021-2032)
7.3. Global Aspartame Revenue (USD Million) and CAGR (%) by Product (2021-2032)
By Form
Powder
Granular
By End-User
Beverages
Bakery and Confectionery
Dietary
Dairy
Pharmaceuticals
Table Top Sweeteners
Others
By Sales Channel
Offline
Online
Chapter 8. Global Aspartame Regional Analysis and Outlook
8.1. Global Aspartame Revenue (USD Million) By Regions (2021- 2032)
8.2. North America Aspartame Revenue (USD Million) by Country (2021-2032)
8.2.1. United States Aspartame Regional Analysis and Outlook
8.2.2. Canada Aspartame Regional Analysis and Outlook
8.2.3. Mexico Aspartame Regional Analysis and Outlook
8.3. Europe Aspartame Revenue (USD Million), by Country (2021-2032)
8.3.1. Germany Aspartame Regional Analysis and Outlook
8.3.2. France Aspartame Regional Analysis and Outlook
8.3.3. United Kingdom Aspartame Regional Analysis and Outlook
8.3.4. Spain Aspartame Regional Analysis and Outlook
8.3.5. Italy Aspartame Regional Analysis and Outlook
8.3.6. Russia Aspartame Regional Analysis and Outlook
8.3.7. Rest of Europe Aspartame Regional Analysis and Outlook
8.4. Asia Pacific Aspartame Revenue (USD Million) by Country (2021-2032)
8.4.1. China Aspartame Regional Analysis and Outlook
8.4.2. Japan Aspartame Regional Analysis and Outlook
8.4.3. India Aspartame Regional Analysis and Outlook
8.4.4. South Korea Aspartame Regional Analysis and Outlook
8.4.5. Australia Aspartame Regional Analysis and Outlook
8.4.6. South East Asia Aspartame Regional Analysis and Outlook
8.4.7. Rest of Asia Pacific Aspartame Regional Analysis and Outlook
8.5. South America Aspartame Revenue (USD Million), by Country (2021-2032)
8.5.1. Brazil Aspartame Regional Analysis and Outlook
8.5.2. Argentina Aspartame Regional Analysis and Outlook
8.5.3. Rest of South America Aspartame Regional Analysis and Outlook
8.6. Middle East and Africa Aspartame Revenue (USD Million) by Country (2021-2032)
8.6.1. Middle East Aspartame Regional Analysis and Outlook
8.6.2. Africa Aspartame Regional Analysis and Outlook
Chapter 9. North America Aspartame Analysis and Outlook
9.1. North America Aspartame Revenue (USD Million) by Segments (2021-2032)
9.1.1. North America Aspartame Revenue (USD Million) by Type (2021-2032)
9.1.2. North America Aspartame Revenue (USD Million) by Application (2021-2032)
9.1.3. North America Aspartame Revenue (USD Million) by Product (2021-2032)
By Form
Powder
Granular
By End-User
Beverages
Bakery and Confectionery
Dietary
Dairy
Pharmaceuticals
Table Top Sweeteners
Others
By Sales Channel
Offline
Online
Chapter 10. Europe Aspartame Analysis and Outlook
10.1. Europe Aspartame Revenue (USD Million), by Segments (USD Million) (2021-2032)
10.1.1. Europe Aspartame Revenue (USD Million) by Type (2021-2032)
10.1.2. Europe Aspartame Revenue (USD Million) by Application (2021-2032)
10.1.3. Europe Aspartame Revenue (USD Million) by Product (2021-2032)
By Form
Powder
Granular
By End-User
Beverages
Bakery and Confectionery
Dietary
Dairy
Pharmaceuticals
Table Top Sweeteners
Others
By Sales Channel
Offline
Online
Chapter 11. Asia Pacific Aspartame Analysis and Outlook
11.1. Asia Pacific Aspartame Revenue (USD Million), and Revenue (USD Million) by Segments (2021-2032)
11.1.1. Asia Pacific Aspartame Revenue (USD Million) by Type (2021-2032)
11.1.2. Asia Pacific Aspartame Revenue (USD Million) by Application (2021-2032)
11.1.3. Asia Pacific Aspartame Revenue (USD Million) by Product (2021-2032)
By Form
Powder
Granular
By End-User
Beverages
Bakery and Confectionery
Dietary
Dairy
Pharmaceuticals
Table Top Sweeteners
Others
By Sales Channel
Offline
Online
Chapter 12. South America Aspartame Analysis and Outlook
12.1. South America Aspartame Revenue (USD Million), by Segments (2021-2032)
12.1.1. South America Aspartame Revenue (USD Million) by Type (2021-2032)
12.1.2. South America Aspartame Revenue (USD Million) by Application (2021-2032)
12.1.3. South America Aspartame Revenue (USD Million) by Product (2021-2032)
By Form
Powder
Granular
By End-User
Beverages
Bakery and Confectionery
Dietary
Dairy
Pharmaceuticals
Table Top Sweeteners
Others
By Sales Channel
Offline
Online
Chapter 13. Middle East and Africa Aspartame Analysis and Outlook
13.1. Middle East and Africa Aspartame Revenue (USD Million), by Segments (2021-2032)
13.1.1. Middle East and Africa Aspartame Revenue (USD Million) by Type (2021-2032)
13.1.2. Middle East and Africa Aspartame Revenue (USD Million) by Application (2021-2032)
13.1.3. Middle East and Africa Aspartame Revenue (USD Million) by Product (2021-2032)
By Form
Powder
Granular
By End-User
Beverages
Bakery and Confectionery
Dietary
Dairy
Pharmaceuticals
Table Top Sweeteners
Others
By Sales Channel
Offline
Online
Chapter 14. Aspartame Company Profiles
14.1 Business Overview
14.2 Product Profiles
14.3 SWOT Profiles
14.5 Recent Developments
14.6 Financial Profile
List of Companies
Ajinomoto Co. Inc
Anant Pharmaceuticals
Changmao Biochemical Engineering Company Ltd
Foodchem International Corp
GELERIYA PRODUCTS
Global Calcium Pvt. Ltd
Hermes Sweeteners Ltd
HSWT
Ingredion Inc
Nantong Changhai Food Additive Co. Ltd
Prakash Chemicals Agencies
Taj Pharmaceuticals Ltd
Vitasweet Co. Ltd
Whole Earth Brands
Yogi Dye Chem Industries
15. Methodology and Data Sources
15.1 Customization Offerings
15.2 Subscription Services
15.3 Related Reports
15.4 Publisher Expertise
LIST OF TABLES
Table 1 Market Segmentation Analysis
Table 2 Global Aspartame Market Share of Leading Companies, 2023
Table 3 Product Offerings of Leading Companies
Table 4 Low Growth Scenario Forecasts
Table 5 Reference Case Growth Scenario
Table 6 High Growth Case Scenario
Table 7 Global Aspartame Revenue (USD Million) And CAGR (%) By Type (2021-2032)
Table 8 Global Aspartame Revenue (USD Million) And CAGR (%) By Application (2021-2032)
Table 9 Global Aspartame Revenue (USD Million) And CAGR (%) By Product (2021-2032)
Table 10 Global Aspartame Market Revenue (USD Million) By Regions (2021-2032)
Table 11 Global Aspartame Market Share (%) By Regions (2021-2032)
Table 12 North America Aspartame Revenue (USD Million) By Country (2021-2032)
Table 13 Europe Aspartame Revenue (USD Million) By Country (2021-2032)
Table 14 Asia Pacific Aspartame Revenue (USD Million) By Country (2021-2032)
Table 15 South America Aspartame Revenue (USD Million) By Country (2021-2032)
Table 16 Middle East and Africa Aspartame Revenue (USD Million) By Region (2021-2032)
Table 17 North America Aspartame Revenue (USD Million) By Type (2021-2032)
Table 18 North America Aspartame Revenue (USD Million) By Application (2021-2032)
Table 19 North America Aspartame Revenue (USD Million) By Product (2021-2032)
Table 20 Europe Aspartame Revenue (USD Million) By Type (2021-2032)
Table 21 Europe Aspartame Revenue (USD Million) By Application (2021-2032)
Table 22 Europe Aspartame Revenue (USD Million) By Product (2021-2032)
Table 23 Asia Pacific Aspartame Revenue (USD Million) By Type (2021-2032)
Table 24 Asia Pacific Aspartame Revenue (USD Million) By Application (2021-2032)
Table 25 Asia Pacific Aspartame Revenue (USD Million) By Product (2021-2032)
Table 26 South America Aspartame Revenue (USD Million) By Type (2021-2032)
Table 27 South America Aspartame Revenue (USD Million) By Application (2021-2032)
Table 28 South America Aspartame Revenue (USD Million) By Product (2021-2032)
Table 29 Middle East and Africa Aspartame Revenue (USD Million) By Type (2021-2032)
Table 30 Middle East and Africa Aspartame Revenue (USD Million) By Application (2021-2032)
Table 31 Middle East and Africa Aspartame Revenue (USD Million) By Product (2021-2032)
LIST OF FIGURES
Figure 1. Market Scope
Figure 2. Pricing Forecasts Per Unit, 2023- 2032
Figure 3. Porter’s Five Forces
Figure 4. Global Aspartame Market Revenue (USD Million) By Regions (2021-2032)
Figure 5. Global Aspartame Market Share (%) By Regions (2023)
Figure 6. North America Aspartame Revenue (USD Million) By Country (2021-2032)
Figure 7. United States Aspartame Revenue (USD Million) By Country (2021-2032)
Figure 8. Canada Aspartame Revenue (USD Million) By Country (2021-2032)
Figure 9. Mexico Aspartame Revenue (USD Million) By Country (2021-2032)
Figure 10. Europe Aspartame Revenue (USD Million) By Country (2021-2032)
Figure 11. Germany Aspartame Revenue (USD Million) By Country (2021-2032)
Figure 12. France Aspartame Revenue (USD Million) By Country (2021-2032)
Figure 13. United Kingdom Aspartame Revenue (USD Million) By Country (2021-2032)
Figure 14. Spain Aspartame Revenue (USD Million) By Country (2021-2032)
Figure 15. Italy Aspartame Revenue (USD Million) By Country (2021-2032)
Figure 16. Russia Aspartame Revenue (USD Million) By Country (2021-2032)
Figure 17. Rest of Europe Aspartame Revenue (USD Million) By Country (2021-2032)
Figure 11. Asia Pacific Aspartame Revenue (USD Million) By Country (2021-2032)
Figure 12. China Aspartame Revenue (USD Million) By Country (2021-2032)
Figure 13. Japan Aspartame Revenue (USD Million) By Country (2021-2032)
Figure 14. India Aspartame Revenue (USD Million) By Country (2021-2032)
Figure 15. South Korea Aspartame Revenue (USD Million) By Country (2021-2032)
Figure 16. Australia Aspartame Revenue (USD Million) By Country (2021-2032)
Figure 17. South East Asia Aspartame Revenue (USD Million) By Country (2021-2032)
Figure 18. South America Aspartame Revenue (USD Million) By Country (2021-2032)
Figure 19. Brazil Aspartame Revenue (USD Million) By Country (2021-2032)
Figure 20. Argentina Aspartame Revenue (USD Million) By Country (2021-2032)
Figure 21. Rest of Asia Pacific Aspartame Revenue (USD Million) By Country (2021-2032)
Figure 22. Middle East and Africa Aspartame Revenue (USD Million) By Region (2021-2032)
Figure 23. Saudi Arabia Aspartame Revenue (USD Million) By Region (2021-2032)
Figure 24. The UAE Aspartame Revenue (USD Million) By Region (2021-2032)
Figure 25. Rest of Middle East Aspartame Revenue (USD Million) By Region (2021-2032)
Figure 26. South Africa Aspartame Revenue (USD Million) By Region (2021-2032)
Figure 27. Africa Aspartame Revenue (USD Million) By Region (2021-2032)
Figure 28. North America Aspartame Revenue (USD Million) By Type (2021-2032)
Figure 29. North America Aspartame Revenue (USD Million) By Application (2021-2032)
Figure 30. North America Aspartame Revenue (USD Million) By Product (2021-2032)
Figure 31. Europe Aspartame Revenue (USD Million) By Type (2021-2032)
Figure 32. Europe Aspartame Revenue (USD Million) By Application (2021-2032)
Figure 33. Europe Aspartame Revenue (USD Million) By Product (2021-2032)
Figure 34. Asia Pacific Aspartame Revenue (USD Million) By Type (2021-2032)
Figure 35. Asia Pacific Aspartame Revenue (USD Million) By Application (2021-2032)
Figure 36. Asia Pacific Aspartame Revenue (USD Million) By Product (2021-2032)
Figure 37. South America Aspartame Revenue (USD Million) By Type (2021-2032)
Figure 38. South America Aspartame Revenue (USD Million) By Application (2021-2032)
Figure 39. South America Aspartame Revenue (USD Million) By Product (2021-2032)
Figure 40. Middle East and Africa Aspartame Revenue (USD Million) By Type (2021-2032)
Figure 41. Middle East and Africa Aspartame Revenue (USD Million) By Application (2021-2032)
Figure 42. Middle East and Africa Aspartame Revenue (USD Million) By Product (2021-2032)
By Form
Powder
Granular
By End-User
Beverages
Bakery and Confectionery
Dietary
Dairy
Pharmaceuticals
Table Top Sweeteners
Others
By Sales Channel
Offline
Online
Countries Analyzed
North America (US, Canada, Mexico)
Europe (Germany, UK, France, Spain, Italy, Russia, Rest of Europe)
Asia Pacific (China, India, Japan, South Korea, Australia, South East Asia, Rest of Asia)
South America (Brazil, Argentina, Rest of South America)
Middle East and Africa (Saudi Arabia, UAE, Rest of Middle East, South Africa, Egypt, Rest of Africa)
