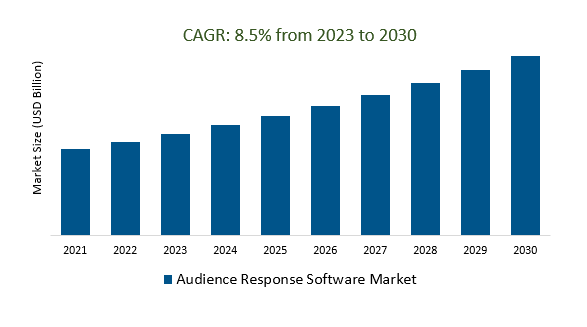
The Global Audience Response Software Market Size is estimated to register 8.5% growth over the forecast period from 2023 to 2030.
The market growth is driven by an increasing integration of Artificial Intelligence (AI) and Machine Learning (ML) technologies is becoming a significant driver in the ARS market. These technologies enable more personalized and adaptive interactions with the audience. AI-driven features can automate certain aspects of engagement, such as suggesting relevant poll questions based on audience responses or providing personalized recommendations for content. Leading Companies focusing on Enhanced Virtual Reality (VR) Integration, Artificial Intelligence-Powered Personalization, Blockchain for Secure and Transparent Engagement, IoT Integration for Seamless Connectivity, Gamification for Increased Engagement, and others to boost market shares in the industry.
Market Overview
The Audience Response Software (ARS) market offers real-time interaction and engagement during events, presentations, and educational settings. Key features include live polling, Q&A sessions, and interactive quizzes, serving sectors such as corporate meetings, conferences, and education. Technology trends involve integration with virtual reality, artificial intelligence, and machine learning. ARS benefits include increased engagement, real-time feedback, and dynamic presentations. The competitive landscape includes established players and newer entrants, with competition centered on usability, integration capabilities, and analytics depth. Challenges include seamless integration and addressing privacy concerns. The future outlook anticipates further integration with emerging technologies and an emphasis on personalization and analytics for inclusive and accessible interactive experiences.
Market Dynamics
Market Trends- Audience response software is essential for creating engaging and interactive presentations.
Audience response software is indispensable for fostering engaging presentations by enabling real-time interaction through features like live polling and quizzes. This technology enhances audience participation in corporate, educational, and event settings, offering immediate feedback to presenters for dynamic content adjustments. Particularly valuable in virtual and hybrid events, audience response software ensures active involvement from both on-site and remote participants, making it a strategic tool for organizations seeking to create impactful and tailored presentations.
Market Driver- The growing popularity of hybrid and virtual events is driving demand for audience response software.
The surge in hybrid and virtual events is a major catalyst for the escalating demand in the audience response software market. As organizations adopt adaptable event structures that integrate both in-person and virtual components, the necessity for efficient audience engagement tools becomes paramount. Audience response software assumes a crucial role in fostering interaction and active participation in virtual environments, offering functionalities such as live polling, surveys, and Q&A sessions. Beyond just facilitating real-time engagement, this technology furnishes event organizers with valuable insights into participant preferences and feedback. Acknowledging the pivotal role of audience response software in augmenting the virtual event experience, businesses and event planners are increasingly integrating these solutions to ensure lively and interactive engagements for attendees, whether they are on-site or participating remotely.
Market Opportunity- Audience response software is increasingly being integrated with other technologies to enhance its functionality and versatility.
The integration of audience response software with various technologies is a central trend, enhancing its versatility and functionality. In the evolution of audience response software, seamless integration with a diverse range of technologies becomes essential for broadening its capabilities. This integration spans across different platforms, including event management systems, video conferencing tools, and Learning Management Systems (LMS). By merging with these technologies, audience response software not only enhances the overall user experience but also streamlines processes, improving accessibility and user-friendliness. This collaborative synergy enables a more comprehensive and synchronized approach, ultimately elevating the impact of interactive presentations in environments like conferences, classrooms, and corporate meetings.
Market Share Analysis- Web-Based Audience Response Software Market will register the fastest growth
The Global Audience Response Software Market is analyzed across Web-Based, Installed, and others. Web-based is poised to register the fastest growth. The web-based audience response software market focuses on interactive engagement tools accessed through web browsers, providing features like live polling and real-time feedback. Known for accessibility and user-friendliness, these solutions cater to virtual and hybrid events, online education, and remote collaboration. Integration with other web-based platforms, security measures, and a competitive landscape based on ease of use are notable aspects. The market's growth is driven by the increasing demand for virtual events, and future trends may involve UI enhancements and deeper integration with emerging technologies.
Market Share Analysis- Enterprise held a significant market share in 2023
The Global Audience Response Software Market is analyzed across various Organizations including the Government, Education, Enterprise, Sports and Entertainment, and others. Of these, Enterprise held a significant market share in 2023. The enterprise audience response software market specializes in solutions tailored for large-scale corporate use, providing features like live polling and surveys for real-time engagement in meetings, conferences, and training sessions. These solutions emphasize scalability, integration with corporate systems, security, and customization to meet the unique needs of organizations. Key competitive factors include ease of integration, security features, and scalability. Future trends may involve advancements in analytics capabilities and increased integration with enterprise collaboration tools to enhance user experience for large audiences.
Audience Response Software Market News
Kokai, a groundbreaking media buying platform, has been launched by The Trade Desk, introducing the complete capabilities of AI to digital marketing.
Africa CDC Initiates Application Process for African Epidemic Service – Epidemiology Track Fellowship Program.
Audience Response Software Market Segmentation
By Type
By Application
- Government
- Education
- Enterprise
- Sports and Entertainment
- Others
By Operating System
- Windows
- Android
- iOS
- Others
By Pricing Model
- Free Trial
- One Time License
- Subscription
By Region
- North America (United States, Canada, Mexico)
- Europe (Germany, France, United Kingdom, Spain, Italy, Others)
- Asia Pacific (China, India, Japan, South Korea, Australia, Others)
- Latin America (Brazil, Argentina, Others)
- Middle East and Africa (Saudi Arabia, UAE, Kuwait, Other Middle East, South Africa, Nigeria, Other Africa)
Audience Response Software Market Companies
- Mentimeter (Sweden)
- Hubilo (India)
- Slido (Slovakia)
- Vevox (United Kingdom)
- Kahoot (Norway)
- MeetingPulse (United States)
- Quizizz (United States)
- Meridia Interactive Solutions (United States)
- Crowdpurr (United States)
- Audience (United States)
- DialogLoop (Canada)
- VoxVote (Netherlands)
*List not exhaustive
Audience Response Software Market Outlook 2023
1 Market Overview
1.1 Introduction to the Audience Response Software Market
1.2 Scope of the Study
1.3 Research Objective
1.3.1 Key Market Scope and Segments
1.3.2 Players Covered
1.3.3 Years Considered
2 Executive Summary
2.1 2023 Audience Response Software Industry- Market Statistics
3 Market Dynamics
3.1 Market Drivers
3.2 Market Challenges
3.3 Market Opportunities
3.4 Market Trends
4 Market Factor Analysis
4.1 Porter’s Five Forces
4.2 Market Entropy
4.2.1 Global Audience Response Software Market Companies with Area Served
4.2.2 Products Offerings Global Audience Response Software Market
5 COVID-19 Impact Analysis and Outlook Scenarios
5.1.1 Covid-19 Impact Analysis
5.1.2 Post-COVID-19 Scenario- Low Growth Case
5.1.3 Post-COVID-19 Scenario- Reference Growth Case
5.1.4 Post-COVID-19 Scenario- Low Growth Case
6 Global Audience Response Software Market Trends
6.1 Global Audience Response Software Revenue (USD Million) and CAGR (%) by Type (2018-2030)
6.2 Global Audience Response Software Revenue (USD Million) and CAGR (%) by Applications (2018-2030)
6.3 Global Audience Response Software Revenue (USD Million) and CAGR (%) by Regions (2018-2030)
7 Global Audience Response Software Market Revenue (USD Million) by Type, and Applications (2018-2022)
7.1 Global Audience Response Software Revenue (USD Million) by Type (2018-2022)
7.1.1 Global Audience Response Software Revenue (USD Million), Market Share (%) by Type (2018-2022)
7.2 Global Audience Response Software Revenue (USD Million) by Applications (2018-2022)
7.2.1 Global Audience Response Software Revenue (USD Million), Market Share (%) by Applications (2018-2022)
8 Global Audience Response Software Development Regional Status and Outlook
8.1 Global Audience Response Software Revenue (USD Million) By Regions (2018-2022)
8.2 North America Audience Response Software Revenue (USD Million) by Type, and Application (2018-2022)
8.2.1 North America Audience Response Software Revenue (USD Million) by Country (2018-2022)
8.2.2 North America Audience Response Software Revenue (USD Million) by Type (2018-2022)
8.2.3 North America Audience Response Software Revenue (USD Million) by Applications (2018-2022)
8.3 Europe Audience Response Software Revenue (USD Million), by Type, and Applications (USD Million) (2018-2022)
8.3.1 Europe Audience Response Software Revenue (USD Million), by Country (2018-2022)
8.3.2 Europe Audience Response Software Revenue (USD Million) by Type (2018-2022)
8.3.3 Europe Audience Response Software Revenue (USD Million) by Applications (2018-2022)
8.4 Asia Pacific Audience Response Software Revenue (USD Million), and Revenue (USD Million) by Type, and Applications (2018-2022)
8.4.1 Asia Pacific Audience Response Software Revenue (USD Million) by Country (2018-2022)
8.4.2 Asia Pacific Audience Response Software Revenue (USD Million) by Type (2018-2022)
8.4.3 Asia Pacific Audience Response Software Revenue (USD Million) by Applications (2018-2022)
8.5 South America Audience Response Software Revenue (USD Million), by Type, and Applications (2018-2022)
8.5.1 South America Audience Response Software Revenue (USD Million), by Country (2018-2022)
8.5.2 South America Audience Response Software Revenue (USD Million) by Type (2018-2022)
8.5.3 South America Audience Response Software Revenue (USD Million) by Applications (2018-2022)
8.6 Middle East and Africa Audience Response Software Revenue (USD Million), by Type, Technology, Application, Thickness (2018-2022)
8.6.1 Middle East and Africa Audience Response Software Revenue (USD Million) by Country (2018-2022)
8.6.2 Middle East and Africa Audience Response Software Revenue (USD Million) by Type (2018-2022)
8.6.3 Middle East and Africa Audience Response Software Revenue (USD Million) by Applications (2018-2022)
9 Company Profiles
10 Global Audience Response Software Market Revenue (USD Million), by Type, and Applications (2023-2030)
10.1 Global Audience Response Software Revenue (USD Million) and Market Share (%) by Type (2023-2030)
10.1.1 Global Audience Response Software Revenue (USD Million), and Market Share (%) by Type (2023-2030)
10.2 Global Audience Response Software Revenue (USD Million) and Market Share (%) by Applications (2023-2030)
10.2.1 Global Audience Response Software Revenue (USD Million), and Market Share (%) by Applications (2023-2030)
11 Global Audience Response Software Development Regional Status and Outlook Forecast
11.1 Global Audience Response Software Revenue (USD Million) By Regions (2023-2030)
11.2 North America Audience Response Software Revenue (USD Million) by Type, and Applications (2023-2030)
11.2.1 North America Audience Response Software Revenue (USD) Million by Country (2023-2030)
11.2.2 North America Audience Response Software Revenue (USD Million), by Type (2023-2030)
11.2.3 North America Audience Response Software Revenue (USD Million), Market Share (%) by Applications (2023-2030)
11.3 Europe Audience Response Software Revenue (USD Million), by Type, and Applications (2023-2030)
11.3.1 Europe Audience Response Software Revenue (USD Million), by Country (2023-2030)
11.3.2 Europe Audience Response Software Revenue (USD Million), by Type (2023-2030)
11.3.3 Europe Audience Response Software Revenue (USD Million), by Applications (2023-2030)
11.4 Asia Pacific Audience Response Software Revenue (USD Million) by Type, and Applications (2023-2030)
11.4.1 Asia Pacific Audience Response Software Revenue (USD Million), by Country (2023-2030)
11.4.2 Asia Pacific Audience Response Software Revenue (USD Million), by Type (2023-2030)
11.4.3 Asia Pacific Audience Response Software Revenue (USD Million), by Applications (2023-2030)
11.5 South America Audience Response Software Revenue (USD Million), by Type, and Applications (2023-2030)
11.5.1 South America Audience Response Software Revenue (USD Million), by Country (2023-2030)
11.5.2 South America Audience Response Software Revenue (USD Million), by Type (2023-2030)
11.5.3 South America Audience Response Software Revenue (USD Million), by Applications (2023-2030)
11.6 Middle East and Africa Audience Response Software Revenue (USD Million), by Type, and Applications (2023-2030)
11.6.1 Middle East and Africa Audience Response Software Revenue (USD Million), by Region (2023-2030)
11.6.2 Middle East and Africa Audience Response Software Revenue (USD Million), by Type (2023-2030)
11.6.3 Middle East and Africa Audience Response Software Revenue (USD Million), by Applications (2023-2030)
12 Methodology and Data Sources
12.1 Methodology/Research Approach
12.1.1 Research Programs/Design
12.1.2 Market Size Estimation
12.1.3 Market Breakdown and Data Triangulation
12.2 Data Sources
12.2.1 Secondary Sources
12.2.2 Primary Sources
12.3 Disclaimer
List of Tables
Table 1 Market Segmentation Analysis
Table 2 Global Audience Response Software Market Companies with Areas Served
Table 3 Products Offerings Global Audience Response Software Market
Table 4 Low Growth Scenario Forecasts
Table 5 Reference Case Growth Scenario
Table 6 High Growth Case Scenario
Table 7 Global Audience Response Software Revenue (USD Million) And CAGR (%) By Type (2018-2030)
Table 8 Global Audience Response Software Revenue (USD Million) And CAGR (%) By Applications (2018-2030)
Table 9 Global Audience Response Software Revenue (USD Million) And CAGR (%) By Regions (2018-2030)
Table 10 Global Audience Response Software Revenue (USD Million) By Type (2018-2022)
Table 11 Global Audience Response Software Revenue Market Share (%) By Type (2018-2022)
Table 12 Global Audience Response Software Revenue (USD Million) By Applications (2018-2022)
Table 13 Global Audience Response Software Revenue Market Share (%) By Applications (2018-2022)
Table 14 Global Audience Response Software Market Revenue (USD Million) By Regions (2018-2022)
Table 15 Global Audience Response Software Market Share (%) By Regions (2018-2022)
Table 16 North America Audience Response Software Revenue (USD Million) By Country (2018-2022)
Table 17 North America Audience Response Software Revenue (USD Million) By Type (2018-2022)
Table 18 North America Audience Response Software Revenue (USD Million) By Applications (2018-2022)
Table 19 Europe Audience Response Software Revenue (USD Million) By Country (2018-2022)
Table 20 Europe Audience Response Software Revenue (USD Million) By Type (2018-2022)
Table 21 Europe Audience Response Software Revenue (USD Million) By Applications (2018-2022)
Table 22 Asia Pacific Audience Response Software Revenue (USD Million) By Country (2018-2022)
Table 23 Asia Pacific Audience Response Software Revenue (USD Million) By Type (2018-2022)
Table 24 Asia Pacific Audience Response Software Revenue (USD Million) By Applications (2018-2022)
Table 25 South America Audience Response Software Revenue (USD Million) By Country (2018-2022)
Table 26 South America Audience Response Software Revenue (USD Million) By Type (2018-2022)
Table 27 South America Audience Response Software Revenue (USD Million) By Applications (2018-2022)
Table 28 Middle East and Africa Audience Response Software Revenue (USD Million) By Region (2018-2022)
Table 29 Middle East and Africa Audience Response Software Revenue (USD Million) By Type (2018-2022)
Table 30 Middle East and Africa Audience Response Software Revenue (USD Million) By Applications (2018-2022)
Table 31 Financial Analysis
Table 32 Global Audience Response Software Revenue (USD Million) By Type (2023-2030)
Table 33 Global Audience Response Software Revenue Market Share (%) By Type (2023-2030)
Table 34 Global Audience Response Software Revenue (USD Million) By Applications (2023-2030)
Table 35 Global Audience Response Software Revenue Market Share (%) By Applications (2023-2030)
Table 36 Global Audience Response Software Market Revenue (USD Million), And Revenue (USD Million) By Regions (2023-2030)
Table 37 North America Audience Response Software Revenue (USD)By Country (2023-2030)
Table 38 North America Audience Response Software Revenue (USD Million) By Type (2023-2030)
Table 39 North America Audience Response Software Revenue (USD Million) By Applications (2023-2030)
Table 40 Europe Audience Response Software Revenue (USD Million) By Country (2023-2030)
Table 41 Europe Audience Response Software Revenue (USD Million) By Type (2023-2030)
Table 42 Europe Audience Response Software Revenue (USD Million) By Applications (2023-2030)
Table 43 Asia Pacific Audience Response Software Revenue (USD Million) By Country (2023-2030)
Table 44 Asia Pacific Audience Response Software Revenue (USD Million) By Type (2023-2030)
Table 45 Asia Pacific Audience Response Software Revenue (USD Million) By Applications (2023-2030)
Table 46 South America Audience Response Software Revenue (USD Million) By Country (2023-2030)
Table 47 South America Audience Response Software Revenue (USD Million) By Type (2023-2030)
Table 48 South America Audience Response Software Revenue (USD Million) By Applications (2023-2030)
Table 49 Middle East and Africa Audience Response Software Revenue (USD Million) By Region (2023-2030)
Table 50 Middle East and Africa Audience Response Software Revenue (USD Million) By Region (2023-2030)
Table 51 Middle East and Africa Audience Response Software Revenue (USD Million) By Type (2023-2030)
Table 52 Middle East and Africa Audience Response Software Revenue (USD Million) By Applications (2023-2030)
Table 53 Research Programs/Design for This Report
Table 54 Key Data Information from Secondary Sources
Table 55 Key Data Information from Primary Sources
List of Figures
Figure 1 Market Scope
Figure 2 Porter’s Five Forces
Figure 3 Global Audience Response Software Revenue (USD Million) By Type (2018-2022)
Figure 4 Global Audience Response Software Revenue Market Share (%) By Type (2022)
Figure 5 Global Audience Response Software Revenue (USD Million) By Applications (2018-2022)
Figure 6 Global Audience Response Software Revenue Market Share (%) By Applications (2022)
Figure 7 Global Audience Response Software Market Revenue (USD Million) By Regions (2018-2022)
Figure 8 Global Audience Response Software Market Share (%) By Regions (2022)
Figure 9 North America Audience Response Software Revenue (USD Million) By Country (2018-2022)
Figure 10 North America Audience Response Software Revenue (USD Million) By Type (2018-2022)
Figure 11 North America Audience Response Software Revenue (USD Million) By Applications (2018-2022)
Figure 12 Europe Audience Response Software Revenue (USD Million) By Country (2018-2022)
Figure 13 Europe Audience Response Software Revenue (USD Million) By Type (2018-2022)
Figure 14 Europe Audience Response Software Revenue (USD Million) By Applications (2018-2022)
Figure 15 Asia Pacific Audience Response Software Revenue (USD Million) By Country (2018-2022)
Figure 16 Asia Pacific Audience Response Software Revenue (USD Million) By Type (2018-2022)
Figure 17 Asia Pacific Audience Response Software Revenue (USD Million) By Applications (2018-2022)
Figure 18 South America Audience Response Software Revenue (USD Million) By Country (2018-2022)
Figure 19 South America Audience Response Software Revenue (USD Million) By Type (2018-2022)
Figure 20 South America Audience Response Software Revenue (USD Million) By Applications (2018-2022)
Figure 21 Middle East and Africa Audience Response Software Revenue (USD Million) By Region (2018-2022)
Figure 22 Middle East and Africa Audience Response Software Revenue (USD Million) By Type (2018-2022)
Figure 23 Middle East and Africa Audience Response Software Revenue (USD Million) By Applications (2018-2022)
Figure 24 Global Audience Response Software Revenue (USD Million) By Type (2023-2030)
Figure 25 Global Audience Response Software Revenue Market Share (%) By Type (2030)
Figure 26 Global Audience Response Software Revenue (USD Million) By Applications (2023-2030)
Figure 27 Global Audience Response Software Revenue Market Share (%) By Applications (2030)
Figure 28 Global Audience Response Software Market Revenue (USD Million) By Regions (2023-2030)
Figure 29 North America Audience Response Software Revenue (USD Million) By Country (2023-2030)
Figure 30 North America Audience Response Software Revenue (USD Million) By Type (2023-2030)
Figure 31 North America Audience Response Software Revenue (USD Million) By Applications (2023-2030)
Figure 32 Europe Audience Response Software Revenue (USD Million) By Country (2023-2030)
Figure 33 Europe Audience Response Software Revenue (USD Million) By Type (2023-2030)
Figure 34 Europe Audience Response Software Revenue (USD Million) By Applications (2023-2030)
Figure 35 Asia Pacific Audience Response Software Revenue (USD Million) By Country (2023-2030)
Figure 36 Asia Pacific Audience Response Software Revenue (USD Million) By Type (2023-2030)
Figure 37 Asia Pacific Audience Response Software Revenue (USD Million) By Applications (2023-2030)
Figure 38 South America Audience Response Software Revenue (USD Million) By Country (2023-2030)
Figure 39 South America Audience Response Software Revenue (USD Million) By Type (2023-2030)
Figure 40 South America Audience Response Software Revenue (USD Million) By Applications (2023-2030)
Figure 41 Middle East and Africa Audience Response Software Revenue (USD Million) By Region (2023-2030)
Figure 42 Middle East and Africa Audience Response Software Revenue (USD Million) By Region (2023-2030)
Figure 43 Middle East and Africa Audience Response Software Revenue (USD Million) By Type (2023-2030)
Figure 44 Middle East and Africa Audience Response Software Revenue (USD Million) By Applications (2023-2030)
Figure 45 Bottom-Up and Top-Down Approaches For This Report
Figure 46 Data Triangulation
