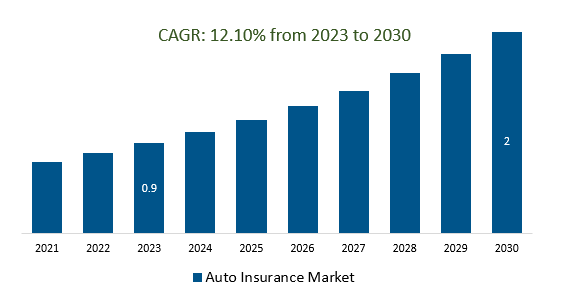
The global Auto Insurance Market Size is estimated to be US$ 0.9 Billion in 2023 and is poised to register 12.10% growth over the forecast period from 2023 to 2030 to reach US$ 2 Billion in 2030.
The market growth is driven predominantly by Insurers embracing digital channels for policy management, claims processing, and customer interactions, leading to improved customer experiences and streamlined operations personalization Insurers are leveraging data analytics to offer personalized coverage options, discounts, and policy recommendations based on individual driver profiles.
Market Overview
The Auto Insurance Market is vast and diverse. From private car owners market encompasses a wide array of stakeholders seeking coverage against accidents, theft, damage, and liability. This diversity is mirrored in the range of policies, features, and pricing options available, catering to the unique needs of different segments. The market is witnessing a rapid digital shift, with insurers leveraging technology to enhance customer experiences, streamline operations, and offer seamless online interactions. The convenience of digital platforms is reshaping customer expectations and pushing insurers to innovate.
Market Dynamics
Market Trends: Companies are launching Financial Security and Protection to attract a consumer base
Financial security and protection are the very essence of the insurance industry. Insurance policies, ranging from health and life insurance to property and casualty insurance, offer individuals and businesses financial coverage in case of unexpected events such as accidents, illnesses, natural disasters, and liability claims.
Further, Auto insurance coverage extends far beyond repair costs. It's a comprehensive shield that encompasses a range of scenarios, each tailored to meet the unique needs of policyholders such as Medical Payments Coverage, Collision Coverage, Liability Coverage, and other financial security and protection.
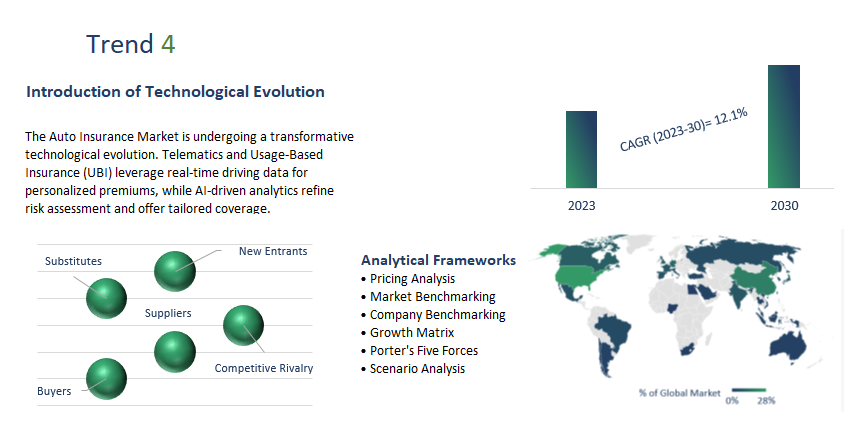
Market opportunity: Introduction of Technological Evolution
The Auto Insurance Market is undergoing a transformative technological evolution. Telematics and Usage-Based Insurance (UBI) leverage real-time driving data for personalized premiums, while AI-driven analytics refine risk assessment and offer tailored coverage. Claims processing becomes seamless through apps and chatbots, and blockchain enhances security and transparency. Connected vehicles enable predictive maintenance, promoting safer driving, and cybersecurity coverage addresses emerging
digital risks. This shift towards innovation ensures customer-centricity, redefining the industry's landscape and navigating the road ahead with enhanced efficiency and customization.
Market Segmentation
THIRD-PARTY LIABILITY COVERAGE: Third-party liability Coverage stands as a foundational pillar in the Auto Insurance Market, safeguarding policyholders from the financial repercussions of causing harm or damage to others. This coverage extends a protective shield beyond the driver's seat, offering peace of mind and adherence to legal obligations. As a cornerstone of responsible driving, Third-Party Liability Coverage ensures that when accidents occur, the burden of financial responsibility is shared, fostering a safer and more secure road environment.
Insurance Agents/Brokers: Insurance agents and brokers are pivotal in the Auto Insurance Market, serving as knowledgeable navigators through the complex realm of coverage options and policies. These professionals play a crucial role in bridging the gap between insurers and policyholders, offering expert advice, personalized solutions, and a deep understanding of the diverse needs of vehicle owners. Their expertise extends beyond mere transactions, encompassing risk assessment, policy customization, claims assistance, and ensuring policyholders receive optimal coverage tailored to their specific circumstances.
Commercial: In auto insurance emerges as a critical safeguard for businesses operating on wheels. This specialized coverage extends beyond personal vehicles, catering to a diverse array of commercial fleets, delivery trucks, and service vehicles. Commercial auto insurance provides a robust shield against potential liabilities, damages, and risks unique to business operations. It ensures that enterprises can carry out their activities confidently, knowing that their vehicles and drivers are protected in case of accidents, property damage, and unforeseen events. As businesses traverse the complex landscape of road risks, commercial auto insurance stands as a resilient partner, enabling them to navigate the road ahead with security and resilience.
Segmentation
By Coverage
By Distribution Channel
- Insurance Agents
- Direct Response
- Banks
- Others
By Vehicle Age
- New Vehicles
- Used Vehicles
By Application
By Region
- North America (United States, Canada, Mexico)
- Europe (Germany, France, United Kingdom, Spain, Italy, Others)
- Asia Pacific (China, India, Japan, South Korea, Australia, Others)
- Latin America (Brazil, Argentina, Others)
- Middle East and Africa (Saudi Arabia, UAE, Kuwait, Other Middle East, South Africa, Nigeria, Other Africa)
Key Players
Leading companies profiled in the study include-
- GEICO
- Tokio Marine Holdings
- Allianz SE
- State Farm Mutual
- China Pacific Insurance Company
- Admiral Group Plc
- Allstate Insurance Company
- Ping An Insurance Company of China, Ltd.
- Berkshire Hathaway Inc
- People's Insurance Company of China
Auto Insurance Systems Market Outlook 2023
1 Market Overview
1.1 Introduction to Auto Insurance Systems Market
1.2 Scope of the Study
1.3 Research Objective
1.3.1 Key Market Scope and Segments
1.3.2 Players Covered
1.3.3 Years Considered
2 Executive Summary
2.1 2023 Auto Insurance Systems Industry- Market Statistics
3 Market Dynamics
3.1 Market Drivers
3.2 Market Challenges
3.3 Market Opportunities
3.4 Market Trends
4 Market Factor Analysis
4.1 Porter’s Five Forces
4.2 Market Entropy
4.2.1 Global Auto Insurance Systems Market Companies with Area Served
4.2.2 Products Offerings Global Auto Insurance Systems Market
5 COVID-19 Impact Analysis and Outlook Scenarios
5.1.1 Covid-19 Impact Analysis
5.1.2 Post-COVID-19 Scenario- Low Growth Case
5.1.3 Post-COVID-19 Scenario- Reference Growth Case
5.1.4 Post-COVID-19 Scenario- Low Growth Case
6 Global Auto Insurance Systems Market Trends
6.1 Global Auto Insurance Systems Revenue (USD Million) and CAGR (%) by Type (2018-2030)
6.2 Global Auto Insurance Systems Revenue (USD Million) and CAGR (%) by Applications (2018-2030)
6.3 Global Auto Insurance Systems Revenue (USD Million) and CAGR (%) by Regions (2018-2030)
7 Global Auto Insurance Systems Market Revenue (USD Million) by Type, and Applications (2018-2022)
7.1 Global Auto Insurance Systems Revenue (USD Million) by Type (2018-2022)
7.1.1 Global Auto Insurance Systems Revenue (USD Million), Market Share (%) by Type (2018-2022)
7.2 Global Auto Insurance Systems Revenue (USD Million) by Applications (2018-2022)
7.2.1 Global Auto Insurance Systems Revenue (USD Million), Market Share (%) by Applications (2018-2022)
8 Global Auto Insurance Systems Development Regional Status and Outlook
8.1 Global Auto Insurance Systems Revenue (USD Million) By Regions (2018-2022)
8.2 North America Auto Insurance Systems Revenue (USD Million) by Type, and Application (2018-2022)
8.2.1 North America Auto Insurance Systems Revenue (USD Million) by Country (2018-2022)
8.2.2 North America Auto Insurance Systems Revenue (USD Million) by Type (2018-2022)
8.2.3 North America Auto Insurance Systems Revenue (USD Million) by Applications (2018-2022)
8.3 Europe Auto Insurance Systems Revenue (USD Million), by Type, and Applications (USD Million) (2018-2022)
8.3.1 Europe Auto Insurance Systems Revenue (USD Million), by Country (2018-2022)
8.3.2 Europe Auto Insurance Systems Revenue (USD Million) by Type (2018-2022)
8.3.3 Europe Auto Insurance Systems Revenue (USD Million) by Applications (2018-2022)
8.4 Asia Pacific Auto Insurance Systems Revenue (USD Million), and Revenue (USD Million) by Type, and Applications (2018-2022)
8.4.1 Asia Pacific Auto Insurance Systems Revenue (USD Million) by Country (2018-2022)
8.4.2 Asia Pacific Auto Insurance Systems Revenue (USD Million) by Type (2018-2022)
8.4.3 Asia Pacific Auto Insurance Systems Revenue (USD Million) by Applications (2018-2022)
8.5 South America Auto Insurance Systems Revenue (USD Million), by Type, and Applications (2018-2022)
8.5.1 South America Auto Insurance Systems Revenue (USD Million), by Country (2018-2022)
8.5.2 South America Auto Insurance Systems Revenue (USD Million) by Type (2018-2022)
8.5.3 South America Auto Insurance Systems Revenue (USD Million) by Applications (2018-2022)
8.6 Middle East and Africa Auto Insurance Systems Revenue (USD Million), by Type, Technology, Application, Thickness (2018-2022)
8.6.1 Middle East and Africa Auto Insurance Systems Revenue (USD Million) by Country (2018-2022)
8.6.2 Middle East and Africa Auto Insurance Systems Revenue (USD Million) by Type (2018-2022)
8.6.3 Middle East and Africa Auto Insurance Systems Revenue (USD Million) by Applications (2018-2022)
9 Company Profiles
10 Global Auto Insurance Systems Market Revenue (USD Million), by Type, and Applications (2023-2030)
10.1 Global Auto Insurance Systems Revenue (USD Million) and Market Share (%) by Type (2023-2030)
10.1.1 Global Auto Insurance Systems Revenue (USD Million), and Market Share (%) by Type (2023-2030)
10.2 Global Auto Insurance Systems Revenue (USD Million) and Market Share (%) by Applications (2023-2030)
10.2.1 Global Auto Insurance Systems Revenue (USD Million), and Market Share (%) by Applications (2023-2030)
11 Global Auto Insurance Systems Development Regional Status and Outlook Forecast
11.1 Global Auto Insurance Systems Revenue (USD Million) By Regions (2023-2030)
11.2 North America Auto Insurance Systems Revenue (USD Million) by Type, and Applications (2023-2030)
11.2.1 North America Auto Insurance Systems Revenue (USD) Million by Country (2023-2030)
11.2.2 North America Auto Insurance Systems Revenue (USD Million), by Type (2023-2030)
11.2.3 North America Auto Insurance Systems Revenue (USD Million), Market Share (%) by Applications (2023-2030)
11.3 Europe Auto Insurance Systems Revenue (USD Million), by Type, and Applications (2023-2030)
11.3.1 Europe Auto Insurance Systems Revenue (USD Million), by Country (2023-2030)
11.3.2 Europe Auto Insurance Systems Revenue (USD Million), by Type (2023-2030)
11.3.3 Europe Auto Insurance Systems Revenue (USD Million), by Applications (2023-2030)
11.4 Asia Pacific Auto Insurance Systems Revenue (USD Million) by Type, and Applications (2023-2030)
11.4.1 Asia Pacific Auto Insurance Systems Revenue (USD Million), by Country (2023-2030)
11.4.2 Asia Pacific Auto Insurance Systems Revenue (USD Million), by Type (2023-2030)
11.4.3 Asia Pacific Auto Insurance Systems Revenue (USD Million), by Applications (2023-2030)
11.5 South America Auto Insurance Systems Revenue (USD Million), by Type, and Applications (2023-2030)
11.5.1 South America Auto Insurance Systems Revenue (USD Million), by Country (2023-2030)
11.5.2 South America Auto Insurance Systems Revenue (USD Million), by Type (2023-2030)
11.5.3 South America Auto Insurance Systems Revenue (USD Million), by Applications (2023-2030)
11.6 Middle East and Africa Auto Insurance Systems Revenue (USD Million), by Type, and Applications (2023-2030)
11.6.1 Middle East and Africa Auto Insurance Systems Revenue (USD Million), by Region (2023-2030)
11.6.2 Middle East and Africa Auto Insurance Systems Revenue (USD Million), by Type (2023-2030)
11.6.3 Middle East and Africa Auto Insurance Systems Revenue (USD Million), by Applications (2023-2030)
12 Methodology and Data Sources
12.1 Methodology/Research Approach
12.1.1 Research Programs/Design
12.1.2 Market Size Estimation
12.1.3 Market Breakdown and Data Triangulation
12.2 Data Sources
12.2.1 Secondary Sources
12.2.2 Primary Sources
12.3 Disclaimer
List Of Tables
Table 1 Market Segmentation Analysis
Table 2 Global Auto Insurance Systems Market Companies with Areas Served
Table 3 Products Offerings Global Auto Insurance Systems Market
Table 4 Low Growth Scenario Forecasts
Table 5 Reference Case Growth Scenario
Table 6 High Growth Case Scenario
Table 7 Global Auto Insurance Systems Revenue (USD Million) And CAGR (%) By Type (2018-2030)
Table 8 Global Auto Insurance Systems Revenue (USD Million) And CAGR (%) By Applications (2018-2030)
Table 9 Global Auto Insurance Systems Revenue (USD Million) And CAGR (%) By Regions (2018-2030)
Table 10 Global Auto Insurance Systems Revenue (USD Million) By Type (2018-2022)
Table 11 Global Auto Insurance Systems Revenue Market Share (%) By Type (2018-2022)
Table 12 Global Auto Insurance Systems Revenue (USD Million) By Applications (2018-2022)
Table 13 Global Auto Insurance Systems Revenue Market Share (%) By Applications (2018-2022)
Table 14 Global Auto Insurance Systems Market Revenue (USD Million) By Regions (2018-2022)
Table 15 Global Auto Insurance Systems Market Share (%) By Regions (2018-2022)
Table 16 North America Auto Insurance Systems Revenue (USD Million) By Country (2018-2022)
Table 17 North America Auto Insurance Systems Revenue (USD Million) By Type (2018-2022)
Table 18 North America Auto Insurance Systems Revenue (USD Million) By Applications (2018-2022)
Table 19 Europe Auto Insurance Systems Revenue (USD Million) By Country (2018-2022)
Table 20 Europe Auto Insurance Systems Revenue (USD Million) By Type (2018-2022)
Table 21 Europe Auto Insurance Systems Revenue (USD Million) By Applications (2018-2022)
Table 22 Asia Pacific Auto Insurance Systems Revenue (USD Million) By Country (2018-2022)
Table 23 Asia Pacific Auto Insurance Systems Revenue (USD Million) By Type (2018-2022)
Table 24 Asia Pacific Auto Insurance Systems Revenue (USD Million) By Applications (2018-2022)
Table 25 South America Auto Insurance Systems Revenue (USD Million) By Country (2018-2022)
Table 26 South America Auto Insurance Systems Revenue (USD Million) By Type (2018-2022)
Table 27 South America Auto Insurance Systems Revenue (USD Million) By Applications (2018-2022)
Table 28 Middle East and Africa Auto Insurance Systems Revenue (USD Million) By Region (2018-2022)
Table 29 Middle East and Africa Auto Insurance Systems Revenue (USD Million) By Type (2018-2022)
Table 30 Middle East and Africa Auto Insurance Systems Revenue (USD Million) By Applications (2018-2022)
Table 31 Financial Analysis
Table 32 Global Auto Insurance Systems Revenue (USD Million) By Type (2023-2030)
Table 33 Global Auto Insurance Systems Revenue Market Share (%) By Type (2023-2030)
Table 34 Global Auto Insurance Systems Revenue (USD Million) By Applications (2023-2030)
Table 35 Global Auto Insurance Systems Revenue Market Share (%) By Applications (2023-2030)
Table 36 Global Auto Insurance Systems Market Revenue (USD Million), And Revenue (USD Million) By Regions (2023-2030)
Table 37 North America Auto Insurance Systems Revenue (USD)By Country (2023-2030)
Table 38 North America Auto Insurance Systems Revenue (USD Million) By Type (2023-2030)
Table 39 North America Auto Insurance Systems Revenue (USD Million) By Applications (2023-2030)
Table 40 Europe Auto Insurance Systems Revenue (USD Million) By Country (2023-2030)
Table 41 Europe Auto Insurance Systems Revenue (USD Million) By Type (2023-2030)
Table 42 Europe Auto Insurance Systems Revenue (USD Million) By Applications (2023-2030)
Table 43 Asia Pacific Auto Insurance Systems Revenue (USD Million) By Country (2023-2030)
Table 44 Asia Pacific Auto Insurance Systems Revenue (USD Million) By Type (2023-2030)
Table 45 Asia Pacific Auto Insurance Systems Revenue (USD Million) By Applications (2023-2030)
Table 46 South America Auto Insurance Systems Revenue (USD Million) By Country (2023-2030)
Table 47 South America Auto Insurance Systems Revenue (USD Million) By Type (2023-2030)
Table 48 South America Auto Insurance Systems Revenue (USD Million) By Applications (2023-2030)
Table 49 Middle East and Africa Auto Insurance Systems Revenue (USD Million) By Region (2023-2030)
Table 50 Middle East and Africa Auto Insurance Systems Revenue (USD Million) By Region (2023-2030)
Table 51 Middle East and Africa Auto Insurance Systems Revenue (USD Million) By Type (2023-2030)
Table 52 Middle East and Africa Auto Insurance Systems Revenue (USD Million) By Applications (2023-2030)
Table 53 Research Programs/Design for This Report
Table 54 Key Data Information from Secondary Sources
Table 55 Key Data Information from Primary Sources
List Of Figures
Figure 1 Market Scope
Figure 2 Porter’s Five Forces
Figure 3 Global Auto Insurance Systems Revenue (USD Million) By Type (2018-2022)
Figure 4 Global Auto Insurance Systems Revenue Market Share (%) By Type (2022)
Figure 5 Global Auto Insurance Systems Revenue (USD Million) By Applications (2018-2022)
Figure 6 Global Auto Insurance Systems Revenue Market Share (%) By Applications (2022)
Figure 7 Global Auto Insurance Systems Market Revenue (USD Million) By Regions (2018-2022)
Figure 8 Global Auto Insurance Systems Market Share (%) By Regions (2022)
Figure 9 North America Auto Insurance Systems Revenue (USD Million) By Country (2018-2022)
Figure 10 North America Auto Insurance Systems Revenue (USD Million) By Type (2018-2022)
Figure 11 North America Auto Insurance Systems Revenue (USD Million) By Applications (2018-2022)
Figure 12 Europe Auto Insurance Systems Revenue (USD Million) By Country (2018-2022)
Figure 13 Europe Auto Insurance Systems Revenue (USD Million) By Type (2018-2022)
Figure 14 Europe Auto Insurance Systems Revenue (USD Million) By Applications (2018-2022)
Figure 15 Asia Pacific Auto Insurance Systems Revenue (USD Million) By Country (2018-2022)
Figure 16 Asia Pacific Auto Insurance Systems Revenue (USD Million) By Type (2018-2022)
Figure 17 Asia Pacific Auto Insurance Systems Revenue (USD Million) By Applications (2018-2022)
Figure 18 South America Auto Insurance Systems Revenue (USD Million) By Country (2018-2022)
Figure 19 South America Auto Insurance Systems Revenue (USD Million) By Type (2018-2022)
Figure 20 South America Auto Insurance Systems Revenue (USD Million) By Applications (2018-2022)
Figure 21 Middle East and Africa Auto Insurance Systems Revenue (USD Million) By Region (2018-2022)
Figure 22 Middle East and Africa Auto Insurance Systems Revenue (USD Million) By Type (2018-2022)
Figure 23 Middle East and Africa Auto Insurance Systems Revenue (USD Million) By Applications (2018-2022)
Figure 24 Global Auto Insurance Systems Revenue (USD Million) By Type (2023-2030)
Figure 25 Global Auto Insurance Systems Revenue Market Share (%) By Type (2030)
Figure 26 Global Auto Insurance Systems Revenue (USD Million) By Applications (2023-2030)
Figure 27 Global Auto Insurance Systems Revenue Market Share (%) By Applications (2030)
Figure 28 Global Auto Insurance Systems Market Revenue (USD Million) By Regions (2023-2030)
Figure 29 North America Auto Insurance Systems Revenue (USD Million) By Country (2023-2030)
Figure 30 North America Auto Insurance Systems Revenue (USD Million) By Type (2023-2030)
Figure 31 North America Auto Insurance Systems Revenue (USD Million) By Applications (2023-2030)
Figure 32 Europe Auto Insurance Systems Revenue (USD Million) By Country (2023-2030)
Figure 33 Europe Auto Insurance Systems Revenue (USD Million) By Type (2023-2030)
Figure 34 Europe Auto Insurance Systems Revenue (USD Million) By Applications (2023-2030)
Figure 35 Asia Pacific Auto Insurance Systems Revenue (USD Million) By Country (2023-2030)
Figure 36 Asia Pacific Auto Insurance Systems Revenue (USD Million) By Type (2023-2030)
Figure 37 Asia Pacific Auto Insurance Systems Revenue (USD Million) By Applications (2023-2030)
Figure 38 South America Auto Insurance Systems Revenue (USD Million) By Country (2023-2030)
Figure 39 South America Auto Insurance Systems Revenue (USD Million) By Type (2023-2030)
Figure 40 South America Auto Insurance Systems Revenue (USD Million) By Applications (2023-2030)
Figure 41 Middle East and Africa Auto Insurance Systems Revenue (USD Million) By Region (2023-2030)
Figure 42 Middle East and Africa Auto Insurance Systems Revenue (USD Million) By Region (2023-2030)
Figure 43 Middle East and Africa Auto Insurance Systems Revenue (USD Million) By Type (2023-2030)
Figure 44 Middle East and Africa Auto Insurance Systems Revenue (USD Million) By Applications (2023-2030)
Figure 45 Bottom-Up and Top-Down Approaches For This Report
Figure 46 Data Triangulation
