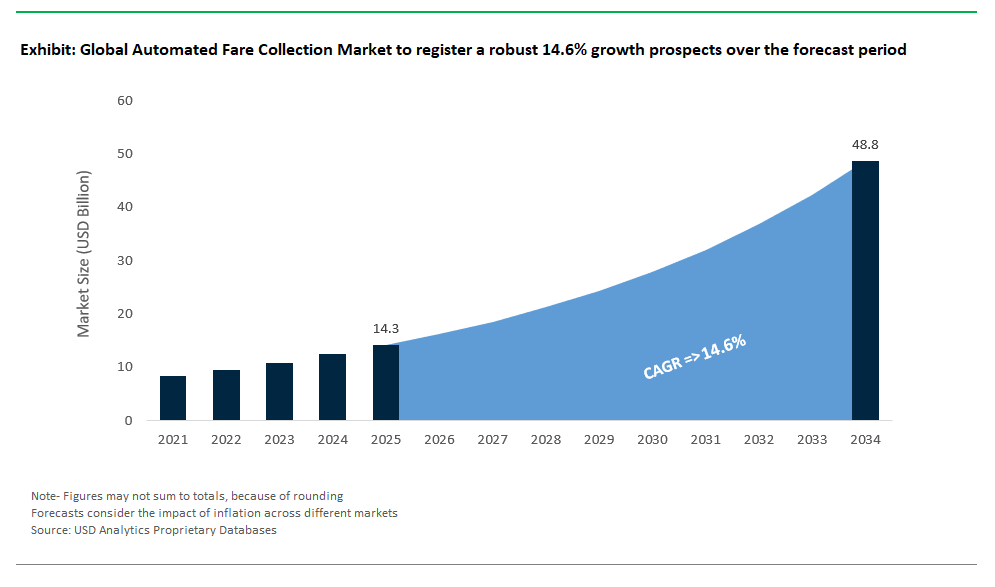
The Global Automated Fare Collection Market Size is estimated at $14.3 Billion in 2025 and is forecast to register an annual growth rate (CAGR) of 14.6% to reach $48.8 Billion by 2034.
The global Automated Fare Collection Market Study analyzes and forecasts the market size across 6 regions and 24 countries for diverse segments -By Component (Hardware, Software), By Technology (Smart Card, Magnetic Stripe, Near-field communication (NFC), Optical Character Recognition (OCR)), By System (Ticket Vending Machine (TVM), Ticket Office Machine (TOM), Fare Gates, IC Cards), By Application (Railways & Transportation, Parking, Entertainment, Others).
An Introduction to Automated Fare Collection Market in 2025
The automated fare collection (AFC) market is rapidly advancing as public transportation systems globally seek to enhance efficiency, convenience, and security for passengers. AFC systems use technology such as contactless cards, mobile payments, and biometric verification to streamline the ticketing process, reduce operational costs, and improve user experience. The market is driven by the increasing adoption of smart city initiatives, advancements in payment technology, and the need for more efficient and user-friendly transit solutions. With a focus on reducing fare evasion, minimizing queuing times, and integrating multi-modal transport options, the AFC market is poised for growth, supported by innovations in digital payments and automated systems.
Automated Fare Collection Competitive Landscape
The market report analyses the leading companies in the industry including Advanced Card Systems Ltd, Atos SE, Cubic Transportation Systems, GMV, Indra Sistemas SA, LECIP Holdings Corp, LG Corp, Masabi Ltd, Nippon Signal, Omron Corp, Samsung SDS Co. Ltd, Scheidt & Bachmann GmbH, Siemens AG, Thales Group, and others.
Automated Fare Collection Market Dynamics
Market Trend: Adoption of Contactless Payment Solutions
A prominent trend in the Automated Fare Collection (AFC) market is the widespread adoption of contactless payment solutions. This trend is driven by the increasing demand for seamless and hygienic payment options, particularly in the wake of the COVID-19 pandemic. Public transportation systems are integrating technologies such as Near Field Communication (NFC) and Radio Frequency Identification (RFID) to facilitate quick, secure, and touch-free transactions. These advancements are enhancing the passenger experience by reducing queues and streamlining fare collection processes, making public transit more efficient and user-friendly.
Market Driver: Rising Demand for Efficient Public Transportation Systems
The primary driver of the Automated Fare Collection market is the rising demand for more efficient and streamlined public transportation systems. As urban populations grow and public transit becomes a more critical component of city infrastructure, there is a pressing need for systems that can handle high volumes of passengers efficiently. Automated fare collection systems help address these needs by reducing manual processes, minimizing fare evasion, and improving overall operational efficiency. The push for smarter cities and enhanced public transport solutions continues to fuel investment and development in AFC technologies.
Market Opportunity: Expansion into Emerging Markets
A significant opportunity in the Automated Fare Collection market lies in expanding into emerging markets. Many developing regions are modernizing their public transportation infrastructure and are looking to implement advanced fare collection systems to improve efficiency and customer experience. This presents a lucrative opportunity for AFC technology providers to enter these markets and offer solutions tailored to local needs. By addressing specific challenges in emerging markets, such as lower technological infrastructure or budget constraints, companies can capture new growth areas and establish a foothold in these expanding economies.
Automated Fare Collection Market Share Analysis: Hardware generated the highest revenue in 2024
Hardware stands as the largest segment in the Automated Fare Collection (AFC) market by component due to its foundational role in the physical infrastructure required for fare collection systems. This segment includes various essential elements such as ticket vending machines, fare gates, card readers, and turnstiles, which are integral to the operation of automated fare collection systems. The physical hardware components are critical for enabling seamless transactions, managing fare collection, and ensuring the smooth operation of transit systems. The substantial investment in hardware infrastructure, driven by the need for reliable, durable, and secure components, supports its dominant position in the market. Additionally, the hardware segment benefits from ongoing technological advancements aimed at improving performance and user experience, further cementing its largest share in the AFC market.
Automated Fare Collection Market Share Analysis: Near-field Communication (NFC) is poised to register the fastest CAGR over the forecast period
Near-field Communication (NFC) is the fastest growing segment in the Automated Fare Collection (AFC) market by technology due to its advanced capabilities and increasing adoption across various applications. NFC technology enables contactless transactions, allowing users to pay fares or access services simply by tapping their NFC-enabled cards or smartphones. This convenience, combined with enhanced security features and rapid transaction speeds, drives the growth of NFC technology in fare collection systems. The expansion of mobile payment solutions and the proliferation of NFC-enabled devices contribute to its rapid adoption. As cities and transit authorities seek to modernize fare collection systems and improve customer experience, NFC technology emerges as a preferred choice, making it the fastest growing segment in the AFC market.
Automated Fare Collection Market Share Analysis: Ticket Vending Machine (TVM) generated the highest revenue in 2024
Ticket Vending Machine (TVM) is the largest segment in the Automated Fare Collection (AFC) market by system due to its widespread use and critical role in providing access to transportation services. TVMs are essential for issuing tickets, processing payments, and facilitating fare collection in various transit systems. They offer users the convenience of purchasing tickets on-site, reducing the need for manual ticketing processes and enhancing operational efficiency. The extensive deployment of TVMs in transit stations, metro systems, and other public transport facilities drives their dominance in the market. Their ability to handle multiple fare types, provide real-time transaction data, and integrate with other fare collection systems reinforces their position as the largest segment in the AFC market.
Automated Fare Collection Market Share Analysis: Railways & Transportation is poised to register the fastest CAGR over the forecast period
Railways & Transportation is the fastest growing segment in the Automated Fare Collection (AFC) market by application due to the rapid modernization and expansion of transit infrastructure worldwide. The increasing demand for efficient, automated fare collection systems in railways and public transportation drives this growth. Transit authorities are investing in advanced AFC solutions to streamline operations, enhance customer experience, and reduce operational costs. The need for integrated and scalable fare collection systems that can handle high volumes of transactions, support various payment methods, and provide real-time data contributes to the rapid growth of this segment. As urbanization and public transportation networks expand, the focus on modernizing fare collection systems in railways and transportation accelerates, making it the fastest growing application in the AFC market.
Automated Fare Collection Market Report Scope
|
Parameter
|
Details
|
|
Market Size (2025)
|
$ 14.3 Billion
|
|
Market Size (2034)
|
$ 48.8 Billion
|
|
Market Growth Rate
|
14.6%
|
|
Segments
|
By Component (Hardware, Software), By Technology (Smart Card, Magnetic Stripe, Near-field communication (NFC), Optical Character Recognition (OCR)), By System (Ticket Vending Machine (TVM), Ticket Office Machine (TOM), Fare Gates, IC Cards), By Application (Railways & Transportation, Parking, Entertainment, Others)
|
|
Study Period
|
2019- 2024 and 2025-2034
|
|
Units
|
Revenue (USD)
|
|
Qualitative Analysis
|
Porter’s Five Forces, SWOT Profile, Market Share, Scenario Forecasts, Market Ecosystem, Company Ranking, Market Dynamics, Industry Benchmarking
|
|
Companies
|
Advanced Card Systems Ltd, Atos SE, Cubic Transportation Systems, GMV, Indra Sistemas SA, LECIP Holdings Corp, LG Corp, Masabi Ltd, Nippon Signal, Omron Corp, Samsung SDS Co. Ltd, Scheidt & Bachmann GmbH, Siemens AG, Thales Group
|
|
Countries
|
US, Canada, Mexico, Germany, France, Spain, Italy, UK, Russia, China, India, Japan, South Korea, Australia, South East Asia, Brazil, Argentina, Middle East, Africa
|
Automated Fare Collection Market Segmentation
By Component
Hardware
Software
By Technology
Smart Card
Magnetic Stripe
Near-field communication (NFC)
Optical Character Recognition (OCR)
By System
Ticket Vending Machine (TVM)
Ticket Office Machine (TOM)
Fare Gates
IC Cards
By Application
Railways & Transportation
Parking
Entertainment
Others
Countries Analyzed
North America (US, Canada, Mexico)
Europe (Germany, UK, France, Spain, Italy, Russia, Rest of Europe)
Asia Pacific (China, India, Japan, South Korea, Australia, South East Asia, Rest of Asia)
South America (Brazil, Argentina, Rest of South America)
Middle East and Africa (Saudi Arabia, UAE, Rest of Middle East, South Africa, Egypt, Rest of Africa)
Automated Fare Collection Companies Profiled in the Study
Advanced Card Systems Ltd
Atos SE
Cubic Transportation Systems
GMV
Indra Sistemas SA
LECIP Holdings Corp
LG Corp
Masabi Ltd
Nippon Signal
Omron Corp
Samsung SDS Co. Ltd
Scheidt & Bachmann GmbH
Siemens AG
Thales Group
*- List Not Exhaustive
About USD Analytics
Table of Contents
List of Charts and Exhibits
List of Tables
1. Executive Summary
What’s New in 2025?
Top 10 Takeaways from the industry
Potential Opportunities for Industry Stakeholders
Strategic Imperatives
Company Market Positioning
Industry Benchmarking Matrix
2. Research Scope and Methodology
Market Definition
Market Segments
Companies Profiled
Research Methodology
Bottom-Up Method
Top-Down Method
Data Triangulation
Forecast Methodology
Data Sources
USDA Proprietary Databases
External Sources
Primary Research and Interviews
Conversion Rates for USD
Abbreviations
3. Strategic Landscape: Key Insights and Implications
Spotlight: Key Strategies opted by Business Leaders
Competitive Landscape
Market Size ($ Million) and Share (%) by Company, 2024
SWOT Analysis
- Key Market Strengths
- Key Market Weaknesses
- Potential Opportunities
- Potential Threats
Porter’s Five Force Analysis
- Summary
- Bargaining Power of Buyers- Impact Analysis
- Bargaining Power of Suppliers- Impact Analysis
- Threat of new entrants- Impact Analysis
- Intensity of Competitive Rivalry- Impact Analysis
Macro-Environmental Analysis
- Economic forecasts by Country, 2010- 2035
- Population forecasts by Country, 2010- 2035
- Inflation Outlook by Country, 2010-2035
- Impact of Russia-Ukraine Conflict, Sluggish China Growth, US Developments
5. Growth Opportunity Analysis
Trends at a Glance
- What are the most noteworthy trends in the market
- Where should leaders pay attention?
- What industries are likely to be affected by the growth?
Market Dynamics
- Charting a path forward
- Growth Drivers
- Growth Barriers
Key Industry Stakeholders
- Suppliers
- Manufacturers and Service Providers
- Distribution Channels
- End-Users and Applications
- Regulators
- Investors, Traders, and R&D Institutes
Regulatory Landscape
6. Market Size Outlook to 2034
Global Nanocoatings Market Size Forecast, USD Million, 2018- 2034
- Historic Market Size, 2018- 2024
- Forecast Market Size, 2024- 2034
Scenario Analysis
- Low Growth Scenario: Definition and Outlook to 2034
- Reference Case: Definition and Outlook to 2034
- High Growth Scenario: Definition and Outlook to 2034
Pricing Analysis and Outlook
- Nanocoatings Average Price Forecast, 2021- 2034
- Key Factors Shaping the Pricing Patterns
7. Historical Nanocoatings Market Size by Segments, 2018- 2024
Key Statistics, 2024
Nanocoatings Market Size Outlook by Type, USD Million, 2018- 2024
Growth Comparison (y-o-y) across Nanocoatings Types, 2018- 2024
Nanocoatings Market Size Outlook by Application, USD Million, 2018- 2024
Growth Comparison (y-o-y) across Nanocoatings Applications, 2018- 2024
8. Nanocoatings Market Size Outlook by Segments, 2024- 2034
By Component
Hardware
Software
By Technology
Smart Card
Magnetic Stripe
Near-field communication (NFC)
Optical Character Recognition (OCR)
By System
Ticket Vending Machine (TVM)
Ticket Office Machine (TOM)
Fare Gates
IC Cards
By Application
Railways & Transportation
Parking
Entertainment
Others
9. Nanocoatings Market Size Outlook by Region
North America
Key Market Dynamics
North America Nanocoatings Market Size Outlook by Type, USD Million, 2021-2034
North America Nanocoatings Market Size Outlook by Application, USD Million, 2021-2034
North America Nanocoatings Market Size Outlook by Sales Channel, USD Million, 2021-2034
North America Nanocoatings Market Size Outlook by Country, USD Million, 2021-2034
Europe
Key Market Dynamics
Europe Nanocoatings Market Size Outlook by Type, USD Million, 2021-2034
Europe Nanocoatings Market Size Outlook by Application, USD Million, 2021-2034
Europe Nanocoatings Market Size Outlook by Sales Channel, USD Million, 2021-2034
Europe Nanocoatings Market Size Outlook by Country, USD Million, 2021-2034
Asia Pacific
Key Market Dynamics
Asia Pacific Nanocoatings Market Size Outlook by Type, USD Million, 2021-2034
Asia Pacific Nanocoatings Market Size Outlook by Application, USD Million, 2021-2034
Asia Pacific Nanocoatings Market Size Outlook by Sales Channel, USD Million, 2021-2034
Asia Pacific Nanocoatings Market Size Outlook by Country, USD Million, 2021-2034
South America
Key Market Dynamics
South America Nanocoatings Market Size Outlook by Type, USD Million, 2021-2034
South America Nanocoatings Market Size Outlook by Application, USD Million, 2021-2034
South America Nanocoatings Market Size Outlook by Sales Channel, USD Million, 2021-2034
South America Nanocoatings Market Size Outlook by Country, USD Million, 2021-2034
Middle East and Africa
Key Market Dynamics
Middle East and Africa Nanocoatings Market Size Outlook by Type, USD Million, 2021-2034
Middle East and Africa Nanocoatings Market Size Outlook by Application, USD Million, 2021-2034
Middle East and Africa Nanocoatings Market Size Outlook by Sales Channel, USD Million, 2021-2034
Middle East and Africa Nanocoatings Market Size Outlook by Country, USD Million, 2021-2034
10. United States Nanocoatings Market Analysis and Outlook, 2021- 2034
Key Statistics
United States Nanocoatings Market Size Outlook by Type, 2021- 2034
United States Nanocoatings Market Size Outlook by Application, 2021- 2034
United States Nanocoatings Market Size Outlook by End-User, 2021- 2034
11. Canada Nanocoatings Market Analysis and Outlook, 2021- 2034
Key Statistics
Canada Nanocoatings Market Size Outlook by Type, 2021- 2034
Canada Nanocoatings Market Size Outlook by Application, 2021- 2034
Canada Nanocoatings Market Size Outlook by End-User, 2021- 2034
12. Mexico Nanocoatings Market Analysis and Outlook, 2021- 2034
Key Statistics
Mexico Nanocoatings Market Size Outlook by Type, 2021- 2034
Mexico Nanocoatings Market Size Outlook by Application, 2021- 2034
Mexico Nanocoatings Market Size Outlook by End-User, 2021- 2034
13. Germany Nanocoatings Market Analysis and Outlook, 2021- 2034
Key Statistics
Germany Nanocoatings Market Size Outlook by Type, 2021- 2034
Germany Nanocoatings Market Size Outlook by Application, 2021- 2034
Germany Nanocoatings Market Size Outlook by End-User, 2021- 2034
14. France Nanocoatings Market Analysis and Outlook, 2021- 2034
Key Statistics
France Nanocoatings Market Size Outlook by Type, 2021- 2034
France Nanocoatings Market Size Outlook by Application, 2021- 2034
France Nanocoatings Market Size Outlook by End-User, 2021- 2034
15. United Kingdom Nanocoatings Market Analysis and Outlook, 2021- 2034
Key Statistics
United Kingdom Nanocoatings Market Size Outlook by Type, 2021- 2034
United Kingdom Nanocoatings Market Size Outlook by Application, 2021- 2034
United Kingdom Nanocoatings Market Size Outlook by End-User, 2021- 2034
16. Spain Nanocoatings Market Analysis and Outlook, 2021- 2034
Key Statistics
Spain Nanocoatings Market Size Outlook by Type, 2021- 2034
Spain Nanocoatings Market Size Outlook by Application, 2021- 2034
Spain Nanocoatings Market Size Outlook by End-User, 2021- 2034
17. Italy Nanocoatings Market Analysis and Outlook, 2021- 2034
Key Statistics
Italy Nanocoatings Market Size Outlook by Type, 2021- 2034
Italy Nanocoatings Market Size Outlook by Application, 2021- 2034
Italy Nanocoatings Market Size Outlook by End-User, 2021- 2034
18. Benelux Nanocoatings Market Analysis and Outlook, 2021- 2034
Key Statistics
Benelux Nanocoatings Market Size Outlook by Type, 2021- 2034
Benelux Nanocoatings Market Size Outlook by Application, 2021- 2034
Benelux Nanocoatings Market Size Outlook by End-User, 2021- 2034
19. Nordic Nanocoatings Market Analysis and Outlook, 2021- 2034
Key Statistics
Nordic Nanocoatings Market Size Outlook by Type, 2021- 2034
Nordic Nanocoatings Market Size Outlook by Application, 2021- 2034
Nordic Nanocoatings Market Size Outlook by End-User, 2021- 2034
20. Rest of Europe Nanocoatings Market Analysis and Outlook, 2021- 2034
Key Statistics
Rest of Europe Nanocoatings Market Size Outlook by Type, 2021- 2034
Rest of Europe Nanocoatings Market Size Outlook by Application, 2021- 2034
Rest of Europe Nanocoatings Market Size Outlook by End-User, 2021- 2034
21. China Nanocoatings Market Analysis and Outlook, 2021- 2034
Key Statistics
China Nanocoatings Market Size Outlook by Type, 2021- 2034
China Nanocoatings Market Size Outlook by Application, 2021- 2034
China Nanocoatings Market Size Outlook by End-User, 2021- 2034
22. India Nanocoatings Market Analysis and Outlook, 2021- 2034
Key Statistics
India Nanocoatings Market Size Outlook by Type, 2021- 2034
India Nanocoatings Market Size Outlook by Application, 2021- 2034
India Nanocoatings Market Size Outlook by End-User, 2021- 2034
23. Japan Nanocoatings Market Analysis and Outlook, 2021- 2034
Key Statistics
Japan Nanocoatings Market Size Outlook by Type, 2021- 2034
Japan Nanocoatings Market Size Outlook by Application, 2021- 2034
Japan Nanocoatings Market Size Outlook by End-User, 2021- 2034
24. South Korea Nanocoatings Market Analysis and Outlook, 2021- 2034
Key Statistics
South Korea Nanocoatings Market Size Outlook by Type, 2021- 2034
South Korea Nanocoatings Market Size Outlook by Application, 2021- 2034
South Korea Nanocoatings Market Size Outlook by End-User, 2021- 2034
25. Australia Nanocoatings Market Analysis and Outlook, 2021- 2034
Key Statistics
Australia Nanocoatings Market Size Outlook by Type, 2021- 2034
Australia Nanocoatings Market Size Outlook by Application, 2021- 2034
Australia Nanocoatings Market Size Outlook by End-User, 2021- 2034
26. South East Asia Nanocoatings Market Analysis and Outlook, 2021- 2034
Key Statistics
South East Asia Nanocoatings Market Size Outlook by Type, 2021- 2034
South East Asia Nanocoatings Market Size Outlook by Application, 2021- 2034
South East Asia Nanocoatings Market Size Outlook by End-User, 2021- 2034
27. Rest of Asia Pacific Nanocoatings Market Analysis and Outlook, 2021- 2034
Key Statistics
Rest of Asia Pacific Nanocoatings Market Size Outlook by Type, 2021- 2034
Rest of Asia Pacific Nanocoatings Market Size Outlook by Application, 2021- 2034
Rest of Asia Pacific Nanocoatings Market Size Outlook by End-User, 2021- 2034
28. Brazil Nanocoatings Market Analysis and Outlook, 2021- 2034
Key Statistics
Brazil Nanocoatings Market Size Outlook by Type, 2021- 2034
Brazil Nanocoatings Market Size Outlook by Application, 2021- 2034
Brazil Nanocoatings Market Size Outlook by End-User, 2021- 2034
29. Argentina Nanocoatings Market Analysis and Outlook, 2021- 2034
Key Statistics
Argentina Nanocoatings Market Size Outlook by Type, 2021- 2034
Argentina Nanocoatings Market Size Outlook by Application, 2021- 2034
Argentina Nanocoatings Market Size Outlook by End-User, 2021- 2034
30. Rest of South America Nanocoatings Market Analysis and Outlook, 2021- 2034
Key Statistics
Rest of South America Nanocoatings Market Size Outlook by Type, 2021- 2034
Rest of South America Nanocoatings Market Size Outlook by Application, 2021- 2034
Rest of South America Nanocoatings Market Size Outlook by End-User, 2021- 2034
31. United Arab Emirates Nanocoatings Market Analysis and Outlook, 2021- 2034
Key Statistics
United Arab Emirates Nanocoatings Market Size Outlook by Type, 2021- 2034
United Arab Emirates Nanocoatings Market Size Outlook by Application, 2021- 2034
United Arab Emirates Nanocoatings Market Size Outlook by End-User, 2021- 2034
32. Saudi Arabia Nanocoatings Market Analysis and Outlook, 2021- 2034
Key Statistics
Saudi Arabia Nanocoatings Market Size Outlook by Type, 2021- 2034
Saudi Arabia Nanocoatings Market Size Outlook by Application, 2021- 2034
Saudi Arabia Nanocoatings Market Size Outlook by End-User, 2021- 2034
33. Rest of Middle East Nanocoatings Market Analysis and Outlook, 2021- 2034
Key Statistics
Rest of Middle East Nanocoatings Market Size Outlook by Type, 2021- 2034
Rest of Middle East Nanocoatings Market Size Outlook by Application, 2021- 2034
Rest of Middle East Nanocoatings Market Size Outlook by End-User, 2021- 2034
34. South Africa Nanocoatings Market Analysis and Outlook, 2021- 2034
Key Statistics
South Africa Nanocoatings Market Size Outlook by Type, 2021- 2034
South Africa Nanocoatings Market Size Outlook by Application, 2021- 2034
South Africa Nanocoatings Market Size Outlook by End-User, 2021- 2034
35. Rest of Africa Nanocoatings Market Analysis and Outlook, 2021- 2034
Key Statistics
Rest of Africa Nanocoatings Market Size Outlook by Type, 2021- 2034
Rest of Africa Nanocoatings Market Size Outlook by Application, 2021- 2034
Rest of Africa Nanocoatings Market Size Outlook by End-User, 2021- 2034
36. Key Companies
Market Share Analysis
Advanced Card Systems Ltd
Atos SE
Cubic Transportation Systems
GMV
Indra Sistemas SA
LECIP Holdings Corp
LG Corp
Masabi Ltd
Nippon Signal
Omron Corp
Samsung SDS Co. Ltd
Scheidt & Bachmann GmbH
Siemens AG
Thales Group
Company Benchmarking
Financial Analysis
37. Recent Market Developments
38. Appendix
Looking Ahead
Research Methodology
Legal Disclaimer
