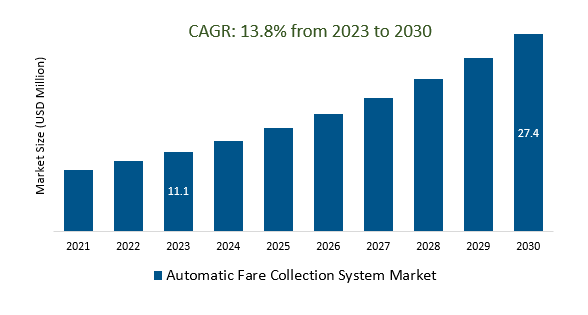
The Global Automatic Fare Collection System Market Size is estimated to be US 11.1 billion in 2023 and is poised to register 13.8% growth over the forecast period from 2023 to 2030 to reach US $ 27.4 billion in 2030.
The market growth is driven by the increase in environmental sustainability which has led to increased investment in public transportation systems, including AFC systems, as a means to reduce car usage and carbon emissions. Leading companies that are focused on Expansion in Emerging Markets, Contactless Payment Adoption, Enhanced Security and Biometrics, Smart Cities Initiatives, Sustainability Initiatives, Advanced Analytics and AI, Public-Private Partnerships, Cloud-Based Solutions, and others to boost market shares in the industry.
Market Overview
The Automatic Fare Collection (AFC) System Market involves automated fare collection technologies used in public transportation, including smart cards, mobile payments, and contactless methods, for efficient fare collection, access control, and revenue management. This market is driven by urbanization, contactless payment adoption, government initiatives, Mobility as a Service (MaaS) integration, and enhanced security measures. Key trends include MaaS integration, big data analytics, cloud-based solutions, sustainability initiatives, and interoperability. Major players include Thales Group, NXP Semiconductors, and Cubic Corporation, with regional variations in adoption.
Market Dynamics
Market Trends - Benefits of Maas Integration for Automatic Fare Collection Systems
Integrating Mobility as a Service (MaaS) with Automatic Fare Collection (AFC) Systems offers benefits such as a seamless travel experience for passengers, improved accessibility, reduced congestion, optimized transit services, increased ridership and revenue, personalized services, data-driven decision-making, cost savings, enhanced security, environmental benefits, tourism and economic advantages, and fostering innovation and competition in the transportation sector.
Market Driver- Big Data Analytics Demand Automatic Fare Collection System Market
Big Data analytics is in high demand in the Automatic Fare Collection (AFC) System Market due to its critical role in processing and analyzing large volumes of data generated by AFC systems. This analytics capability enables transit agencies to optimize operations, improve passenger experiences, and make data-driven decisions, making it a significant trend in the industry.
Market Opportunity-Introduction of Cloud-Based Solutions
Cloud-based solutions are increasingly popular in the Automatic Fare Collection (AFC) System Market, offering scalability, flexibility, and cost-efficiency by hosting AFC infrastructure and data in the cloud. These solutions simplify system maintenance, provide real-time monitoring, reduce on-site hardware needs, and are becoming a preferred choice for modern and efficient fare collection and management.
Market Share Analysis- Hardware Automatic Fare Collection System Market will register the fastest growth
The Global Automatic Fare Collection System Market is analyzed across Hardware, Software, and others. Hardware is poised to register the fastest growth. Hardware components in the Automatic Fare Collection System Market are essential for efficient fare collection and access control in public transportation. These components, including fare gates, ticket vending machines, card readers, and biometric devices, handle payment processing, ticket validation, and secure service access, underlining their pivotal role in ensuring the functionality and reliability of AFC systems within transit networks.
Market Share Analysis- Near-field communication (NFC) held a significant market share in 2023
The Global Automatic Fare Collection System Market is analyzed across various technologies, including Smart Cards, Magnetic Stripes, Near-field Communication (NFC), Optical Character Recognition (OCR), and others. Of these, Near-field communication (NFC) held a significant market share in 2023. Near-field communication (NFC) is a pivotal technology in the Automatic Fare Collection (AFC) System Market, allowing passengers to make contactless payments with smartphones or cards at fare gates and readers. NFC enhances convenience, reduces the need for physical tickets or cash, and offers improved security, contributing significantly to the adoption of contactless payment methods in public transportation.
Automatic Fare Collection System Market Segmentation
By Component
By Technology
- Smart Card
- Magnetic Stripe
- Near-field communication (NFC)
- Optical Character Recognition (OCR)
By System
- Ticket Vending Machine (TVM)
- Ticket Office Machine (TOM)
- Fare Gates
- IC Cards
By Application
- Railways & Transportation
- Parking
- Entertainment
- Others
By Region
- North America (United States, Canada, Mexico)
- Europe (Germany, France, United Kingdom, Spain, Italy, Others)
- Asia Pacific (China, India, Japan, South Korea, Australia, Others)
- Latin America (Brazil, Argentina, Others)
- Middle East and Africa (Saudi Arabia, UAE, Kuwait, Other Middle East, South Africa, Nigeria, Other Africa)
Automatic Fare Collection System Market Companies
- Cubic Transportation Systems
- Atos SE
- GMV
- Advanced Card Systems Ltd
- Indra Sistemas SA
- Samsung SDS Co. Ltd
- LG Corporation
- Siemens AG
- Thales Group
- Omron Corporation
- Masabi Ltd
- LECIP Holdings Corporation
- Scheidt & Bachmann GmbH
- Nippon Signal
*List not exhaustive
Automatic Fare Collection System Market Outlook 2023
1 Market Overview
1.1 Introduction to the Automatic Fare Collection System Market
1.2 Scope of the Study
1.3 Research Objective
1.3.1 Key Market Scope and Segments
1.3.2 Players Covered
1.3.3 Years Considered
2 Executive Summary
2.1 2023 Automatic Fare Collection System Industry- Market Statistics
3 Market Dynamics
3.1 Market Drivers
3.2 Market Challenges
3.3 Market Opportunities
3.4 Market Trends
4 Market Factor Analysis
4.1 Porter’s Five Forces
4.2 Market Entropy
4.2.1 Global Automatic Fare Collection System Market Companies with Area Served
4.2.2 Products Offerings Global Automatic Fare Collection System Market
5 COVID-19 Impact Analysis and Outlook Scenarios
5.1.1 Covid-19 Impact Analysis
5.1.2 post-COVID-19 Scenario- Low Growth Case
5.1.3 post-COVID-19 Scenario- Reference Growth Case
5.1.4 post-COVID-19 Scenario- Low Growth Case
6 Global Automatic Fare Collection System Market Trends
6.1 Global Automatic Fare Collection System Revenue (USD Million) and CAGR (%) by Type (2018-2030)
6.2 Global Automatic Fare Collection System Revenue (USD Million) and CAGR (%) by Applications (2018-2030)
6.3 Global Automatic Fare Collection System Revenue (USD Million) and CAGR (%) by regions (2018-2030)
7 Global Automatic Fare Collection System Market Revenue (USD Million) by Type, and Applications (2018-2022)
7.1 Global Automatic Fare Collection System Revenue (USD Million) by Type (2018-2022)
7.1.1 Global Automatic Fare Collection System Revenue (USD Million), Market Share (%) by Type (2018-2022)
7.2 Global Automatic Fare Collection System Revenue (USD Million) by Applications (2018-2022)
7.2.1 Global Automatic Fare Collection System Revenue (USD Million), Market Share (%) by Applications (2018-2022)
8 Global Automatic Fare Collection System Development Regional Status and Outlook
8.1 Global Automatic Fare Collection System Revenue (USD Million) By Regions (2018-2022)
8.2 North America Automatic Fare Collection System Revenue (USD Million) by Type, and Application (2018-2022)
8.2.1 North America Automatic Fare Collection System Revenue (USD Million) by Country (2018-2022)
8.2.2 North America Automatic Fare Collection System Revenue (USD Million) by Type (2018-2022)
8.2.3 North America Automatic Fare Collection System Revenue (USD Million) by Applications (2018-2022)
8.3 Europe Automatic Fare Collection System Revenue (USD Million), by Type, and Applications (USD Million) (2018-2022)
8.3.1 Europe Automatic Fare Collection System Revenue (USD Million), by Country (2018-2022)
8.3.2 Europe Automatic Fare Collection System Revenue (USD Million) by Type (2018-2022)
8.3.3 Europe Automatic Fare Collection System Revenue (USD Million) by Applications (2018-2022)
8.4 Asia Pacific Automatic Fare Collection System Revenue (USD Million), and Revenue (USD Million) by Type, and Applications (2018-2022)
8.4.1 Asia Pacific Automatic Fare Collection System Revenue (USD Million) by Country (2018-2022)
8.4.2 Asia Pacific Automatic Fare Collection System Revenue (USD Million) by Type (2018-2022)
8.4.3 Asia Pacific Automatic Fare Collection System Revenue (USD Million) by Applications (2018-2022)
8.5 South America Automatic Fare Collection System Revenue (USD Million), by Type, and Applications (2018-2022)
8.5.1 South America Automatic Fare Collection System Revenue (USD Million), by Country (2018-2022)
8.5.2 South America Automatic Fare Collection System Revenue (USD Million) by Type (2018-2022)
8.5.3 South America Automatic Fare Collection System Revenue (USD Million) by Applications (2018-2022)
8.6 Middle East and Africa Automatic Fare Collection System Revenue (USD Million), by Type, Technology, Application, Thickness (2018-2022)
8.6.1 Middle East and Africa Automatic Fare Collection System Revenue (USD Million) by Country (2018-2022)
8.6.2 Middle East and Africa Automatic Fare Collection System Revenue (USD Million) by Type (2018-2022)
8.6.3 Middle East and Africa Automatic Fare Collection System Revenue (USD Million) by Applications (2018-2022)
9 Company Profiles
10 Global Automatic Fare Collection System Market Revenue (USD Million), by Type, and Applications (2023-2030)
10.1 Global Automatic Fare Collection System Revenue (USD Million) and Market Share (%) by Type (2023-2030)
10.1.1 Global Automatic Fare Collection System Revenue (USD Million), and Market Share (%) by Type (2023-2030)
10.2 Global Automatic Fare Collection System Revenue (USD Million) and Market Share (%) by Applications (2023-2030)
10.2.1 Global Automatic Fare Collection System Revenue (USD Million), and Market Share (%) by Applications (2023-2030)
11 Global Automatic Fare Collection System Development Regional Status and Outlook Forecast
11.1 Global Automatic Fare Collection System Revenue (USD Million) By Regions (2023-2030)
11.2 North America Automatic Fare Collection System Revenue (USD Million) by Type, and Applications (2023-2030)
11.2.1 North America Automatic Fare Collection System Revenue (USD) Million by Country (2023-2030)
11.2.2 North America Automatic Fare Collection System Revenue (USD Million), by Type (2023-2030)
11.2.3 North America Automatic Fare Collection System Revenue (USD Million), Market Share (%) by Applications (2023-2030)
11.3 Europe Automatic Fare Collection System Revenue (USD Million), by Type, and Applications (2023-2030)
11.3.1 Europe Automatic Fare Collection System Revenue (USD Million), by Country (2023-2030)
11.3.2 Europe Automatic Fare Collection System Revenue (USD Million), by Type (2023-2030)
11.3.3 Europe Automatic Fare Collection System Revenue (USD Million), by Applications (2023-2030)
11.4 Asia Pacific Automatic Fare Collection System Revenue (USD Million) by Type, and Applications (2023-2030)
11.4.1 Asia Pacific Automatic Fare Collection System Revenue (USD Million), by Country (2023-2030)
11.4.2 Asia Pacific Automatic Fare Collection System Revenue (USD Million), by Type (2023-2030)
11.4.3 Asia Pacific Automatic Fare Collection System Revenue (USD Million), by Applications (2023-2030)
11.5 South America Automatic Fare Collection System Revenue (USD Million), by Type, and Applications (2023-2030)
11.5.1 South America Automatic Fare Collection System Revenue (USD Million), by Country (2023-2030)
11.5.2 South America Automatic Fare Collection System Revenue (USD Million), by Type (2023-2030)
11.5.3 South America Automatic Fare Collection System Revenue (USD Million), by Applications (2023-2030)
11.6 Middle East and Africa Automatic Fare Collection System Revenue (USD Million), by Type, and Applications (2023-2030)
11.6.1 Middle East and Africa Automatic Fare Collection System Revenue (USD Million), by region (2023-2030)
11.6.2 Middle East and Africa Automatic Fare Collection System Revenue (USD Million), by Type (2023-2030)
11.6.3 Middle East and Africa Automatic Fare Collection System Revenue (USD Million), by Applications (2023-2030)
12 Methodology and Data Sources
12.1 Methodology/Research Approach
12.1.1 Research Programs/Design
12.1.2 Market Size Estimation
12.1.3 Market Breakdown and Data Triangulation
12.2 Data Sources
12.2.1 Secondary Sources
12.2.2 Primary Sources
12.3 Disclaimer
List of Tables
Table 1 Market Segmentation Analysis
Table 2 Global Automatic Fare Collection System Market Companies with Areas Served
Table 3 Products Offerings Global Automatic Fare Collection System Market
Table 4 Low Growth Scenario Forecasts
Table 5 Reference Case Growth Scenario
Table 6 High Growth Case Scenario
Table 7 Global Automatic Fare Collection System Revenue (USD Million) And CAGR (%) By Type (2018-2030)
Table 8 Global Automatic Fare Collection System Revenue (USD Million) And CAGR (%) By Applications (2018-2030)
Table 9 Global Automatic Fare Collection System Revenue (USD Million) And CAGR (%) By Regions (2018-2030)
Table 10 Global Automatic Fare Collection System Revenue (USD Million) By Type (2018-2022)
Table 11 Global Automatic Fare Collection System Revenue Market Share (%) By Type (2018-2022)
Table 12 Global Automatic Fare Collection System Revenue (USD Million) By Applications (2018-2022)
Table 13 Global Automatic Fare Collection System Revenue Market Share (%) By Applications (2018-2022)
Table 14 Global Automatic Fare Collection System Market Revenue (USD Million) By Regions (2018-2022)
Table 15 Global Automatic Fare Collection System Market Share (%) By Regions (2018-2022)
Table 16 North America Automatic Fare Collection System Revenue (USD Million) By Country (2018-2022)
Table 17 North America Automatic Fare Collection System Revenue (USD Million) By Type (2018-2022)
Table 18 North America Automatic Fare Collection System Revenue (USD Million) By Applications (2018-2022)
Table 19 Europe Automatic Fare Collection System Revenue (USD Million) By Country (2018-2022)
Table 20 Europe Automatic Fare Collection System Revenue (USD Million) By Type (2018-2022)
Table 21 Europe Automatic Fare Collection System Revenue (USD Million) By Applications (2018-2022)
Table 22 Asia Pacific Automatic Fare Collection System Revenue (USD Million) By Country (2018-2022)
Table 23 Asia Pacific Automatic Fare Collection System Revenue (USD Million) By Type (2018-2022)
Table 24 Asia Pacific Automatic Fare Collection System Revenue (USD Million) By Applications (2018-2022)
Table 25 South America Automatic Fare Collection System Revenue (USD Million) By Country (2018-2022)
Table 26 South America Automatic Fare Collection System Revenue (USD Million) By Type (2018-2022)
Table 27 South America Automatic Fare Collection System Revenue (USD Million) By Applications (2018-2022)
Table 28 Middle East and Africa Automatic Fare Collection System Revenue (USD Million) By Region (2018-2022)
Table 29 Middle East and Africa Automatic Fare Collection System Revenue (USD Million) By Type (2018-2022)
Table 30 Middle East and Africa Automatic Fare Collection System Revenue (USD Million) By Applications (2018-2022)
Table 31 Financial Analysis
Table 32 Global Automatic Fare Collection System Revenue (USD Million) By Type (2023-2030)
Table 33 Global Automatic Fare Collection System Revenue Market Share (%) By Type (2023-2030)
Table 34 Global Automatic Fare Collection System Revenue (USD Million) By Applications (2023-2030)
Table 35 Global Automatic Fare Collection System Revenue Market Share (%) By Applications (2023-2030)
Table 36 Global Automatic Fare Collection System Market Revenue (USD Million), And Revenue (USD Million) By Regions (2023-2030)
Table 37 North America Automatic Fare Collection System Revenue (USD)By Country (2023-2030)
Table 38 North America Automatic Fare Collection System Revenue (USD Million) By Type (2023-2030)
Table 39 North America Automatic Fare Collection System Revenue (USD Million) By Applications (2023-2030)
Table 40 Europe Automatic Fare Collection System Revenue (USD Million) By Country (2023-2030)
Table 41 Europe Automatic Fare Collection System Revenue (USD Million) By Type (2023-2030)
Table 42 Europe Automatic Fare Collection System Revenue (USD Million) By Applications (2023-2030)
Table 43 Asia Pacific Automatic Fare Collection System Revenue (USD Million) By Country (2023-2030)
Table 44 Asia Pacific Automatic Fare Collection System Revenue (USD Million) By Type (2023-2030)
Table 45 Asia Pacific Automatic Fare Collection System Revenue (USD Million) By Applications (2023-2030)
Table 46 South America Automatic Fare Collection System Revenue (USD Million) By Country (2023-2030)
Table 47 South America Automatic Fare Collection System Revenue (USD Million) By Type (2023-2030)
Table 48 South America Automatic Fare Collection System Revenue (USD Million) By Applications (2023-2030)
Table 49 Middle East and Africa Automatic Fare Collection System Revenue (USD Million) By Region (2023-2030)
Table 50 Middle East and Africa Automatic Fare Collection System Revenue (USD Million) By Region (2023-2030)
Table 51 Middle East and Africa Automatic Fare Collection System Revenue (USD Million) By Type (2023-2030)
Table 52 Middle East and Africa Automatic Fare Collection System Revenue (USD Million) By Applications (2023-2030)
Table 53 Research Programs/Design for This Report
Table 54 Key Data Information from Secondary Sources
Table 55 Key Data Information from Primary Sources
List of Figures
Figure 1 Market Scope
Figure 2 Porter’s Five Forces
Figure 3 Global Automatic Fare Collection System Revenue (USD Million) By Type (2018-2022)
Figure 4 Global Automatic Fare Collection System Revenue Market Share (%) By Type (2022)
Figure 5 Global Automatic Fare Collection System Revenue (USD Million) By Applications (2018-2022)
Figure 6 Global Automatic Fare Collection System Revenue Market Share (%) By Applications (2022)
Figure 7 Global Automatic Fare Collection System Market Revenue (USD Million) By Regions (2018-2022)
Figure 8 Global Automatic Fare Collection System Market Share (%) By Regions (2022)
Figure 9 North America Automatic Fare Collection System Revenue (USD Million) By Country (2018-2022)
Figure 10 North America Automatic Fare Collection System Revenue (USD Million) By Type (2018-2022)
Figure 11 North America Automatic Fare Collection System Revenue (USD Million) By Applications (2018-2022)
Figure 12 Europe Automatic Fare Collection System Revenue (USD Million) By Country (2018-2022)
Figure 13 Europe Automatic Fare Collection System Revenue (USD Million) By Type (2018-2022)
Figure 14 Europe Automatic Fare Collection System Revenue (USD Million) By Applications (2018-2022)
Figure 15 Asia Pacific Automatic Fare Collection System Revenue (USD Million) By Country (2018-2022)
Figure 16 Asia Pacific Automatic Fare Collection System Revenue (USD Million) By Type (2018-2022)
Figure 17 Asia Pacific Automatic Fare Collection System Revenue (USD Million) By Applications (2018-2022)
Figure 18 South America Automatic Fare Collection System Revenue (USD Million) By Country (2018-2022)
Figure 19 South America Automatic Fare Collection System Revenue (USD Million) By Type (2018-2022)
Figure 20 South America Automatic Fare Collection System Revenue (USD Million) By Applications (2018-2022)
Figure 21 Middle East and Africa Automatic Fare Collection System Revenue (USD Million) By Region (2018-2022)
Figure 22 Middle East and Africa Automatic Fare Collection System Revenue (USD Million) By Type (2018-2022)
Figure 23 Middle East and Africa Automatic Fare Collection System Revenue (USD Million) By Applications (2018-2022)
Figure 24 Global Automatic Fare Collection System Revenue (USD Million) By Type (2023-2030)
Figure 25 Global Automatic Fare Collection System Revenue Market Share (%) By Type (2030)
Figure 26 Global Automatic Fare Collection System Revenue (USD Million) By Applications (2023-2030)
Figure 27 Global Automatic Fare Collection System Revenue Market Share (%) By Applications (2030)
Figure 28 Global Automatic Fare Collection System Market Revenue (USD Million) By Regions (2023-2030)
Figure 29 North America Automatic Fare Collection System Revenue (USD Million) By Country (2023-2030)
Figure 30 North America Automatic Fare Collection System Revenue (USD Million) By Type (2023-2030)
Figure 31 North America Automatic Fare Collection System Revenue (USD Million) By Applications (2023-2030)
Figure 32 Europe Automatic Fare Collection System Revenue (USD Million) By Country (2023-2030)
Figure 33 Europe Automatic Fare Collection System Revenue (USD Million) By Type (2023-2030)
Figure 34 Europe Automatic Fare Collection System Revenue (USD Million) By Applications (2023-2030)
Figure 35 Asia Pacific Automatic Fare Collection System Revenue (USD Million) By Country (2023-2030)
Figure 36 Asia Pacific Automatic Fare Collection System Revenue (USD Million) By Type (2023-2030)
Figure 37 Asia Pacific Automatic Fare Collection System Revenue (USD Million) By Applications (2023-2030)
Figure 38 South America Automatic Fare Collection System Revenue (USD Million) By Country (2023-2030)
Figure 39 South America Automatic Fare Collection System Revenue (USD Million) By Type (2023-2030)
Figure 40 South America Automatic Fare Collection System Revenue (USD Million) By Applications (2023-2030)
Figure 41 Middle East and Africa Automatic Fare Collection System Revenue (USD Million) By Region (2023-2030)
Figure 42 Middle East and Africa Automatic Fare Collection System Revenue (USD Million) By Region (2023-2030)
Figure 43 Middle East and Africa Automatic Fare Collection System Revenue (USD Million) By Type (2023-2030)
Figure 44 Middle East and Africa Automatic Fare Collection System Revenue (USD Million) By Applications (2023-2030)
Figure 45 Bottom-Up and Top-Down Approaches for This Report
Figure 46 Data Triangulation
