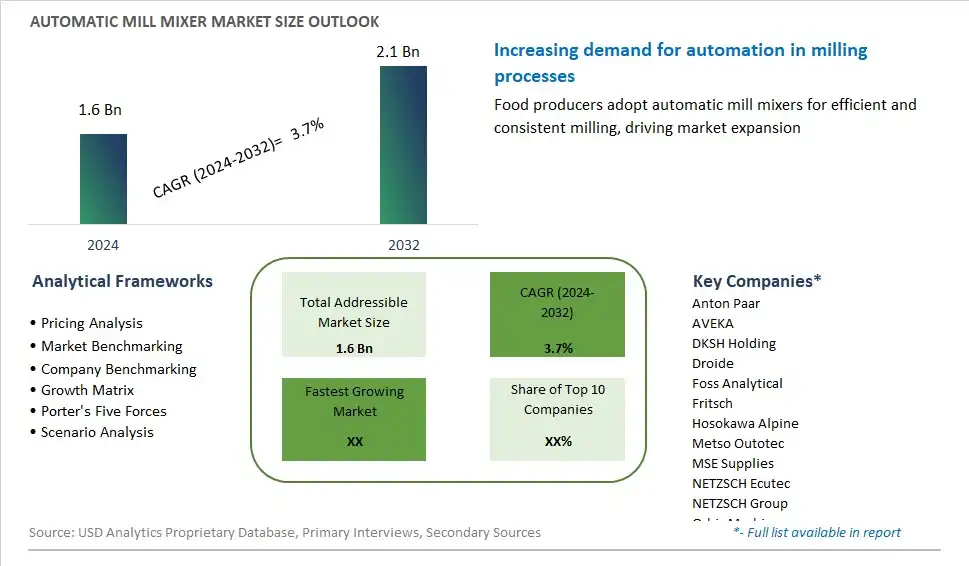
Global Automatic Mill Mixer Market Size is valued at $1.6 Billion in 2024 and is forecast to register a growth rate (CAGR) of 3.7% to reach $2.1 Billion by 2032.
The global Automatic Mill Mixer Market Comprehensive Study analyzes and forecasts the market size across 6 regions and 24 countries for diverse segments -By Type (Vertical, Horizontal), By Application (Biology, Chemistry, Agriculture, Medicine, Food, Others)
An Introduction to Automatic Mill Mixer Market
An automatic mill mixer is a machine used in the food and feed processing industries to blend and homogenize dry and semi-dry ingredients into uniform mixtures in 2024. This equipment automates the mixing process, saving time, labor, and energy while ensuring consistent product quality and batch-to-batch uniformity. Automatic mill mixers are commonly used in flour milling, feed manufacturing, and food processing operations to mix ingredients such as grains, flours, additives, and supplements to produce feeds, flours, premixes, and other blended products. They typically feature programmable controls, mixing chambers, and discharge mechanisms tailored to specific applications and production requirements. With increasing demand for processed foods, animal feeds, and specialty ingredients, the market for automatic mill mixers is expanding, driven by innovations in mixing technology, equipment design, and digitalization that improve efficiency, flexibility, and traceability in ingredient handling and product manufacturing processes.
Automatic Mill Mixer Competitive Landscape
The market report analyses the leading companies in the industry including Anton Paar, AVEKA, DKSH Holding, Droide, Foss Analytical, Fritsch, Hosokawa Alpine, Metso Outotec, MSE Supplies, NETZSCH Ecutec, NETZSCH Group, Orbis Machinery, Retsh, Royal Duyvis Wiener, SIEHE, Star Trace Private Ltd, Wuxi Lead Intelligent Equipment, and Others.
Automatic Mill Mixer Market Dynamics
Automatic Mill Mixer Market Trend: Integration of IoT and Automation in Milling Equipment
The market for automatic mill mixers is experiencing a prominent trend towards the integration of Internet of Things (IoT) technology and automation in milling equipment. Modern mill mixers are increasingly equipped with sensors, connectivity features, and automation capabilities to optimize the milling process. IoT-enabled mill mixers can monitor factors such as grain moisture levels, temperature, and equipment performance in real-time, allowing for precise control and adjustment of milling parameters. This trend is driven by the need for operational efficiency, data-driven decision-making, and the desire to reduce human error in milling operations. As a result, manufacturers are investing in R&D to develop advanced mill mixers that offer enhanced automation and connectivity features to meet the evolving needs of the milling industry.
Market Driver: Demand for Cost-effective and Efficient Milling Solutions
A significant driver of the automatic mill mixer market is the growing demand for cost-effective and efficient milling solutions in the food and feed processing industries. Mill mixers play a crucial role in grinding, mixing, and blending various grains and ingredients to produce feed pellets, flour, and other processed products. With increasing competition and pressure to optimize production costs, manufacturers are seeking automated solutions that can improve throughput, reduce energy consumption, and enhance product quality. Automatic mill mixers offer advantages such as consistent performance, precise control over milling parameters, and reduced labor requirements, making them increasingly attractive to milling facilities looking to enhance operational efficiency and competitiveness.
Market Opportunity: Expansion into Specialty Grain Processing and Customized Solutions
An opportunity for the automatic mill mixer market lies in expanding into specialty grain processing and offering customized solutions to meet specific customer needs. While automatic mill mixers are commonly used in large-scale grain milling operations, there is a growing demand for equipment capable of processing specialty grains such as organic, gluten-free, and ancient grains. Additionally, food and feed manufacturers may require customized milling solutions tailored to their unique processing requirements and product specifications. By developing versatile mill mixer models that can accommodate a wide range of grains and offering customization options such as adjustable milling parameters and interchangeable components, manufacturers can capitalize on niche markets and differentiate themselves from competitors.
Automatic Mill Mixer Market Share Analysis: Vertical held the dominant market share in 2024
The vertical segment dominates the automatic mill mixer market due to its widespread adoption across various industries and superior mixing capabilities. Vertical mill mixers feature a vertically oriented mixing chamber, allowing for efficient blending of dry and wet ingredients without the risk of material spillage or segregation. Their compact design, small footprint, and ease of operation make them suitable for both large-scale industrial applications and smaller manufacturing facilities. Additionally, vertical mill mixers offer versatility in handling a wide range of materials, including powders, granules, and liquids, making them indispensable in industries such as food processing, pharmaceuticals, and chemicals. The ability to achieve precise mixing ratios and homogeneity in the final product further contributes to the popularity of vertical mill mixers, consolidating their position as the largest segment in the automatic mill mixer market.
Automatic Mill Mixer Market Share Analysis: Agriculture market is poised to register the fastest growth rae over the forecast period to 2032
The agriculture segment is experiencing the fastest growth in the automatic mill mixer market due to the increasing mechanization and modernization of agricultural practices worldwide. Automatic mill mixers play a crucial role in the agricultural sector by facilitating the efficient blending of animal feed, fertilizers, pesticides, and other agricultural inputs. As farmers and agricultural enterprises seek to enhance productivity, optimize resource utilization, and improve the quality of agricultural products, the demand for automated mixing solutions in agriculture continues to surge. Further, advancements in precision agriculture and the integration of digital technologies in farming operations further drive the adoption of automatic mill mixers in agriculture. These machines enable farmers to customize feed formulations, ensure uniform nutrient distribution, and minimize feed wastage, contributing to improved livestock health and crop yields. Additionally, the growing focus on sustainable agriculture and environmental stewardship underscores the importance of precise mixing and dosage of agricultural inputs, propelling the growth of the agriculture segment in the automatic mill mixer market.
Automatic Mill Mixer Market Segmentation
By Type
Vertical
Horizontal
By Application
Biology
Chemistry
Agriculture
Medicine
Food
Others
Countries Analyzed
North America (US, Canada, Mexico)
Europe (Germany, UK, France, Spain, Italy, Russia, Rest of Europe)
Asia Pacific (China, India, Japan, South Korea, Australia, South East Asia, Rest of Asia)
South America (Brazil, Argentina, Rest of South America)
Middle East and Africa (Saudi Arabia, UAE, Rest of Middle East, South Africa, Egypt, Rest of Africa)
Automatic Mill Mixer Companies Profiled in the Study
Anton Paar
AVEKA
DKSH Holding
Droide
Foss Analytical
Fritsch
Hosokawa Alpine
Metso Outotec
MSE Supplies
NETZSCH Ecutec
NETZSCH Group
Orbis Machinery
Retsh
Royal Duyvis Wiener
SIEHE
Star Trace Private Ltd
Wuxi Lead Intelligent Equipment
*- List Not Exhaustive
Chapter 1. TABLE OF CONTENTS
Chapter 2. Introduction to Automatic Mill Mixer Market
2.1. Market Overview
2.2. Key Statistics and Report Highlights
2.3. Scope of the Comprehensive Study
2.3.1. Market Definition
2.3.2 Countries and Regions Covered
2.3.3 Research Objective
2.3.4 Units, Currency, and Conversions
2.3.5 Industry Value Chain
2.4. Key Market Segments
2.5. Key Companies
2.6. Study Period
Chapter 3. Strategic Analysis Review
3.1. Automatic Mill Mixer Pricing Analysis and Forecast
3.2. Porter’s Five Forces
3.3. Market Ecosystem
3.4. SWOT Analysis
3.5. Regulatory Scenario
3.3. Effects of Inflation, Russia-Ukraine War, moderating economic growth, and other macroeconomic factors
Chapter 4. Competitive Landscape
4.1. Market Share Analysis
4.1.1. Global Automatic Mill Mixer Market Share by Company, 2023
4.1.2. Product Offerings of Leading Automatic Mill Mixer Companies
4.2. Market Entropy
4.2.1. New Product Launches in the Industry
4.2.2. Mergers, Acquisitions, Joint ventures, and Partnerships
4.3. Key Strategies and Best Practices
Chapter 5. Global Market Projections: Best, Reference, and Low Case Scenarios
5.1. Growth Analysis- Case Scenario Definitions
5.2. Low Growth Case Scenario Forecasts
5.3. Reference Growth Case Scenario Forecasts
5.4. High Growth Case Scenario Forecasts
Chapter 6. Market Dynamics
6.1. Automatic Mill Mixer Market Drivers
6.2. Automatic Mill Mixer Market Challenges
6.6. Automatic Mill Mixer Market Opportunities
6.4. Automatic Mill Mixer Market Trends
Chapter 7. Global Automatic Mill Mixer Market Outlook Trends
7.1. Global Automatic Mill Mixer Revenue (USD Million) and CAGR (%) by Type (2021-2032)
7.2. Global Automatic Mill Mixer Revenue (USD Million) and CAGR (%) by Application (2021-2032)
7.3. Global Automatic Mill Mixer Revenue (USD Million) and CAGR (%) by Product (2021-2032)
By Type
Vertical
Horizontal
By Application
Biology
Chemistry
Agriculture
Medicine
Food
Others
Chapter 8. Global Automatic Mill Mixer Regional Analysis and Outlook
8.1. Global Automatic Mill Mixer Revenue (USD Million) By Regions (2021- 2032)
8.2. North America Automatic Mill Mixer Revenue (USD Million) by Country (2021-2032)
8.2.1. United States Automatic Mill Mixer Regional Analysis and Outlook
8.2.2. Canada Automatic Mill Mixer Regional Analysis and Outlook
8.2.3. Mexico Automatic Mill Mixer Regional Analysis and Outlook
8.3. Europe Automatic Mill Mixer Revenue (USD Million), by Country (2021-2032)
8.3.1. Germany Automatic Mill Mixer Regional Analysis and Outlook
8.3.2. France Automatic Mill Mixer Regional Analysis and Outlook
8.3.3. United Kingdom Automatic Mill Mixer Regional Analysis and Outlook
8.3.4. Spain Automatic Mill Mixer Regional Analysis and Outlook
8.3.5. Italy Automatic Mill Mixer Regional Analysis and Outlook
8.3.6. Russia Automatic Mill Mixer Regional Analysis and Outlook
8.3.7. Rest of Europe Automatic Mill Mixer Regional Analysis and Outlook
8.4. Asia Pacific Automatic Mill Mixer Revenue (USD Million) by Country (2021-2032)
8.4.1. China Automatic Mill Mixer Regional Analysis and Outlook
8.4.2. Japan Automatic Mill Mixer Regional Analysis and Outlook
8.4.3. India Automatic Mill Mixer Regional Analysis and Outlook
8.4.4. South Korea Automatic Mill Mixer Regional Analysis and Outlook
8.4.5. Australia Automatic Mill Mixer Regional Analysis and Outlook
8.4.6. South East Asia Automatic Mill Mixer Regional Analysis and Outlook
8.4.7. Rest of Asia Pacific Automatic Mill Mixer Regional Analysis and Outlook
8.5. South America Automatic Mill Mixer Revenue (USD Million), by Country (2021-2032)
8.5.1. Brazil Automatic Mill Mixer Regional Analysis and Outlook
8.5.2. Argentina Automatic Mill Mixer Regional Analysis and Outlook
8.5.3. Rest of South America Automatic Mill Mixer Regional Analysis and Outlook
8.6. Middle East and Africa Automatic Mill Mixer Revenue (USD Million) by Country (2021-2032)
8.6.1. Middle East Automatic Mill Mixer Regional Analysis and Outlook
8.6.2. Africa Automatic Mill Mixer Regional Analysis and Outlook
Chapter 9. North America Automatic Mill Mixer Analysis and Outlook
9.1. North America Automatic Mill Mixer Revenue (USD Million) by Segments (2021-2032)
9.1.1. North America Automatic Mill Mixer Revenue (USD Million) by Type (2021-2032)
9.1.2. North America Automatic Mill Mixer Revenue (USD Million) by Application (2021-2032)
9.1.3. North America Automatic Mill Mixer Revenue (USD Million) by Product (2021-2032)
By Type
Vertical
Horizontal
By Application
Biology
Chemistry
Agriculture
Medicine
Food
Others
Chapter 10. Europe Automatic Mill Mixer Analysis and Outlook
10.1. Europe Automatic Mill Mixer Revenue (USD Million), by Segments (USD Million) (2021-2032)
10.1.1. Europe Automatic Mill Mixer Revenue (USD Million) by Type (2021-2032)
10.1.2. Europe Automatic Mill Mixer Revenue (USD Million) by Application (2021-2032)
10.1.3. Europe Automatic Mill Mixer Revenue (USD Million) by Product (2021-2032)
By Type
Vertical
Horizontal
By Application
Biology
Chemistry
Agriculture
Medicine
Food
Others
Chapter 11. Asia Pacific Automatic Mill Mixer Analysis and Outlook
11.1. Asia Pacific Automatic Mill Mixer Revenue (USD Million), and Revenue (USD Million) by Segments (2021-2032)
11.1.1. Asia Pacific Automatic Mill Mixer Revenue (USD Million) by Type (2021-2032)
11.1.2. Asia Pacific Automatic Mill Mixer Revenue (USD Million) by Application (2021-2032)
11.1.3. Asia Pacific Automatic Mill Mixer Revenue (USD Million) by Product (2021-2032)
By Type
Vertical
Horizontal
By Application
Biology
Chemistry
Agriculture
Medicine
Food
Others
Chapter 12. South America Automatic Mill Mixer Analysis and Outlook
12.1. South America Automatic Mill Mixer Revenue (USD Million), by Segments (2021-2032)
12.1.1. South America Automatic Mill Mixer Revenue (USD Million) by Type (2021-2032)
12.1.2. South America Automatic Mill Mixer Revenue (USD Million) by Application (2021-2032)
12.1.3. South America Automatic Mill Mixer Revenue (USD Million) by Product (2021-2032)
By Type
Vertical
Horizontal
By Application
Biology
Chemistry
Agriculture
Medicine
Food
Others
Chapter 13. Middle East and Africa Automatic Mill Mixer Analysis and Outlook
13.1. Middle East and Africa Automatic Mill Mixer Revenue (USD Million), by Segments (2021-2032)
13.1.1. Middle East and Africa Automatic Mill Mixer Revenue (USD Million) by Type (2021-2032)
13.1.2. Middle East and Africa Automatic Mill Mixer Revenue (USD Million) by Application (2021-2032)
13.1.3. Middle East and Africa Automatic Mill Mixer Revenue (USD Million) by Product (2021-2032)
By Type
Vertical
Horizontal
By Application
Biology
Chemistry
Agriculture
Medicine
Food
Others
Chapter 14. Automatic Mill Mixer Company Profiles
14.1 Business Overview
14.2 Product Profiles
14.3 SWOT Profiles
14.5 Recent Developments
14.6 Financial Profile
List of Companies
Anton Paar
AVEKA
DKSH Holding
Droide
Foss Analytical
Fritsch
Hosokawa Alpine
Metso Outotec
MSE Supplies
NETZSCH Ecutec
NETZSCH Group
Orbis Machinery
Retsh
Royal Duyvis Wiener
SIEHE
Star Trace Private Ltd
Wuxi Lead Intelligent Equipment
15. Methodology and Data Sources
15.1 Customization Offerings
15.2 Subscription Services
15.3 Related Reports
15.4 Publisher Expertise
LIST OF TABLES
Table 1 Market Segmentation Analysis
Table 2 Global Automatic Mill Mixer Market Share of Leading Companies, 2023
Table 3 Product Offerings of Leading Companies
Table 4 Low Growth Scenario Forecasts
Table 5 Reference Case Growth Scenario
Table 6 High Growth Case Scenario
Table 7 Global Automatic Mill Mixer Revenue (USD Million) And CAGR (%) By Type (2021-2032)
Table 8 Global Automatic Mill Mixer Revenue (USD Million) And CAGR (%) By Application (2021-2032)
Table 9 Global Automatic Mill Mixer Revenue (USD Million) And CAGR (%) By Product (2021-2032)
Table 10 Global Automatic Mill Mixer Market Revenue (USD Million) By Regions (2021-2032)
Table 11 Global Automatic Mill Mixer Market Share (%) By Regions (2021-2032)
Table 12 North America Automatic Mill Mixer Revenue (USD Million) By Country (2021-2032)
Table 13 Europe Automatic Mill Mixer Revenue (USD Million) By Country (2021-2032)
Table 14 Asia Pacific Automatic Mill Mixer Revenue (USD Million) By Country (2021-2032)
Table 15 South America Automatic Mill Mixer Revenue (USD Million) By Country (2021-2032)
Table 16 Middle East and Africa Automatic Mill Mixer Revenue (USD Million) By Region (2021-2032)
Table 17 North America Automatic Mill Mixer Revenue (USD Million) By Type (2021-2032)
Table 18 North America Automatic Mill Mixer Revenue (USD Million) By Application (2021-2032)
Table 19 North America Automatic Mill Mixer Revenue (USD Million) By Product (2021-2032)
Table 20 Europe Automatic Mill Mixer Revenue (USD Million) By Type (2021-2032)
Table 21 Europe Automatic Mill Mixer Revenue (USD Million) By Application (2021-2032)
Table 22 Europe Automatic Mill Mixer Revenue (USD Million) By Product (2021-2032)
Table 23 Asia Pacific Automatic Mill Mixer Revenue (USD Million) By Type (2021-2032)
Table 24 Asia Pacific Automatic Mill Mixer Revenue (USD Million) By Application (2021-2032)
Table 25 Asia Pacific Automatic Mill Mixer Revenue (USD Million) By Product (2021-2032)
Table 26 South America Automatic Mill Mixer Revenue (USD Million) By Type (2021-2032)
Table 27 South America Automatic Mill Mixer Revenue (USD Million) By Application (2021-2032)
Table 28 South America Automatic Mill Mixer Revenue (USD Million) By Product (2021-2032)
Table 29 Middle East and Africa Automatic Mill Mixer Revenue (USD Million) By Type (2021-2032)
Table 30 Middle East and Africa Automatic Mill Mixer Revenue (USD Million) By Application (2021-2032)
Table 31 Middle East and Africa Automatic Mill Mixer Revenue (USD Million) By Product (2021-2032)
LIST OF FIGURES
Figure 1. Market Scope
Figure 2. Pricing Forecasts Per Unit, 2023- 2032
Figure 3. Porter’s Five Forces
Figure 4. Global Automatic Mill Mixer Market Revenue (USD Million) By Regions (2021-2032)
Figure 5. Global Automatic Mill Mixer Market Share (%) By Regions (2023)
Figure 6. North America Automatic Mill Mixer Revenue (USD Million) By Country (2021-2032)
Figure 7. United States Automatic Mill Mixer Revenue (USD Million) By Country (2021-2032)
Figure 8. Canada Automatic Mill Mixer Revenue (USD Million) By Country (2021-2032)
Figure 9. Mexico Automatic Mill Mixer Revenue (USD Million) By Country (2021-2032)
Figure 10. Europe Automatic Mill Mixer Revenue (USD Million) By Country (2021-2032)
Figure 11. Germany Automatic Mill Mixer Revenue (USD Million) By Country (2021-2032)
Figure 12. France Automatic Mill Mixer Revenue (USD Million) By Country (2021-2032)
Figure 13. United Kingdom Automatic Mill Mixer Revenue (USD Million) By Country (2021-2032)
Figure 14. Spain Automatic Mill Mixer Revenue (USD Million) By Country (2021-2032)
Figure 15. Italy Automatic Mill Mixer Revenue (USD Million) By Country (2021-2032)
Figure 16. Russia Automatic Mill Mixer Revenue (USD Million) By Country (2021-2032)
Figure 17. Rest of Europe Automatic Mill Mixer Revenue (USD Million) By Country (2021-2032)
Figure 11. Asia Pacific Automatic Mill Mixer Revenue (USD Million) By Country (2021-2032)
Figure 12. China Automatic Mill Mixer Revenue (USD Million) By Country (2021-2032)
Figure 13. Japan Automatic Mill Mixer Revenue (USD Million) By Country (2021-2032)
Figure 14. India Automatic Mill Mixer Revenue (USD Million) By Country (2021-2032)
Figure 15. South Korea Automatic Mill Mixer Revenue (USD Million) By Country (2021-2032)
Figure 16. Australia Automatic Mill Mixer Revenue (USD Million) By Country (2021-2032)
Figure 17. South East Asia Automatic Mill Mixer Revenue (USD Million) By Country (2021-2032)
Figure 18. South America Automatic Mill Mixer Revenue (USD Million) By Country (2021-2032)
Figure 19. Brazil Automatic Mill Mixer Revenue (USD Million) By Country (2021-2032)
Figure 20. Argentina Automatic Mill Mixer Revenue (USD Million) By Country (2021-2032)
Figure 21. Rest of Asia Pacific Automatic Mill Mixer Revenue (USD Million) By Country (2021-2032)
Figure 22. Middle East and Africa Automatic Mill Mixer Revenue (USD Million) By Region (2021-2032)
Figure 23. Saudi Arabia Automatic Mill Mixer Revenue (USD Million) By Region (2021-2032)
Figure 24. The UAE Automatic Mill Mixer Revenue (USD Million) By Region (2021-2032)
Figure 25. Rest of Middle East Automatic Mill Mixer Revenue (USD Million) By Region (2021-2032)
Figure 26. South Africa Automatic Mill Mixer Revenue (USD Million) By Region (2021-2032)
Figure 27. Africa Automatic Mill Mixer Revenue (USD Million) By Region (2021-2032)
Figure 28. North America Automatic Mill Mixer Revenue (USD Million) By Type (2021-2032)
Figure 29. North America Automatic Mill Mixer Revenue (USD Million) By Application (2021-2032)
Figure 30. North America Automatic Mill Mixer Revenue (USD Million) By Product (2021-2032)
Figure 31. Europe Automatic Mill Mixer Revenue (USD Million) By Type (2021-2032)
Figure 32. Europe Automatic Mill Mixer Revenue (USD Million) By Application (2021-2032)
Figure 33. Europe Automatic Mill Mixer Revenue (USD Million) By Product (2021-2032)
Figure 34. Asia Pacific Automatic Mill Mixer Revenue (USD Million) By Type (2021-2032)
Figure 35. Asia Pacific Automatic Mill Mixer Revenue (USD Million) By Application (2021-2032)
Figure 36. Asia Pacific Automatic Mill Mixer Revenue (USD Million) By Product (2021-2032)
Figure 37. South America Automatic Mill Mixer Revenue (USD Million) By Type (2021-2032)
Figure 38. South America Automatic Mill Mixer Revenue (USD Million) By Application (2021-2032)
Figure 39. South America Automatic Mill Mixer Revenue (USD Million) By Product (2021-2032)
Figure 40. Middle East and Africa Automatic Mill Mixer Revenue (USD Million) By Type (2021-2032)
Figure 41. Middle East and Africa Automatic Mill Mixer Revenue (USD Million) By Application (2021-2032)
Figure 42. Middle East and Africa Automatic Mill Mixer Revenue (USD Million) By Product (2021-2032)
By Type
Vertical
Horizontal
By Application
Biology
Chemistry
Agriculture
Medicine
Food
Others
Countries Analyzed
North America (US, Canada, Mexico)
Europe (Germany, UK, France, Spain, Italy, Russia, Rest of Europe)
Asia Pacific (China, India, Japan, South Korea, Australia, South East Asia, Rest of Asia)
South America (Brazil, Argentina, Rest of South America)
Middle East and Africa (Saudi Arabia, UAE, Rest of Middle East, South Africa, Egypt, Rest of Africa)
