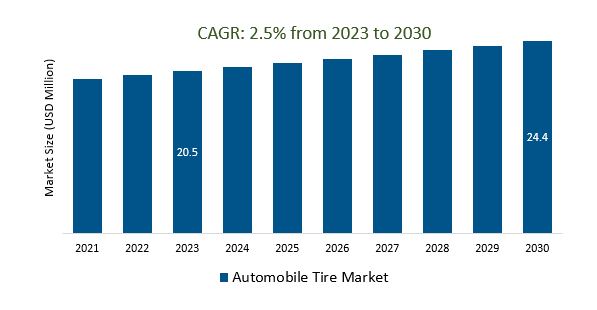
The Global Automobile Tire Market Size is estimated to register High CAGR over the forecast period from 2023 to 2030.
The market growth is driven by the increasing demand for winter and all-season tires remains strong, driven by safety concerns and changing weather patterns. Leading companies that are focused on Electric and Autonomous Vehicles, Smart and Connected Tires, 3D Printing, Airless Tires, Performance and Safety Innovations, Regulatory Changes, Climate Adaptation, and others to boost market shares in the industry.
Market Overview
The global automobile tire market is a mature but substantial industry, driven by vehicle production and the replacement market. Major players like Bridgestone, Michelin, and Goodyear compete in various segments, including passenger cars, light trucks, and commercial vehicles. Key trends include sustainability, technology integration with smart and connected tires, customization, online sales, and performance enhancement. Growth opportunities lie in emerging markets, advances in tire technology, and collaborations with automakers.
Market Dynamics
Market Trends - New Tire Materials
New materials in the automobile tire market include silica compounds for improved wet traction and fuel efficiency, guayule rubber as a sustainable alternative, nanotechnology-enhanced materials for strength and grip, bio-based materials like soybean oil and natural rubber, self-healing polymers, recycled materials, hybrid compounds with Kevlar or aramid fibers, sustainable reinforcements such as rayon, and 3D-printed tires, all aimed at enhancing tire performance, durability, and sustainability in response to evolving consumer and environmental demands.
Market Driver- Tire Recycling and Sustainability Demand Automobile Tire Market
The demand for sustainability and tire recycling in the automobile tire market is rising due to consumer and regulatory focus on eco-friendly practices. This trend is prompting innovations in recycling methods and sustainable tire materials, like bio-based compounds while driving the adoption of green certifications and eco-labeling. Tire manufacturers are increasingly prioritizing environmentally responsible practices, influencing the industry's sustainability efforts from production to disposal.
Market Opportunity-Introduction of Infrastructure Development
Infrastructure development is a crucial driver in the automobile tire market, as it leads to increased vehicle ownership, greater demand for tires, and improved road conditions, ultimately influencing the market's growth, particularly in emerging markets experiencing urbanization and transportation expansion.
Market Share Analysis- Radial Automobile Tire Market will register the fastest growth
The Global Automobile Tire Market is analyzed across Radial, Bias, and others. Radial is poised to register the fastest growth. Radial tires have revolutionized the automobile tire market by offering enhanced performance, traction, and durability compared to bias-ply tires. Their adoption has become standard for most passenger cars and light trucks, providing benefits such as improved stability, reduced rolling resistance, longer tread life, and increased overall vehicle efficiency and safety. Radial tire technology remains a fundamental and influential aspect of the modern automobile tire market, continually evolving with advancements in materials and technology.
Market Share Analysis- Passenger cars held a significant market share in 2023
The Global Automobile Tire Market is analyzed across various applications including Passenger cars, Light commercial vehicles, Heavy commercial vehicles, and others. Of these, Passenger cars held a significant market share in 2023. Passenger cars constitute a significant segment in the automobile tire market, encompassing a variety of vehicles from compact cars to luxury sedans and electric cars. These tires are engineered to deliver optimal performance, comfort, and safety for everyday driving, with diverse options in terms of size, type (summer, winter, all-season), and tread patterns. As global passenger car sales continue to rise, the demand for these tires remains strong, fueling tire industry innovations in design, materials, and technology to meet evolving consumer expectations for improved fuel efficiency, safety, and overall driving performance.
Automobile Tire Market Segmentation
By Type
By Application
- Passenger cars
- Light commercial vehicles
- Heavy commercial vehicles
- Others
By End User
By Region
- North America (United States, Canada, Mexico)
- Europe (Germany, France, United Kingdom, Spain, Italy, Others)
- Asia Pacific (China, India, Japan, South Korea, Australia, Others)
- Latin America (Brazil, Argentina, Others)
- Middle East and Africa (Saudi Arabia, UAE, Kuwait, Other Middle East, South Africa, Nigeria, Other Africa)
Automobile Tire Market companies
- CEAT Limited
- Sumitomo Rubber Industries, Ltd.
- Bridgestone Corporation
- Apollo Tyres Ltd
- MRF Limited
- Hankook & Company Co., Ltd.
- Michelin
- Nokian Tyres PLC
- Pirelli & C. S.p.A
- Toyo Tire Corporation
- Sailun Group Co., Ltd.
- JK Tyre & INDUSTRIES LTD.
- Shandong Linglong Group Co. Ltd.
- The Goodyear Tire & Rubber Company
- Zhongce Rubber Group Co., Ltd.
- Triangle Tire Co., Ltd.,
- The Yokohama Rubber Co., Ltd.
- Wanli Tire Co., Ltd.
- Salsons Impex Pvt. Ltd
- Continental AG
*List not exhaustive
Automobile Tire Market Outlook 2023
1 Market Overview
1.1 Introduction to the Automobile Tire Market
1.2 Scope of the Study
1.3 Research Objective
1.3.1 Key Market Scope and Segments
1.3.2 Players Covered
1.3.3 Years Considered
2 Executive Summary
2.1 2023 Automobile Tire Industry- Market Statistics
3 Market Dynamics
3.1 Market Drivers
3.2 Market Challenges
3.3 Market Opportunities
3.4 Market Trends
4 Market Factor Analysis
4.1 Porter’s Five Forces
4.2 Market Entropy
4.2.1 Global Automobile Tire Market Companies with Area Served
4.2.2 Products Offerings Global Automobile Tire Market
5 COVID-19 Impact Analysis and Outlook Scenarios
5.1.1 Covid-19 Impact Analysis
5.1.2 post-COVID-19 Scenario- Low Growth Case
5.1.3 post-COVID-19 Scenario- Reference Growth Case
5.1.4 post-COVID-19 Scenario- Low Growth Case
6 Global Automobile Tire Market Trends
6.1 Global Automobile Tire Revenue (USD Million) and CAGR (%) by Type (2018-2030)
6.2 Global Automobile Tire Revenue (USD Million) and CAGR (%) by Applications (2018-2030)
6.3 Global Automobile Tire Revenue (USD Million) and CAGR (%) by regions (2018-2030)
7 Global Automobile Tire Market Revenue (USD Million) by Type, and Applications (2018-2022)
7.1 Global Automobile Tire Revenue (USD Million) by Type (2018-2022)
7.1.1 Global Automobile Tire Revenue (USD Million), Market Share (%) by Type (2018-2022)
7.2 Global Automobile Tire Revenue (USD Million) by Applications (2018-2022)
7.2.1 Global Automobile Tire Revenue (USD Million), Market Share (%) by Applications (2018-2022)
8 Global Automobile Tire Development Regional Status and Outlook
8.1 Global Automobile Tire Revenue (USD Million) By Regions (2018-2022)
8.2 North America Automobile Tire Revenue (USD Million) by Type, and Application (2018-2022)
8.2.1 North America Automobile Tire Revenue (USD Million) by Country (2018-2022)
8.2.2 North America Automobile Tire Revenue (USD Million) by Type (2018-2022)
8.2.3 North America Automobile Tire Revenue (USD Million) by Applications (2018-2022)
8.3 Europe Automobile Tire Revenue (USD Million), by Type, and Applications (USD Million) (2018-2022)
8.3.1 Europe Automobile Tire Revenue (USD Million), by Country (2018-2022)
8.3.2 Europe Automobile Tire Revenue (USD Million) by Type (2018-2022)
8.3.3 Europe Automobile Tire Revenue (USD Million) by Applications (2018-2022)
8.4 Asia Pacific Automobile Tire Revenue (USD Million), and Revenue (USD Million) by Type, and Applications (2018-2022)
8.4.1 Asia Pacific Automobile Tire Revenue (USD Million) by Country (2018-2022)
8.4.2 Asia Pacific Automobile Tire Revenue (USD Million) by Type (2018-2022)
8.4.3 Asia Pacific Automobile Tire Revenue (USD Million) by Applications (2018-2022)
8.5 South America Automobile Tire Revenue (USD Million), by Type, and Applications (2018-2022)
8.5.1 South America Automobile Tire Revenue (USD Million), by Country (2018-2022)
8.5.2 South America Automobile Tire Revenue (USD Million) by Type (2018-2022)
8.5.3 South America Automobile Tire Revenue (USD Million) by Applications (2018-2022)
8.6 Middle East and Africa Automobile Tire Revenue (USD Million), by Type, Technology, Application, Thickness (2018-2022)
8.6.1 Middle East and Africa Automobile Tire Revenue (USD Million) by Country (2018-2022)
8.6.2 Middle East and Africa Automobile Tire Revenue (USD Million) by Type (2018-2022)
8.6.3 Middle East and Africa Automobile Tire Revenue (USD Million) by Applications (2018-2022)
9 Company Profiles
10 Global Automobile Tire Market Revenue (USD Million), by Type, and Applications (2023-2030)
10.1 Global Automobile Tire Revenue (USD Million) and Market Share (%) by Type (2023-2030)
10.1.1 Global Automobile Tire Revenue (USD Million), and Market Share (%) by Type (2023-2030)
10.2 Global Automobile Tire Revenue (USD Million) and Market Share (%) by Applications (2023-2030)
10.2.1 Global Automobile Tire Revenue (USD Million), and Market Share (%) by Applications (2023-2030)
11 Global Automobile Tire Development Regional Status and Outlook Forecast
11.1 Global Automobile Tire Revenue (USD Million) By Regions (2023-2030)
11.2 North America Automobile Tire Revenue (USD Million) by Type, and Applications (2023-2030)
11.2.1 North America Automobile Tire Revenue (USD) Million by Country (2023-2030)
11.2.2 North America Automobile Tire Revenue (USD Million), by Type (2023-2030)
11.2.3 North America Automobile Tire Revenue (USD Million), Market Share (%) by Applications (2023-2030)
11.3 Europe Automobile Tire Revenue (USD Million), by Type, and Applications (2023-2030)
11.3.1 Europe Automobile Tire Revenue (USD Million), by Country (2023-2030)
11.3.2 Europe Automobile Tire Revenue (USD Million), by Type (2023-2030)
11.3.3 Europe Automobile Tire Revenue (USD Million), by Applications (2023-2030)
11.4 Asia Pacific Automobile Tire Revenue (USD Million) by Type, and Applications (2023-2030)
11.4.1 Asia Pacific Automobile Tire Revenue (USD Million), by Country (2023-2030)
11.4.2 Asia Pacific Automobile Tire Revenue (USD Million), by Type (2023-2030)
11.4.3 Asia Pacific Automobile Tire Revenue (USD Million), by Applications (2023-2030)
11.5 South America Automobile Tire Revenue (USD Million), by Type, and Applications (2023-2030)
11.5.1 South America Automobile Tire Revenue (USD Million), by Country (2023-2030)
11.5.2 South America Automobile Tire Revenue (USD Million), by Type (2023-2030)
11.5.3 South America Automobile Tire Revenue (USD Million), by Applications (2023-2030)
11.6 Middle East and Africa Automobile Tire Revenue (USD Million), by Type, and Applications (2023-2030)
11.6.1 Middle East and Africa Automobile Tire Revenue (USD Million), by region (2023-2030)
11.6.2 Middle East and Africa Automobile Tire Revenue (USD Million), by Type (2023-2030)
11.6.3 Middle East and Africa Automobile Tire Revenue (USD Million), by Applications (2023-2030)
12 Methodology and Data Sources
12.1 Methodology/Research Approach
12.1.1 Research Programs/Design
12.1.2 Market Size Estimation
12.1.3 Market Breakdown and Data Triangulation
12.2 Data Sources
12.2.1 Secondary Sources
12.2.2 Primary Sources
12.3 Disclaimer
List of Tables
Table 1 Market Segmentation Analysis
Table 2 Global Automobile Tire Market Companies with Areas Served
Table 3 Products Offerings Global Automobile Tire Market
Table 4 Low Growth Scenario Forecasts
Table 5 Reference Case Growth Scenario
Table 6 High Growth Case Scenario
Table 7 Global Automobile Tire Revenue (USD Million) And CAGR (%) By Type (2018-2030)
Table 8 Global Automobile Tire Revenue (USD Million) And CAGR (%) By Applications (2018-2030)
Table 9 Global Automobile Tire Revenue (USD Million) And CAGR (%) By Regions (2018-2030)
Table 10 Global Automobile Tire Revenue (USD Million) By Type (2018-2022)
Table 11 Global Automobile Tire Revenue Market Share (%) By Type (2018-2022)
Table 12 Global Automobile Tire Revenue (USD Million) By Applications (2018-2022)
Table 13 Global Automobile Tire Revenue Market Share (%) By Applications (2018-2022)
Table 14 Global Automobile Tire Market Revenue (USD Million) By Regions (2018-2022)
Table 15 Global Automobile Tire Market Share (%) By Regions (2018-2022)
Table 16 North America Automobile Tire Revenue (USD Million) By Country (2018-2022)
Table 17 North America Automobile Tire Revenue (USD Million) By Type (2018-2022)
Table 18 North America Automobile Tire Revenue (USD Million) By Applications (2018-2022)
Table 19 Europe Automobile Tire Revenue (USD Million) By Country (2018-2022)
Table 20 Europe Automobile Tire Revenue (USD Million) By Type (2018-2022)
Table 21 Europe Automobile Tire Revenue (USD Million) By Applications (2018-2022)
Table 22 Asia Pacific Automobile Tire Revenue (USD Million) By Country (2018-2022)
Table 23 Asia Pacific Automobile Tire Revenue (USD Million) By Type (2018-2022)
Table 24 Asia Pacific Automobile Tire Revenue (USD Million) By Applications (2018-2022)
Table 25 South America Automobile Tire Revenue (USD Million) By Country (2018-2022)
Table 26 South America Automobile Tire Revenue (USD Million) By Type (2018-2022)
Table 27 South America Automobile Tire Revenue (USD Million) By Applications (2018-2022)
Table 28 Middle East and Africa Automobile Tire Revenue (USD Million) By Region (2018-2022)
Table 29 Middle East and Africa Automobile Tire Revenue (USD Million) By Type (2018-2022)
Table 30 Middle East and Africa Automobile Tire Revenue (USD Million) By Applications (2018-2022)
Table 31 Financial Analysis
Table 32 Global Automobile Tire Revenue (USD Million) By Type (2023-2030)
Table 33 Global Automobile Tire Revenue Market Share (%) By Type (2023-2030)
Table 34 Global Automobile Tire Revenue (USD Million) By Applications (2023-2030)
Table 35 Global Automobile Tire Revenue Market Share (%) By Applications (2023-2030)
Table 36 Global Automobile Tire Market Revenue (USD Million), And Revenue (USD Million) By Regions (2023-2030)
Table 37 North America Automobile Tire Revenue (USD)By Country (2023-2030)
Table 38 North America Automobile Tire Revenue (USD Million) By Type (2023-2030)
Table 39 North America Automobile Tire Revenue (USD Million) By Applications (2023-2030)
Table 40 Europe Automobile Tire Revenue (USD Million) By Country (2023-2030)
Table 41 Europe Automobile Tire Revenue (USD Million) By Type (2023-2030)
Table 42 Europe Automobile Tire Revenue (USD Million) By Applications (2023-2030)
Table 43 Asia Pacific Automobile Tire Revenue (USD Million) By Country (2023-2030)
Table 44 Asia Pacific Automobile Tire Revenue (USD Million) By Type (2023-2030)
Table 45 Asia Pacific Automobile Tire Revenue (USD Million) By Applications (2023-2030)
Table 46 South America Automobile Tire Revenue (USD Million) By Country (2023-2030)
Table 47 South America Automobile Tire Revenue (USD Million) By Type (2023-2030)
Table 48 South America Automobile Tire Revenue (USD Million) By Applications (2023-2030)
Table 49 Middle East and Africa Automobile Tire Revenue (USD Million) By Region (2023-2030)
Table 50 Middle East and Africa Automobile Tire Revenue (USD Million) By Region (2023-2030)
Table 51 Middle East and Africa Automobile Tire Revenue (USD Million) By Type (2023-2030)
Table 52 Middle East and Africa Automobile Tire Revenue (USD Million) By Applications (2023-2030)
Table 53 Research Programs/Design for This Report
Table 54 Key Data Information from Secondary Sources
Table 55 Key Data Information from Primary Sources
List of Figures
Figure 1 Market Scope
Figure 2 Porter’s Five Forces
Figure 3 Global Automobile Tire Revenue (USD Million) By Type (2018-2022)
Figure 4 Global Automobile Tire Revenue Market Share (%) By Type (2022)
Figure 5 Global Automobile Tire Revenue (USD Million) By Applications (2018-2022)
Figure 6 Global Automobile Tire Revenue Market Share (%) By Applications (2022)
Figure 7 Global Automobile Tire Market Revenue (USD Million) By Regions (2018-2022)
Figure 8 Global Automobile Tire Market Share (%) By Regions (2022)
Figure 9 North America Automobile Tire Revenue (USD Million) By Country (2018-2022)
Figure 10 North America Automobile Tire Revenue (USD Million) By Type (2018-2022)
Figure 11 North America Automobile Tire Revenue (USD Million) By Applications (2018-2022)
Figure 12 Europe Automobile Tire Revenue (USD Million) By Country (2018-2022)
Figure 13 Europe Automobile Tire Revenue (USD Million) By Type (2018-2022)
Figure 14 Europe Automobile Tire Revenue (USD Million) By Applications (2018-2022)
Figure 15 Asia Pacific Automobile Tire Revenue (USD Million) By Country (2018-2022)
Figure 16 Asia Pacific Automobile Tire Revenue (USD Million) By Type (2018-2022)
Figure 17 Asia Pacific Automobile Tire Revenue (USD Million) By Applications (2018-2022)
Figure 18 South America Automobile Tire Revenue (USD Million) By Country (2018-2022)
Figure 19 South America Automobile Tire Revenue (USD Million) By Type (2018-2022)
Figure 20 South America Automobile Tire Revenue (USD Million) By Applications (2018-2022)
Figure 21 Middle East and Africa Automobile Tire Revenue (USD Million) By Region (2018-2022)
Figure 22 Middle East and Africa Automobile Tire Revenue (USD Million) By Type (2018-2022)
Figure 23 Middle East and Africa Automobile Tire Revenue (USD Million) By Applications (2018-2022)
Figure 24 Global Automobile Tire Revenue (USD Million) By Type (2023-2030)
Figure 25 Global Automobile Tire Revenue Market Share (%) By Type (2030)
Figure 26 Global Automobile Tire Revenue (USD Million) By Applications (2023-2030)
Figure 27 Global Automobile Tire Revenue Market Share (%) By Applications (2030)
Figure 28 Global Automobile Tire Market Revenue (USD Million) By Regions (2023-2030)
Figure 29 North America Automobile Tire Revenue (USD Million) By Country (2023-2030)
Figure 30 North America Automobile Tire Revenue (USD Million) By Type (2023-2030)
Figure 31 North America Automobile Tire Revenue (USD Million) By Applications (2023-2030)
Figure 32 Europe Automobile Tire Revenue (USD Million) By Country (2023-2030)
Figure 33 Europe Automobile Tire Revenue (USD Million) By Type (2023-2030)
Figure 34 Europe Automobile Tire Revenue (USD Million) By Applications (2023-2030)
Figure 35 Asia Pacific Automobile Tire Revenue (USD Million) By Country (2023-2030)
Figure 36 Asia Pacific Automobile Tire Revenue (USD Million) By Type (2023-2030)
Figure 37 Asia Pacific Automobile Tire Revenue (USD Million) By Applications (2023-2030)
Figure 38 South America Automobile Tire Revenue (USD Million) By Country (2023-2030)
Figure 39 South America Automobile Tire Revenue (USD Million) By Type (2023-2030)
Figure 40 South America Automobile Tire Revenue (USD Million) By Applications (2023-2030)
Figure 41 Middle East and Africa Automobile Tire Revenue (USD Million) By Region (2023-2030)
Figure 42 Middle East and Africa Automobile Tire Revenue (USD Million) By Region (2023-2030)
Figure 43 Middle East and Africa Automobile Tire Revenue (USD Million) By Type (2023-2030)
Figure 44 Middle East and Africa Automobile Tire Revenue (USD Million) By Applications (2023-2030)
Figure 45 Bottom-Up and Top-Down Approaches for This Report
Figure 46 Data Triangulation
