
The global Automotive Emblem Market study analyzes and forecasts the market size across 6 regions and 24 countries for diverse segments including- By Type (OE fitment, Aftermarket), By Vehicle (Passenger cars, Commercial vehicles)
The Automotive Emblem Market in 2025 is anticipated to grow steadily, driven by the increasing demand for personalized and premium vehicles worldwide. Emblems, serving as a vital branding element for automotive manufacturers, are evolving beyond traditional designs to incorporate advanced materials such as carbon fiber, aluminum alloys, and even LED-illuminated features. Electric and luxury vehicle segments are key contributors to market growth, as they emphasize aesthetics and differentiation. Customization trends, particularly in aftermarket modifications, are further expanding opportunities for emblem manufacturers. Technological advancements, such as 3D printing and smart emblems integrated with sensors, are enhancing design precision and functionality. Additionally, the push for sustainability is prompting the use of eco-friendly materials and processes in emblem production. Asia-Pacific, as a hub for automotive manufacturing, remains a dominant market, while North America and Europe continue to see demand for innovative and high-end emblem designs.
The most prominent trend in the Automotive Emblem Market is the integration of LED lighting and advanced materials in automotive emblems. As vehicle aesthetics become increasingly important, manufacturers are enhancing the visual appeal of automotive emblems by incorporating LED lighting elements. This trend not only adds a distinctive and dynamic look to emblems but also contributes to improved visibility, especially during low-light conditions. Furthermore, the use of advanced materials, such as chrome-plated plastics and composite materials, is gaining traction, offering durability and design flexibility. The Automotive Emblem Market is witnessing a shift towards innovative emblem designs that combine aesthetics with functional features, reflecting the industry's focus on enhancing the overall vehicle exterior.
A key driver propelling the Automotive Emblem Market is the increasing emphasis on branding and vehicle personalization, which drives the demand for customized automotive emblems. The driver behind the market's growth is the growing desire among vehicle owners to distinguish their vehicles and make a personal statement. Automakers and aftermarket providers are responding to this trend by offering a wide range of emblem customization options, including unique shapes, finishes, and brand-specific designs. The Automotive Emblem Market is catering to consumer preferences for personalized vehicles, allowing individuals to showcase their brand loyalty or add a touch of uniqueness to their vehicles through customized emblems.
An emerging opportunity within the Automotive Emblem Market lies in the integration of smart and interactive features in automotive emblems. With the advent of smart vehicle technologies, there is potential to transform emblems into interactive elements that provide information or communicate with the driver and surrounding environment. This opportunity aligns with the broader trend of connected vehicles. Manufacturers in the Automotive Emblem Market can explore innovations that incorporate sensors, LED displays, or other interactive technologies into emblems, creating a new dimension of communication between the vehicle and its surroundings. By seizing this opportunity, the market can contribute to the development of smart exterior features, enhancing both aesthetics and functionality in modern vehicles."
The largest segment in the automotive emblem market by vehicle is passenger cars. Passenger cars dominate due to their significantly higher production and sales volumes compared to commercial vehicles. Emblems play a vital role in branding and aesthetic appeal, which are key factors influencing consumer choice in the passenger car segment. Additionally, the growing demand for premium and luxury cars, which often feature intricate and high-quality emblems, further bolsters this segment. The expanding automotive industry in emerging markets, coupled with frequent model updates and design innovations, ensures the sustained dominance of passenger cars in this market.
The fastest-growing segment in the automotive emblem market by type is the aftermarket. The aftermarket segment is driven by increasing consumer interest in vehicle customization and personalization, where unique or upgraded emblems are often used to enhance the vehicle's appearance. Additionally, the growing number of aging vehicles and the need for emblem replacements due to wear or damage contribute to this segment’s growth. Rising disposable incomes and advancements in manufacturing technologies enabling affordable, high-quality aftermarket emblems further accelerate this trend. The flexibility and variety offered by aftermarket products make them appealing to a broad consumer base, ensuring rapid expansion.
The US Automotive Emblem Market size is estimated at $274 Million in 2025. The automotive emblem market in the United States is driven by a combination of OEM demand, customization trends, and advancements in manufacturing technologies. The rise of electric vehicles (EVs) has spurred innovation in emblem designs, with automakers incorporating illuminated, interactive, and aerodynamic badges to align with futuristic vehicle aesthetics. Additionally, the growing popularity of aftermarket modifications and brand-conscious consumers has led to increased demand for customized and high-end emblems, including carbon fiber and 3D-printed variants. However, challenges such as rising raw material costs, supply chain disruptions, and shifting consumer preferences toward minimalist vehicle designs could influence emblem production and demand. The increasing push for sustainable and recyclable materials in automotive manufacturing is also prompting manufacturers to explore eco-friendly emblem solutions.
Europe Automotive Emblem Market continues to offer significant business potential with $350 Million sales revenue in 2025. In Europe, the automotive emblem market is shaped by strong luxury car sales, sustainability regulations, and the demand for high-quality branding elements from premium automakers like BMW, Mercedes-Benz, and Audi. The region’s emphasis on lightweight vehicle components has driven the adoption of advanced emblem materials such as lightweight alloys, high-strength plastics, and LED-integrated designs. Additionally, European regulations promoting recyclability and eco-friendly automotive manufacturing have encouraged the use of biodegradable and low-impact emblem production methods. However, supply chain complexities, particularly related to semiconductor shortages affecting illuminated emblems, pose a challenge to market stability. The shift toward electric mobility and streamlined vehicle designs is also prompting automakers to experiment with embedded, digital, or projection-based branding solutions.
South East Asia is among the fastest growing regions worldwide for Automotive Emblem Market. Over the forecast period to 2034, South East Asia Automotive Emblem Market demand is poised to register a robust growth rate of 4.5%. Southeast Asia’s automotive emblem market is expanding due to rising vehicle production, increasing disposable incomes, and the growing popularity of vehicle customization. Countries such as Thailand, Indonesia, and Malaysia serve as key automotive manufacturing hubs, driving steady demand for OEM emblems. The aftermarket segment is also witnessing growth as consumers seek personalized and stylized emblems, often incorporating chrome, gold plating, or LED enhancements. However, cost sensitivity among mass-market consumers and the influx of counterfeit emblem products pose significant challenges. Despite these hurdles, technological advancements in 3D printing and digital branding solutions are opening new opportunities for emblem customization and production efficiency in the region.
Saudi Arabia’s automotive emblem market is influenced by the country’s strong demand for luxury and high-performance vehicles, along with a thriving car customization culture. High-end car brands, particularly those catering to affluent consumers, are driving demand for premium, illuminated, and bespoke emblems. Additionally, the rise of motorsports and off-road vehicle culture in the region has contributed to an increasing preference for rugged and weather-resistant emblem designs. However, the dominance of imported vehicles means that the market remains largely dependent on global OEM supply chains. Counterfeit emblem production is another challenge, particularly in the aftermarket segment. Nonetheless, as the Saudi government invests in local automotive manufacturing under Vision 2030, domestic emblem production may gain traction, providing new opportunities for market players.
|
Parameter |
Details |
|
Market Size (2025) |
$1.54 Billion |
|
Market Size (2034) |
$2.2 Billion |
|
Market Growth Rate |
4.3% |
|
Segments |
By Type (OE fitment, Aftermarket), By Vehicle (Passenger cars, Commercial vehicles) |
|
Study Period |
2019- 2024 and 2025-2034 |
|
Units |
Revenue (USD) |
|
Qualitative Analysis |
Porter’s Five Forces, SWOT Profile, Market Share, Scenario Forecasts, Market Ecosystem, Company Ranking, Market Dynamics, Industry Benchmarking |
|
Companies |
Billet Badges Inc, BrandCrowd, CarBeyondStore, Elektroplate, EmblemArt Inc, EuroBadgez, Ikonic Badges, LaFrance Corp, Lapeer Plating + Plastics Inc, Lewis Banks Ltd, Metalic Impressions Pvt. Ltd, Pretty Shiny Gifts, Santosh Export, Thomas Fattorini Ltd, Tokai Rika Co. Ltd, Toyoda Gosei Co. Ltd, Zanini Auto Group S.A., and Others. |
|
Countries |
US, Canada, Mexico, Germany, France, Spain, Italy, UK, Russia, China, India, Japan, South Korea, Australia, South East Asia, Brazil, Argentina, Middle East, Africa |
By Type
By Vehicle
By Region
*List not exhaustive
Automotive Emblem Market Outlook 2024
1 Market Overview
1.1 Introduction to the Automotive Emblem Market
1.2 Scope of the Study
1.3 Research Objective
1.3.1 Key Market Scope and Segments
1.3.2 Players Covered
1.3.3 Years Considered
2 Executive Summary
2.1 2024 Automotive Emblem Industry- Market Statistics
3 Market Dynamics
3.1 Market Drivers
3.2 Market Challenges
3.3 Market Opportunities
3.4 Market Trends
4 Market Factor Analysis
4.1 Porter’s Five Forces
4.2 Market Entropy
4.2.1 Global Automotive Emblem Market Companies with Area Served
4.2.2 Products Offerings Global Automotive Emblem Market
5 COVID-19 Impact Analysis and Outlook Scenarios
5.1.1 Covid-19 Impact Analysis
5.1.2 Post-COVID-19 Scenario- Low Growth Case
5.1.3 Post-COVID-19 Scenario- Reference Growth Case
5.1.4 Post-COVID-19 Scenario- Low Growth Case
6 Global Automotive Emblem Market Trends
6.1 Global Automotive Emblem Revenue (USD Million) and CAGR (%) by Type (2018-2030)
6.2 Global Automotive Emblem Revenue (USD Million) and CAGR (%) by Applications (2018-2030)
6.3 Global Automotive Emblem Revenue (USD Million) and CAGR (%) by Regions (2018-2030)
7 Global Automotive Emblem Market Revenue (USD Million) by Type, and Applications (2018-2022)
7.1 Global Automotive Emblem Revenue (USD Million) by Type (2018-2022)
7.1.1 Global Automotive Emblem Revenue (USD Million), Market Share (%) by Type (2018-2022)
7.2 Global Automotive Emblem Revenue (USD Million) by Applications (2018-2022)
7.2.1 Global Automotive Emblem Revenue (USD Million), Market Share (%) by Applications (2018-2022)
8 Global Automotive Emblem Development Regional Status and Outlook
8.1 Global Automotive Emblem Revenue (USD Million) By Regions (2018-2022)
8.2 North America Automotive Emblem Revenue (USD Million) by Type, and Application (2018-2022)
8.2.1 North America Automotive Emblem Revenue (USD Million) by Country (2018-2022)
8.2.2 North America Automotive Emblem Revenue (USD Million) by Type (2018-2022)
8.2.3 North America Automotive Emblem Revenue (USD Million) by Applications (2018-2022)
8.3 Europe Automotive Emblem Revenue (USD Million), by Type, and Applications (USD Million) (2018-2022)
8.3.1 Europe Automotive Emblem Revenue (USD Million), by Country (2018-2022)
8.3.2 Europe Automotive Emblem Revenue (USD Million) by Type (2018-2022)
8.3.3 Europe Automotive Emblem Revenue (USD Million) by Applications (2018-2022)
8.4 Asia Pacific Automotive Emblem Revenue (USD Million), and Revenue (USD Million) by Type, and Applications (2018-2022)
8.4.1 Asia Pacific Automotive Emblem Revenue (USD Million) by Country (2018-2022)
8.4.2 Asia Pacific Automotive Emblem Revenue (USD Million) by Type (2018-2022)
8.4.3 Asia Pacific Automotive Emblem Revenue (USD Million) by Applications (2018-2022)
8.5 South America Automotive Emblem Revenue (USD Million), by Type, and Applications (2018-2022)
8.5.1 South America Automotive Emblem Revenue (USD Million), by Country (2018-2022)
8.5.2 South America Automotive Emblem Revenue (USD Million) by Type (2018-2022)
8.5.3 South America Automotive Emblem Revenue (USD Million) by Applications (2018-2022)
8.6 Middle East and Africa Automotive Emblem Revenue (USD Million), by Type, Technology, Application, Thickness (2018-2022)
8.6.1 Middle East and Africa Automotive Emblem Revenue (USD Million) by Country (2018-2022)
8.6.2 Middle East and Africa Automotive Emblem Revenue (USD Million) by Type (2018-2022)
8.6.3 Middle East and Africa Automotive Emblem Revenue (USD Million) by Applications (2018-2022)
9 Company Profiles
10 Global Automotive Emblem Market Revenue (USD Million), by Type, and Applications (2024-2030)
10.1 Global Automotive Emblem Revenue (USD Million) and Market Share (%) by Type (2024-2030)
10.1.1 Global Automotive Emblem Revenue (USD Million), and Market Share (%) by Type (2024-2030)
10.2 Global Automotive Emblem Revenue (USD Million) and Market Share (%) by Applications (2024-2030)
10.2.1 Global Automotive Emblem Revenue (USD Million), and Market Share (%) by Applications (2024-2030)
11 Global Automotive Emblem Development Regional Status and Outlook Forecast
11.1 Global Automotive Emblem Revenue (USD Million) By Regions (2024-2030)
11.2 North America Automotive Emblem Revenue (USD Million) by Type, and Applications (2024-2030)
11.2.1 North America Automotive Emblem Revenue (USD) Million by Country (2024-2030)
11.2.2 North America Automotive Emblem Revenue (USD Million), by Type (2024-2030)
11.2.3 North America Automotive Emblem Revenue (USD Million), Market Share (%) by Applications (2024-2030)
11.3 Europe Automotive Emblem Revenue (USD Million), by Type, and Applications (2024-2030)
11.3.1 Europe Automotive Emblem Revenue (USD Million), by Country (2024-2030)
11.3.2 Europe Automotive Emblem Revenue (USD Million), by Type (2024-2030)
11.3.3 Europe Automotive Emblem Revenue (USD Million), by Applications (2024-2030)
11.4 Asia Pacific Automotive Emblem Revenue (USD Million) by Type, and Applications (2024-2030)
11.4.1 Asia Pacific Automotive Emblem Revenue (USD Million), by Country (2024-2030)
11.4.2 Asia Pacific Automotive Emblem Revenue (USD Million), by Type (2024-2030)
11.4.3 Asia Pacific Automotive Emblem Revenue (USD Million), by Applications (2024-2030)
11.5 South America Automotive Emblem Revenue (USD Million), by Type, and Applications (2024-2030)
11.5.1 South America Automotive Emblem Revenue (USD Million), by Country (2024-2030)
11.5.2 South America Automotive Emblem Revenue (USD Million), by Type (2024-2030)
11.5.3 South America Automotive Emblem Revenue (USD Million), by Applications (2024-2030)
11.6 Middle East and Africa Automotive Emblem Revenue (USD Million), by Type, and Applications (2024-2030)
11.6.1 Middle East and Africa Automotive Emblem Revenue (USD Million), by Region (2024-2030)
11.6.2 Middle East and Africa Automotive Emblem Revenue (USD Million), by Type (2024-2030)
11.6.3 Middle East and Africa Automotive Emblem Revenue (USD Million), by Applications (2024-2030)
12 Methodology and Data Sources
12.1 Methodology/Research Approach
12.1.1 Research Programs/Design
12.1.2 Market Size Estimation
12.1.3 Market Breakdown and Data Triangulation
12.2 Data Sources
12.2.1 Secondary Sources
12.2.2 Primary Sources
12.3 Disclaimer
List of Tables
Table 1 Market Segmentation Analysis
Table 2 Global Automotive Emblem Market Companies with Areas Served
Table 3 Products Offerings Global Automotive Emblem Market
Table 4 Low Growth Scenario Forecasts
Table 5 Reference Case Growth Scenario
Table 6 High Growth Case Scenario
Table 7 Global Automotive Emblem Revenue (USD Million) And CAGR (%) By Type (2018-2030)
Table 8 Global Automotive Emblem Revenue (USD Million) And CAGR (%) By Applications (2018-2030)
Table 9 Global Automotive Emblem Revenue (USD Million) And CAGR (%) By Regions (2018-2030)
Table 10 Global Automotive Emblem Revenue (USD Million) By Type (2018-2022)
Table 11 Global Automotive Emblem Revenue Market Share (%) By Type (2018-2022)
Table 12 Global Automotive Emblem Revenue (USD Million) By Applications (2018-2022)
Table 13 Global Automotive Emblem Revenue Market Share (%) By Applications (2018-2022)
Table 14 Global Automotive Emblem Market Revenue (USD Million) By Regions (2018-2022)
Table 15 Global Automotive Emblem Market Share (%) By Regions (2018-2022)
Table 16 North America Automotive Emblem Revenue (USD Million) By Country (2018-2022)
Table 17 North America Automotive Emblem Revenue (USD Million) By Type (2018-2022)
Table 18 North America Automotive Emblem Revenue (USD Million) By Applications (2018-2022)
Table 19 Europe Automotive Emblem Revenue (USD Million) By Country (2018-2022)
Table 20 Europe Automotive Emblem Revenue (USD Million) By Type (2018-2022)
Table 21 Europe Automotive Emblem Revenue (USD Million) By Applications (2018-2022)
Table 22 Asia Pacific Automotive Emblem Revenue (USD Million) By Country (2018-2022)
Table 23 Asia Pacific Automotive Emblem Revenue (USD Million) By Type (2018-2022)
Table 24 Asia Pacific Automotive Emblem Revenue (USD Million) By Applications (2018-2022)
Table 25 South America Automotive Emblem Revenue (USD Million) By Country (2018-2022)
Table 26 South America Automotive Emblem Revenue (USD Million) By Type (2018-2022)
Table 27 South America Automotive Emblem Revenue (USD Million) By Applications (2018-2022)
Table 28 Middle East and Africa Automotive Emblem Revenue (USD Million) By Region (2018-2022)
Table 29 Middle East and Africa Automotive Emblem Revenue (USD Million) By Type (2018-2022)
Table 30 Middle East and Africa Automotive Emblem Revenue (USD Million) By Applications (2018-2022)
Table 31 Financial Analysis
Table 32 Global Automotive Emblem Revenue (USD Million) By Type (2024-2030)
Table 33 Global Automotive Emblem Revenue Market Share (%) By Type (2024-2030)
Table 34 Global Automotive Emblem Revenue (USD Million) By Applications (2024-2030)
Table 35 Global Automotive Emblem Revenue Market Share (%) By Applications (2024-2030)
Table 36 Global Automotive Emblem Market Revenue (USD Million), And Revenue (USD Million) By Regions (2024-2030)
Table 37 North America Automotive Emblem Revenue (USD)By Country (2024-2030)
Table 38 North America Automotive Emblem Revenue (USD Million) By Type (2024-2030)
Table 39 North America Automotive Emblem Revenue (USD Million) By Applications (2024-2030)
Table 40 Europe Automotive Emblem Revenue (USD Million) By Country (2024-2030)
Table 41 Europe Automotive Emblem Revenue (USD Million) By Type (2024-2030)
Table 42 Europe Automotive Emblem Revenue (USD Million) By Applications (2024-2030)
Table 43 Asia Pacific Automotive Emblem Revenue (USD Million) By Country (2024-2030)
Table 44 Asia Pacific Automotive Emblem Revenue (USD Million) By Type (2024-2030)
Table 45 Asia Pacific Automotive Emblem Revenue (USD Million) By Applications (2024-2030)
Table 46 South America Automotive Emblem Revenue (USD Million) By Country (2024-2030)
Table 47 South America Automotive Emblem Revenue (USD Million) By Type (2024-2030)
Table 48 South America Automotive Emblem Revenue (USD Million) By Applications (2024-2030)
Table 49 Middle East and Africa Automotive Emblem Revenue (USD Million) By Region (2024-2030)
Table 50 Middle East and Africa Automotive Emblem Revenue (USD Million) By Region (2024-2030)
Table 51 Middle East and Africa Automotive Emblem Revenue (USD Million) By Type (2024-2030)
Table 52 Middle East and Africa Automotive Emblem Revenue (USD Million) By Applications (2024-2030)
Table 53 Research Programs/Design for This Report
Table 54 Key Data Information from Secondary Sources
Table 55 Key Data Information from Primary Sources
List of Figures
Figure 1 Market Scope
Figure 2 Porter’s Five Forces
Figure 3 Global Automotive Emblem Revenue (USD Million) By Type (2018-2022)
Figure 4 Global Automotive Emblem Revenue Market Share (%) By Type (2022)
Figure 5 Global Automotive Emblem Revenue (USD Million) By Applications (2018-2022)
Figure 6 Global Automotive Emblem Revenue Market Share (%) By Applications (2022)
Figure 7 Global Automotive Emblem Market Revenue (USD Million) By Regions (2018-2022)
Figure 8 Global Automotive Emblem Market Share (%) By Regions (2022)
Figure 9 North America Automotive Emblem Revenue (USD Million) By Country (2018-2022)
Figure 10 North America Automotive Emblem Revenue (USD Million) By Type (2018-2022)
Figure 11 North America Automotive Emblem Revenue (USD Million) By Applications (2018-2022)
Figure 12 Europe Automotive Emblem Revenue (USD Million) By Country (2018-2022)
Figure 13 Europe Automotive Emblem Revenue (USD Million) By Type (2018-2022)
Figure 14 Europe Automotive Emblem Revenue (USD Million) By Applications (2018-2022)
Figure 15 Asia Pacific Automotive Emblem Revenue (USD Million) By Country (2018-2022)
Figure 16 Asia Pacific Automotive Emblem Revenue (USD Million) By Type (2018-2022)
Figure 17 Asia Pacific Automotive Emblem Revenue (USD Million) By Applications (2018-2022)
Figure 18 South America Automotive Emblem Revenue (USD Million) By Country (2018-2022)
Figure 19 South America Automotive Emblem Revenue (USD Million) By Type (2018-2022)
Figure 20 South America Automotive Emblem Revenue (USD Million) By Applications (2018-2022)
Figure 21 Middle East and Africa Automotive Emblem Revenue (USD Million) By Region (2018-2022)
Figure 22 Middle East and Africa Automotive Emblem Revenue (USD Million) By Type (2018-2022)
Figure 23 Middle East and Africa Automotive Emblem Revenue (USD Million) By Applications (2018-2022)
Figure 24 Global Automotive Emblem Revenue (USD Million) By Type (2024-2030)
Figure 25 Global Automotive Emblem Revenue Market Share (%) By Type (2030)
Figure 26 Global Automotive Emblem Revenue (USD Million) By Applications (2024-2030)
Figure 27 Global Automotive Emblem Revenue Market Share (%) By Applications (2030)
Figure 28 Global Automotive Emblem Market Revenue (USD Million) By Regions (2024-2030)
Figure 29 North America Automotive Emblem Revenue (USD Million) By Country (2024-2030)
Figure 30 North America Automotive Emblem Revenue (USD Million) By Type (2024-2030)
Figure 31 North America Automotive Emblem Revenue (USD Million) By Applications (2024-2030)
Figure 32 Europe Automotive Emblem Revenue (USD Million) By Country (2024-2030)
Figure 33 Europe Automotive Emblem Revenue (USD Million) By Type (2024-2030)
Figure 34 Europe Automotive Emblem Revenue (USD Million) By Applications (2024-2030)
Figure 35 Asia Pacific Automotive Emblem Revenue (USD Million) By Country (2024-2030)
Figure 36 Asia Pacific Automotive Emblem Revenue (USD Million) By Type (2024-2030)
Figure 37 Asia Pacific Automotive Emblem Revenue (USD Million) By Applications (2024-2030)
Figure 38 South America Automotive Emblem Revenue (USD Million) By Country (2024-2030)
Figure 39 South America Automotive Emblem Revenue (USD Million) By Type (2024-2030)
Figure 40 South America Automotive Emblem Revenue (USD Million) By Applications (2024-2030)
Figure 41 Middle East and Africa Automotive Emblem Revenue (USD Million) By Region (2024-2030)
Figure 42 Middle East and Africa Automotive Emblem Revenue (USD Million) By Region (2024-2030)
Figure 43 Middle East and Africa Automotive Emblem Revenue (USD Million) By Type (2024-2030)
Figure 44 Middle East and Africa Automotive Emblem Revenue (USD Million) By Applications (2024-2030)
Figure 45 Bottom-Up and Top-Down Approaches For This Report
Figure 46 Data Triangulation
By Type
By Vehicle Type
By Region
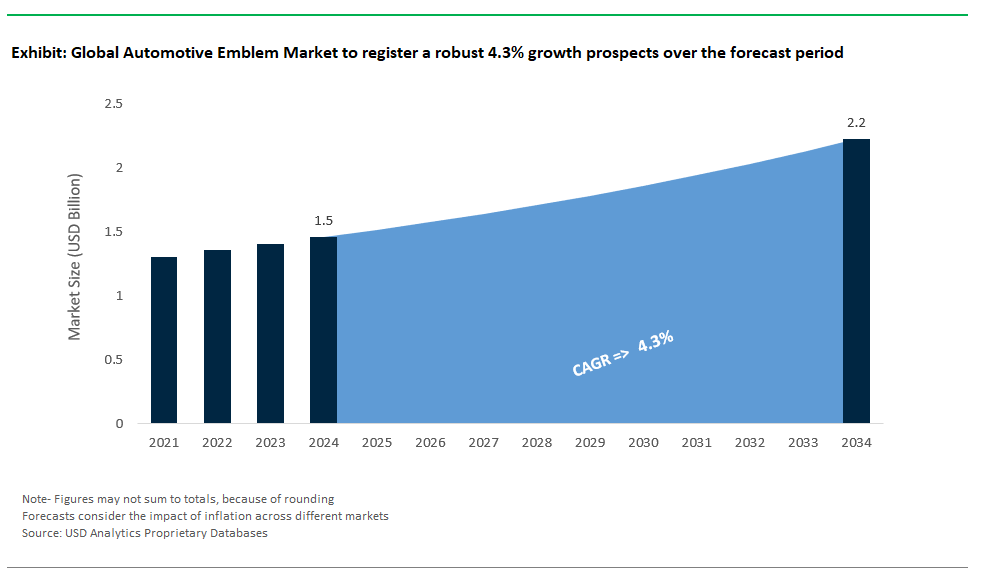
The Global Automotive Emblem Market Size is estimated at $1.5 Billion in 2025 and is forecast to register an annual growth rate (CAGR) of 4.3% to reach $2.2 Billion by 2034.
Emerging Markets across Asia Pacific, Europe, and Americas present robust growth prospects.
Billet Badges Inc, BrandCrowd, CarBeyondStore, Elektroplate, EmblemArt Inc, EuroBadgez, Ikonic Badges, LaFrance Corp, Lapeer Plating + Plastics Inc, Lewis Banks Ltd, Metalic Impressions Pvt. Ltd, Pretty Shiny Gifts, Santosh Export, Thomas Fattorini Ltd, Tokai Rika Co. Ltd, Toyoda Gosei Co. Ltd, Zanini Auto Group S.A.
Base Year- 2024; Estimated Year- 2025; Historic Period- 2019-2024; Forecast period- 2025 to 2034; Currency: Revenue (USD); Volume
The US Automotive Emblem Market size is estimated at $274 Million in 2025.