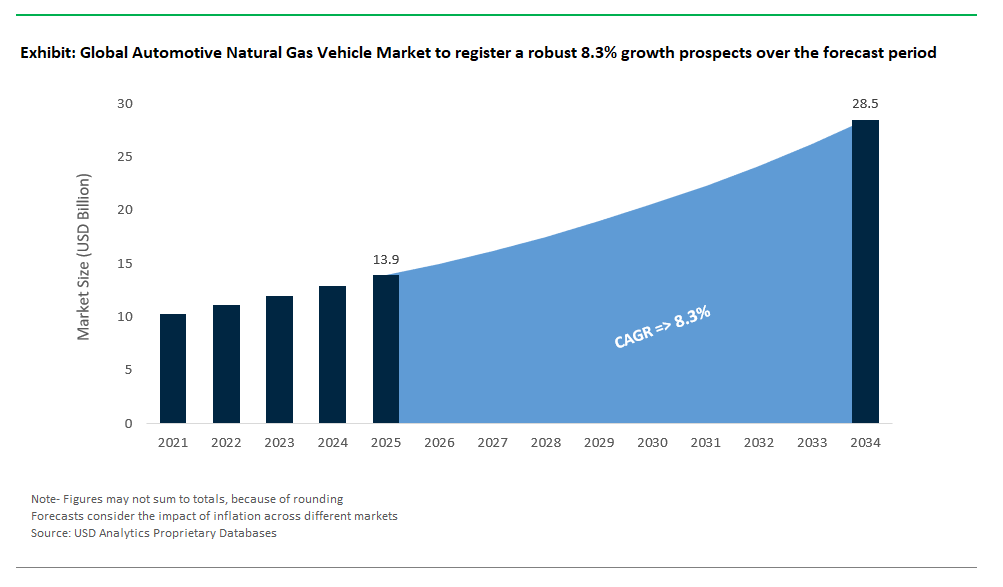
The Global Automotive Natural Gas Vehicle Market Size is estimated at $13.9 Billion in 2025 and is forecast to register an annual growth rate (CAGR) of 8.3% to reach $28.4 Billion by 2034.
The global Automotive Natural Gas Vehicle Market Study analyzes and forecasts the market size across 6 regions and 24 countries for diverse segments -By Fuel (CNG, LNG), By Vehicle (Passenger Vehicles, Light-duty & Heavy-duty Buses and Trucks, Three-wheelers).
An Introduction to Automotive Natural Gas Vehicle Market in 2025
The automotive natural gas vehicle (NGV) market is gaining momentum as a cleaner alternative to traditional gasoline and diesel vehicles. NGVs, which use compressed natural gas (CNG) or liquefied natural gas (LNG) as fuel, offer lower emissions of pollutants and greenhouse gases compared to conventional fuels. The market is driven by increasing environmental regulations, rising fuel prices, and the need for more sustainable transportation solutions. Advances in NGV technology, including improved storage systems, engine performance, and infrastructure development, are enhancing the viability and appeal of natural gas vehicles. As governments and industries focus on reducing carbon footprints and promoting alternative fuels, the automotive NGV market is set to grow, supported by efforts to expand refueling infrastructure and enhance vehicle technology.
Automotive Natural Gas Vehicle Competitive Landscape
The market report analyses the leading companies in the industry including AB Volvo, Agility Fuel Solutions, Beiqi Foton Motor Co. Ltd, Clean Energy Fuels, CNH Industrial N.V., Cummins Inc, Navistar Inc, PACCAR Inc, Quantum Fuel Systems LLC, Westport Fuel Systems Inc, and others.
Automotive Natural Gas Vehicle Market Dynamics
Market Trend: Increasing Adoption of Compressed Natural Gas (CNG) Vehicles
A prominent trend in the automotive natural gas vehicle market is the increasing adoption of compressed natural gas (CNG) vehicles. CNG is gaining traction as a cleaner and more economical alternative to traditional gasoline and diesel fuels. This shift is driven by growing environmental concerns and the push for lower emissions in the transportation sector. CNG vehicles are recognized for their reduced greenhouse gas emissions, lower operating costs, and relatively abundant fuel supply compared to other fossil fuels. The trend reflects a broader move towards alternative fuels and sustainable transportation solutions, as both consumers and policymakers seek to address environmental challenges and enhance fuel efficiency.
Market Driver: Government Incentives and Environmental Regulations
The primary driver of the automotive natural gas vehicle market is the availability of government incentives and stringent environmental regulations. Many governments are offering financial incentives such as tax rebates, subsidies, and reduced vehicle registration fees to encourage the adoption of CNG vehicles. Additionally, increasingly stringent emissions regulations are pushing automakers to develop and promote vehicles that produce fewer pollutants. These regulatory measures not only support the growth of the natural gas vehicle market but also align with global efforts to reduce air pollution and greenhouse gas emissions. The combination of supportive policies and regulatory pressure is driving the market for automotive natural gas vehicles.
Market Opportunity: Expansion of CNG Infrastructure
An emerging opportunity in the automotive natural gas vehicle market is the expansion of CNG refueling infrastructure. As the adoption of CNG vehicles increases, the development of a comprehensive and accessible network of refueling stations becomes crucial. Investment in expanding CNG infrastructure, including the establishment of new refueling stations and upgrading existing ones, can alleviate concerns about fuel availability and enhance the practicality of owning a CNG vehicle. This opportunity presents potential for collaboration between governments, energy companies, and automotive manufacturers to support the growth of the CNG vehicle market and facilitate broader adoption of natural gas as a transportation fuel.
Automotive Natural Gas Vehicle Market Share Analysis: CNG (Compressed Natural Gas) generated the highest revenue in 2024
In the Automotive Natural Gas Vehicle Market, the CNG (Compressed Natural Gas) segment is the largest due to its widespread adoption and established infrastructure. CNG offers several advantages, including lower fuel costs, reduced emissions, and well-developed refueling networks in many regions. Its use in both private and public transportation sectors—such as taxis, fleet vehicles, and buses—contributes to its dominance. CNG is preferred for its convenience and cost-effectiveness compared to LNG (Liquefied Natural Gas), particularly in areas where refueling infrastructure is more accessible. The extensive availability of CNG stations and the favorable regulatory environment supporting cleaner fuel alternatives bolster the segment's leading position in the market.
Automotive Natural Gas Vehicle Market Share Analysis: Light-duty & Heavy-duty Buses and Trucks is poised to register the fastest CAGR over the forecast period
Within the Automotive Natural Gas Vehicle Market, the Light-duty & Heavy-duty Buses and Trucks segment is the fastest growing due to the increasing adoption of natural gas as a cleaner alternative to diesel in commercial transportation. The push towards reducing emissions and operational costs in the logistics and public transportation sectors drives the rapid growth of this segment. Natural gas-powered buses and trucks offer significant environmental benefits, including lower greenhouse gas emissions and reduced pollutants, aligning with stricter emissions regulations and sustainability goals. Additionally, advancements in natural gas vehicle technology and the expansion of refueling infrastructure for commercial fleets contribute to the accelerated growth of this segment, making it a key area of focus in the market.
Automotive Natural Gas Vehicle Market Report Scope
|
Parameter
|
Details
|
|
Market Size (2025)
|
$ 13.9 Billion
|
|
Market Size (2034)
|
$ 28.4 Billion
|
|
Market Growth Rate
|
8.3%
|
|
Segments
|
By Fuel (CNG, LNG), By Vehicle (Passenger Vehicles, Light-duty & Heavy-duty Buses and Trucks, Three-wheelers)
|
|
Study Period
|
2019- 2024 and 2025-2034
|
|
Units
|
Revenue (USD)
|
|
Qualitative Analysis
|
Porter’s Five Forces, SWOT Profile, Market Share, Scenario Forecasts, Market Ecosystem, Company Ranking, Market Dynamics, Industry Benchmarking
|
|
Companies
|
AB Volvo, Agility Fuel Solutions, Beiqi Foton Motor Co. Ltd, Clean Energy Fuels, CNH Industrial N.V., Cummins Inc, Navistar Inc, PACCAR Inc, Quantum Fuel Systems LLC, Westport Fuel Systems Inc
|
|
Countries
|
US, Canada, Mexico, Germany, France, Spain, Italy, UK, Russia, China, India, Japan, South Korea, Australia, South East Asia, Brazil, Argentina, Middle East, Africa
|
Automotive Natural Gas Vehicle Market Segmentation
By Fuel
CNG
LNG
By Vehicle
Passenger Vehicles
Light-duty & Heavy-duty Buses and Trucks
Three-wheelers
Countries Analyzed
North America (US, Canada, Mexico)
Europe (Germany, UK, France, Spain, Italy, Russia, Rest of Europe)
Asia Pacific (China, India, Japan, South Korea, Australia, South East Asia, Rest of Asia)
South America (Brazil, Argentina, Rest of South America)
Middle East and Africa (Saudi Arabia, UAE, Rest of Middle East, South Africa, Egypt, Rest of Africa)
Automotive Natural Gas Vehicle Companies Profiled in the Study
AB Volvo
Agility Fuel Solutions
Beiqi Foton Motor Co. Ltd
Clean Energy Fuels
CNH Industrial N.V.
Cummins Inc
Navistar Inc
PACCAR Inc
Quantum Fuel Systems LLC
Westport Fuel Systems Inc
*- List Not Exhaustive
About USD Analytics
Table of Contents
List of Charts and Exhibits
List of Tables
1. Executive Summary
What’s New in 2025?
Top 10 Takeaways from the industry
Potential Opportunities for Industry Stakeholders
Strategic Imperatives
Company Market Positioning
Industry Benchmarking Matrix
2. Research Scope and Methodology
Market Definition
Market Segments
Companies Profiled
Research Methodology
Bottom-Up Method
Top-Down Method
Data Triangulation
Forecast Methodology
Data Sources
USDA Proprietary Databases
External Sources
Primary Research and Interviews
Conversion Rates for USD
Abbreviations
3. Strategic Landscape: Key Insights and Implications
Spotlight: Key Strategies opted by Business Leaders
Competitive Landscape
Market Size ($ Million) and Share (%) by Company, 2024
SWOT Analysis
- Key Market Strengths
- Key Market Weaknesses
- Potential Opportunities
- Potential Threats
Porter’s Five Force Analysis
- Summary
- Bargaining Power of Buyers- Impact Analysis
- Bargaining Power of Suppliers- Impact Analysis
- Threat of new entrants- Impact Analysis
- Intensity of Competitive Rivalry- Impact Analysis
Macro-Environmental Analysis
- Economic forecasts by Country, 2010- 2035
- Population forecasts by Country, 2010- 2035
- Inflation Outlook by Country, 2010-2035
- Impact of Russia-Ukraine Conflict, Sluggish China Growth, US Developments
5. Growth Opportunity Analysis
Trends at a Glance
- What are the most noteworthy trends in the market
- Where should leaders pay attention?
- What industries are likely to be affected by the growth?
Market Dynamics
- Charting a path forward
- Growth Drivers
- Growth Barriers
Key Industry Stakeholders
- Suppliers
- Manufacturers and Service Providers
- Distribution Channels
- End-Users and Applications
- Regulators
- Investors, Traders, and R&D Institutes
Regulatory Landscape
6. Market Size Outlook to 2034
Global Nanocoatings Market Size Forecast, USD Million, 2018- 2034
- Historic Market Size, 2018- 2024
- Forecast Market Size, 2024- 2034
Scenario Analysis
- Low Growth Scenario: Definition and Outlook to 2034
- Reference Case: Definition and Outlook to 2034
- High Growth Scenario: Definition and Outlook to 2034
Pricing Analysis and Outlook
- Nanocoatings Average Price Forecast, 2021- 2034
- Key Factors Shaping the Pricing Patterns
7. Historical Nanocoatings Market Size by Segments, 2018- 2024
Key Statistics, 2024
Nanocoatings Market Size Outlook by Type, USD Million, 2018- 2024
Growth Comparison (y-o-y) across Nanocoatings Types, 2018- 2024
Nanocoatings Market Size Outlook by Application, USD Million, 2018- 2024
Growth Comparison (y-o-y) across Nanocoatings Applications, 2018- 2024
8. Nanocoatings Market Size Outlook by Segments, 2024- 2034
By Fuel
CNG
LNG
By Vehicle
Passenger Vehicles
Light-duty & Heavy-duty Buses and Trucks
Three-wheelers
9. Nanocoatings Market Size Outlook by Region
North America
Key Market Dynamics
North America Nanocoatings Market Size Outlook by Type, USD Million, 2021-2034
North America Nanocoatings Market Size Outlook by Application, USD Million, 2021-2034
North America Nanocoatings Market Size Outlook by Sales Channel, USD Million, 2021-2034
North America Nanocoatings Market Size Outlook by Country, USD Million, 2021-2034
Europe
Key Market Dynamics
Europe Nanocoatings Market Size Outlook by Type, USD Million, 2021-2034
Europe Nanocoatings Market Size Outlook by Application, USD Million, 2021-2034
Europe Nanocoatings Market Size Outlook by Sales Channel, USD Million, 2021-2034
Europe Nanocoatings Market Size Outlook by Country, USD Million, 2021-2034
Asia Pacific
Key Market Dynamics
Asia Pacific Nanocoatings Market Size Outlook by Type, USD Million, 2021-2034
Asia Pacific Nanocoatings Market Size Outlook by Application, USD Million, 2021-2034
Asia Pacific Nanocoatings Market Size Outlook by Sales Channel, USD Million, 2021-2034
Asia Pacific Nanocoatings Market Size Outlook by Country, USD Million, 2021-2034
South America
Key Market Dynamics
South America Nanocoatings Market Size Outlook by Type, USD Million, 2021-2034
South America Nanocoatings Market Size Outlook by Application, USD Million, 2021-2034
South America Nanocoatings Market Size Outlook by Sales Channel, USD Million, 2021-2034
South America Nanocoatings Market Size Outlook by Country, USD Million, 2021-2034
Middle East and Africa
Key Market Dynamics
Middle East and Africa Nanocoatings Market Size Outlook by Type, USD Million, 2021-2034
Middle East and Africa Nanocoatings Market Size Outlook by Application, USD Million, 2021-2034
Middle East and Africa Nanocoatings Market Size Outlook by Sales Channel, USD Million, 2021-2034
Middle East and Africa Nanocoatings Market Size Outlook by Country, USD Million, 2021-2034
10. United States Nanocoatings Market Analysis and Outlook, 2021- 2034
Key Statistics
United States Nanocoatings Market Size Outlook by Type, 2021- 2034
United States Nanocoatings Market Size Outlook by Application, 2021- 2034
United States Nanocoatings Market Size Outlook by End-User, 2021- 2034
11. Canada Nanocoatings Market Analysis and Outlook, 2021- 2034
Key Statistics
Canada Nanocoatings Market Size Outlook by Type, 2021- 2034
Canada Nanocoatings Market Size Outlook by Application, 2021- 2034
Canada Nanocoatings Market Size Outlook by End-User, 2021- 2034
12. Mexico Nanocoatings Market Analysis and Outlook, 2021- 2034
Key Statistics
Mexico Nanocoatings Market Size Outlook by Type, 2021- 2034
Mexico Nanocoatings Market Size Outlook by Application, 2021- 2034
Mexico Nanocoatings Market Size Outlook by End-User, 2021- 2034
13. Germany Nanocoatings Market Analysis and Outlook, 2021- 2034
Key Statistics
Germany Nanocoatings Market Size Outlook by Type, 2021- 2034
Germany Nanocoatings Market Size Outlook by Application, 2021- 2034
Germany Nanocoatings Market Size Outlook by End-User, 2021- 2034
14. France Nanocoatings Market Analysis and Outlook, 2021- 2034
Key Statistics
France Nanocoatings Market Size Outlook by Type, 2021- 2034
France Nanocoatings Market Size Outlook by Application, 2021- 2034
France Nanocoatings Market Size Outlook by End-User, 2021- 2034
15. United Kingdom Nanocoatings Market Analysis and Outlook, 2021- 2034
Key Statistics
United Kingdom Nanocoatings Market Size Outlook by Type, 2021- 2034
United Kingdom Nanocoatings Market Size Outlook by Application, 2021- 2034
United Kingdom Nanocoatings Market Size Outlook by End-User, 2021- 2034
16. Spain Nanocoatings Market Analysis and Outlook, 2021- 2034
Key Statistics
Spain Nanocoatings Market Size Outlook by Type, 2021- 2034
Spain Nanocoatings Market Size Outlook by Application, 2021- 2034
Spain Nanocoatings Market Size Outlook by End-User, 2021- 2034
17. Italy Nanocoatings Market Analysis and Outlook, 2021- 2034
Key Statistics
Italy Nanocoatings Market Size Outlook by Type, 2021- 2034
Italy Nanocoatings Market Size Outlook by Application, 2021- 2034
Italy Nanocoatings Market Size Outlook by End-User, 2021- 2034
18. Benelux Nanocoatings Market Analysis and Outlook, 2021- 2034
Key Statistics
Benelux Nanocoatings Market Size Outlook by Type, 2021- 2034
Benelux Nanocoatings Market Size Outlook by Application, 2021- 2034
Benelux Nanocoatings Market Size Outlook by End-User, 2021- 2034
19. Nordic Nanocoatings Market Analysis and Outlook, 2021- 2034
Key Statistics
Nordic Nanocoatings Market Size Outlook by Type, 2021- 2034
Nordic Nanocoatings Market Size Outlook by Application, 2021- 2034
Nordic Nanocoatings Market Size Outlook by End-User, 2021- 2034
20. Rest of Europe Nanocoatings Market Analysis and Outlook, 2021- 2034
Key Statistics
Rest of Europe Nanocoatings Market Size Outlook by Type, 2021- 2034
Rest of Europe Nanocoatings Market Size Outlook by Application, 2021- 2034
Rest of Europe Nanocoatings Market Size Outlook by End-User, 2021- 2034
21. China Nanocoatings Market Analysis and Outlook, 2021- 2034
Key Statistics
China Nanocoatings Market Size Outlook by Type, 2021- 2034
China Nanocoatings Market Size Outlook by Application, 2021- 2034
China Nanocoatings Market Size Outlook by End-User, 2021- 2034
22. India Nanocoatings Market Analysis and Outlook, 2021- 2034
Key Statistics
India Nanocoatings Market Size Outlook by Type, 2021- 2034
India Nanocoatings Market Size Outlook by Application, 2021- 2034
India Nanocoatings Market Size Outlook by End-User, 2021- 2034
23. Japan Nanocoatings Market Analysis and Outlook, 2021- 2034
Key Statistics
Japan Nanocoatings Market Size Outlook by Type, 2021- 2034
Japan Nanocoatings Market Size Outlook by Application, 2021- 2034
Japan Nanocoatings Market Size Outlook by End-User, 2021- 2034
24. South Korea Nanocoatings Market Analysis and Outlook, 2021- 2034
Key Statistics
South Korea Nanocoatings Market Size Outlook by Type, 2021- 2034
South Korea Nanocoatings Market Size Outlook by Application, 2021- 2034
South Korea Nanocoatings Market Size Outlook by End-User, 2021- 2034
25. Australia Nanocoatings Market Analysis and Outlook, 2021- 2034
Key Statistics
Australia Nanocoatings Market Size Outlook by Type, 2021- 2034
Australia Nanocoatings Market Size Outlook by Application, 2021- 2034
Australia Nanocoatings Market Size Outlook by End-User, 2021- 2034
26. South East Asia Nanocoatings Market Analysis and Outlook, 2021- 2034
Key Statistics
South East Asia Nanocoatings Market Size Outlook by Type, 2021- 2034
South East Asia Nanocoatings Market Size Outlook by Application, 2021- 2034
South East Asia Nanocoatings Market Size Outlook by End-User, 2021- 2034
27. Rest of Asia Pacific Nanocoatings Market Analysis and Outlook, 2021- 2034
Key Statistics
Rest of Asia Pacific Nanocoatings Market Size Outlook by Type, 2021- 2034
Rest of Asia Pacific Nanocoatings Market Size Outlook by Application, 2021- 2034
Rest of Asia Pacific Nanocoatings Market Size Outlook by End-User, 2021- 2034
28. Brazil Nanocoatings Market Analysis and Outlook, 2021- 2034
Key Statistics
Brazil Nanocoatings Market Size Outlook by Type, 2021- 2034
Brazil Nanocoatings Market Size Outlook by Application, 2021- 2034
Brazil Nanocoatings Market Size Outlook by End-User, 2021- 2034
29. Argentina Nanocoatings Market Analysis and Outlook, 2021- 2034
Key Statistics
Argentina Nanocoatings Market Size Outlook by Type, 2021- 2034
Argentina Nanocoatings Market Size Outlook by Application, 2021- 2034
Argentina Nanocoatings Market Size Outlook by End-User, 2021- 2034
30. Rest of South America Nanocoatings Market Analysis and Outlook, 2021- 2034
Key Statistics
Rest of South America Nanocoatings Market Size Outlook by Type, 2021- 2034
Rest of South America Nanocoatings Market Size Outlook by Application, 2021- 2034
Rest of South America Nanocoatings Market Size Outlook by End-User, 2021- 2034
31. United Arab Emirates Nanocoatings Market Analysis and Outlook, 2021- 2034
Key Statistics
United Arab Emirates Nanocoatings Market Size Outlook by Type, 2021- 2034
United Arab Emirates Nanocoatings Market Size Outlook by Application, 2021- 2034
United Arab Emirates Nanocoatings Market Size Outlook by End-User, 2021- 2034
32. Saudi Arabia Nanocoatings Market Analysis and Outlook, 2021- 2034
Key Statistics
Saudi Arabia Nanocoatings Market Size Outlook by Type, 2021- 2034
Saudi Arabia Nanocoatings Market Size Outlook by Application, 2021- 2034
Saudi Arabia Nanocoatings Market Size Outlook by End-User, 2021- 2034
33. Rest of Middle East Nanocoatings Market Analysis and Outlook, 2021- 2034
Key Statistics
Rest of Middle East Nanocoatings Market Size Outlook by Type, 2021- 2034
Rest of Middle East Nanocoatings Market Size Outlook by Application, 2021- 2034
Rest of Middle East Nanocoatings Market Size Outlook by End-User, 2021- 2034
34. South Africa Nanocoatings Market Analysis and Outlook, 2021- 2034
Key Statistics
South Africa Nanocoatings Market Size Outlook by Type, 2021- 2034
South Africa Nanocoatings Market Size Outlook by Application, 2021- 2034
South Africa Nanocoatings Market Size Outlook by End-User, 2021- 2034
35. Rest of Africa Nanocoatings Market Analysis and Outlook, 2021- 2034
Key Statistics
Rest of Africa Nanocoatings Market Size Outlook by Type, 2021- 2034
Rest of Africa Nanocoatings Market Size Outlook by Application, 2021- 2034
Rest of Africa Nanocoatings Market Size Outlook by End-User, 2021- 2034
36. Key Companies
Market Share Analysis
AB Volvo
Agility Fuel Solutions
Beiqi Foton Motor Co. Ltd
Clean Energy Fuels
CNH Industrial N.V.
Cummins Inc
Navistar Inc
PACCAR Inc
Quantum Fuel Systems LLC
Westport Fuel Systems Inc
Company Benchmarking
Financial Analysis
37. Recent Market Developments
38. Appendix
Looking Ahead
Research Methodology
Legal Disclaimer
