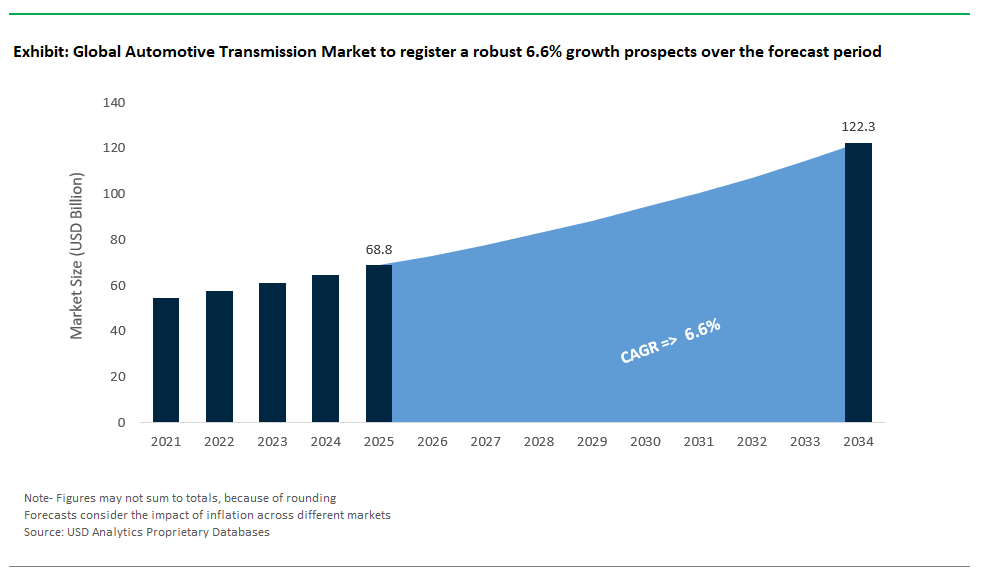
The Global Automotive Transmission Market Size is estimated at $68.8 Billion in 2025 and is forecast to register an annual growth rate (CAGR) of 6.6% to reach $122.2 Billion by 2034.
The global Automotive Transmission Market Study analyzes and forecasts the market size across 6 regions and 24 countries for diverse segments -By Transmission (Automatic Transmission, Automated Manual Transmission, Dual-Clutch Transmission, Continuously Variable Transmission, Manual Transmission), By Number of forward gears (Up to 5, 6 to 8, 9 to 10, Above 10, CVT), By Vehicle (Passenger Car, LCVs, Trucks and Buses), By Fuel (Diesel, Gasoline, Alternate fuel), By Two-wheeler transmission (Manual, Automatic).
An Introduction to Automotive Transmission Market in 2025
The Automotive Transmission market is evolving rapidly as advancements in transmission technology drive improvements in vehicle performance, fuel efficiency, and driving experience. Transmissions, including manual, automatic, and continuously variable transmissions (CVTs), play a crucial role in transferring power from the engine to the wheels. Market growth is influenced by the rise of electric and hybrid vehicles, advancements in transmission design and materials, and increasing consumer demand for smooth and efficient driving experiences. Innovations such as dual-clutch transmissions and advanced transmission control systems are shaping the market. As automotive technology continues to advance, the demand for high-performance and reliable transmission solutions is expected to grow.
Automotive Transmission Competitive Landscape
The market report analyses the leading companies in the industry including Aisin Corp, Allison Transmissions, BorgWarner Inc, Eaton Corp, GKN Automotive Ltd, Hyundai Transys, JATCO Ltd, Magna International Inc, Schaeffler AG, Vitesco Technologies, ZF Friedrichshafen AG, and others.
Automotive Transmission Market Dynamics
Market Trend: Shift Towards Electrified Transmissions
A prominent trend in the automotive transmission market is the shift towards electrified transmissions, including hybrid and fully electric vehicle systems. As automakers increasingly focus on reducing emissions and improving fuel efficiency, there is a growing demand for transmissions that can support hybrid and electric powertrains. Electrified transmissions, such as continuously variable transmissions (CVTs) and dual-clutch transmissions (DCTs), are being developed to enhance performance and efficiency in electric and hybrid vehicles. This trend reflects the industry's broader transition towards sustainable and advanced automotive technologies, aiming to meet stringent environmental regulations and consumer preferences for greener vehicles.
Market Driver: Increasing Demand for Fuel Efficiency and Emissions Reduction
The primary driver of the automotive transmission market is the increasing demand for fuel efficiency and emissions reduction. With global regulations tightening on vehicle emissions and fuel economy standards becoming more stringent, there is a strong push for advanced transmission systems that can optimize engine performance and reduce fuel consumption. Automakers are investing in new transmission technologies, such as advanced DCTs and hybrid transmissions, to meet these regulatory requirements and offer more efficient vehicles. This driver is crucial as it aligns with the broader industry trend towards enhancing vehicle performance while minimizing environmental impact.
Market Opportunity: Expansion of Electric and Hybrid Vehicle Markets
A significant opportunity in the automotive transmission market lies in the expansion of the electric and hybrid vehicle markets. As consumer preference shifts towards electric and hybrid vehicles, there is an increasing need for transmission systems designed specifically for these powertrains. This growth offers opportunities for manufacturers to innovate and develop specialized transmissions that cater to the unique requirements of electric and hybrid vehicles, such as improved efficiency and integration with electric motors. By focusing on this segment, companies can tap into a burgeoning market and capitalize on the shift towards more sustainable automotive technologies.
Automotive Transmission Market Share Analysis: Automatic Transmission generated the highest revenue in 2024
In the Automotive Transmission market, the Automatic Transmission segment is the largest due to its widespread adoption and preference among consumers for its ease of use and convenience. Automatic transmissions, which shift gears automatically without driver intervention, offer a smoother driving experience and reduce driver fatigue, making them highly popular in passenger cars and light commercial vehicles. This segment benefits from advancements in technology that enhance fuel efficiency and performance while maintaining the convenience of automated gear shifting. The growing demand for comfort and ease of operation, coupled with improvements in automatic transmission technology such as more gears and adaptive systems, has cemented its position as the largest segment. As consumer preferences continue to shift towards vehicles that offer greater ease and driving comfort, automatic transmissions maintain a dominant market share.
Automotive Transmission Market Share Analysis: 6 to 8 Forward Gears is poised to register the fastest CAGR over the forecast period
In the Automotive Transmission market, the 6 to 8 forward gears segment is the fastest growing due to the increasing demand for improved performance and fuel efficiency in modern vehicles. Transmissions with six to eight gears provide better power distribution and fuel economy compared to those with fewer gears, as they allow the engine to operate within an optimal range more effectively. This gear range supports the trend towards more advanced and efficient vehicle designs, offering a balance between performance and fuel efficiency that appeals to a broad range of consumers. Additionally, the proliferation of advanced automatic and dual-clutch transmissions with six to eight gears aligns with the automotive industry's focus on enhancing driving dynamics and reducing emissions, driving rapid growth in this segment.
Automotive Transmission Market Share Analysis: Passenger Car generated the highest revenue in 2024
In the Automotive Transmission market, the Passenger Car segment is the largest due to the sheer volume of vehicles sold and the diverse range of transmission technologies utilized. Passenger cars represent the bulk of automotive sales worldwide, encompassing various transmission types such as automatic, manual, and continuously variable transmissions (CVTs). The high volume of passenger cars on the road and the continuous demand for innovations in vehicle performance, comfort, and fuel efficiency drive the size of this segment. Additionally, the passenger car market is influenced by consumer preferences for advanced transmission systems that enhance driving experience and efficiency, further contributing to its dominance in the automotive transmission market.
Automotive Transmission Market Share Analysis: Alternate Fuel is poised to register the fastest CAGR over the forecast period
In the Automotive Transmission market, the Alternate Fuel segment is the fastest growing due to the accelerating shift towards sustainable and environmentally friendly transportation solutions. With increasing regulatory pressures and consumer demand for greener alternatives, automotive manufacturers are investing in transmissions that support alternate fuels such as electric, hybrid, and hydrogen-powered vehicles. These transmissions are designed to accommodate the unique requirements of alternate fuel systems, such as energy regeneration and electric motor integration, driving rapid growth in this segment. Technological advancements and government incentives aimed at reducing carbon emissions further propel the adoption of alternate fuel vehicles, making this segment the fastest growing in the automotive transmission market.
Automotive Transmission Market Report scope
|
Parameter
|
Details
|
|
Market Size (2025)
|
$ 68.8 Billion
|
|
Market Size (2034)
|
$ 122.2 Billion
|
|
Market Growth Rate
|
6.6%
|
|
Segments
|
By Transmission (Automatic Transmission, Automated Manual Transmission, Dual-Clutch Transmission, Continuously Variable Transmission, Manual Transmission), By Number of forward gears (Up to 5, 6 to 8, 9 to 10, Above 10, CVT), By Vehicle (Passenger Car, LCVs, Trucks and Buses), By Fuel (Diesel, Gasoline, Alternate fuel), By Two-wheeler transmission (Manual, Automatic)
|
|
Study Period
|
2019- 2024 and 2025-2034
|
|
Units
|
Revenue (USD)
|
|
Qualitative Analysis
|
Porter’s Five Forces, SWOT Profile, Market Share, Scenario Forecasts, Market Ecosystem, Company Ranking, Market Dynamics, Industry Benchmarking
|
|
Companies
|
Aisin Corp, Allison Transmissions, BorgWarner Inc, Eaton Corp, GKN Automotive Ltd, Hyundai Transys, JATCO Ltd, Magna International Inc, Schaeffler AG, Vitesco Technologies, ZF Friedrichshafen AG
|
|
Countries
|
US, Canada, Mexico, Germany, France, Spain, Italy, UK, Russia, China, India, Japan, South Korea, Australia, South East Asia, Brazil, Argentina, Middle East, Africa
|
Automotive Transmission Market Segmentation
By Transmission
Automatic Transmission
Automated Manual Transmission
Dual-Clutch Transmission
Continuously Variable Transmission
Manual Transmission
By Number of forward gears
Up to 5
6 to 8
9 to 10
Above 10
CVT
By Vehicle
Passenger Car
LCVs
Trucks and Buses
By Fuel
Diesel
Gasoline
Alternate fuel
By Two-wheeler transmission
Manual
Automatic
Countries Analyzed
North America (US, Canada, Mexico)
Europe (Germany, UK, France, Spain, Italy, Russia, Rest of Europe)
Asia Pacific (China, India, Japan, South Korea, Australia, South East Asia, Rest of Asia)
South America (Brazil, Argentina, Rest of South America)
Middle East and Africa (Saudi Arabia, UAE, Rest of Middle East, South Africa, Egypt, Rest of Africa)
Automotive Transmission Companies Profiled in the Study
Aisin Corp
Allison Transmissions
BorgWarner Inc
Eaton Corp
GKN Automotive Ltd
Hyundai Transys
JATCO Ltd
Magna International Inc
Schaeffler AG
Vitesco Technologies
ZF Friedrichshafen AG
*- List Not Exhaustive
About USD Analytics
Table of Contents
List of Charts and Exhibits
List of Tables
1. Executive Summary
What’s New in 2025?
Top 10 Takeaways from the industry
Potential Opportunities for Industry Stakeholders
Strategic Imperatives
Company Market Positioning
Industry Benchmarking Matrix
2. Research Scope and Methodology
Market Definition
Market Segments
Companies Profiled
Research Methodology
Bottom-Up Method
Top-Down Method
Data Triangulation
Forecast Methodology
Data Sources
USDA Proprietary Databases
External Sources
Primary Research and Interviews
Conversion Rates for USD
Abbreviations
3. Strategic Landscape: Key Insights and Implications
Spotlight: Key Strategies opted by Business Leaders
Competitive Landscape
Market Size ($ Million) and Share (%) by Company, 2024
SWOT Analysis
- Key Market Strengths
- Key Market Weaknesses
- Potential Opportunities
- Potential Threats
Porter’s Five Force Analysis
- Summary
- Bargaining Power of Buyers- Impact Analysis
- Bargaining Power of Suppliers- Impact Analysis
- Threat of new entrants- Impact Analysis
- Intensity of Competitive Rivalry- Impact Analysis
Macro-Environmental Analysis
- Economic forecasts by Country, 2010- 2035
- Population forecasts by Country, 2010- 2035
- Inflation Outlook by Country, 2010-2035
- Impact of Russia-Ukraine Conflict, Sluggish China Growth, US Developments
5. Growth Opportunity Analysis
Trends at a Glance
- What are the most noteworthy trends in the market
- Where should leaders pay attention?
- What industries are likely to be affected by the growth?
Market Dynamics
- Charting a path forward
- Growth Drivers
- Growth Barriers
Key Industry Stakeholders
- Suppliers
- Manufacturers and Service Providers
- Distribution Channels
- End-Users and Applications
- Regulators
- Investors, Traders, and R&D Institutes
Regulatory Landscape
6. Market Size Outlook to 2034
Global Nanocoatings Market Size Forecast, USD Million, 2018- 2034
- Historic Market Size, 2018- 2024
- Forecast Market Size, 2024- 2034
Scenario Analysis
- Low Growth Scenario: Definition and Outlook to 2034
- Reference Case: Definition and Outlook to 2034
- High Growth Scenario: Definition and Outlook to 2034
Pricing Analysis and Outlook
- Nanocoatings Average Price Forecast, 2021- 2034
- Key Factors Shaping the Pricing Patterns
7. Historical Nanocoatings Market Size by Segments, 2018- 2024
Key Statistics, 2024
Nanocoatings Market Size Outlook by Type, USD Million, 2018- 2024
Growth Comparison (y-o-y) across Nanocoatings Types, 2018- 2024
Nanocoatings Market Size Outlook by Application, USD Million, 2018- 2024
Growth Comparison (y-o-y) across Nanocoatings Applications, 2018- 2024
8. Nanocoatings Market Size Outlook by Segments, 2024- 2034
By Transmission
Automatic Transmission
Automated Manual Transmission
Dual-Clutch Transmission
Continuously Variable Transmission
Manual Transmission
By Number of forward gears
Up to 5
6 to 8
9 to 10
Above 10
CVT
By Vehicle
Passenger Car
LCVs
Trucks and Buses
By Fuel
Diesel
Gasoline
Alternate fuel
By Two-wheeler transmission
Manual
Automatic
9. Nanocoatings Market Size Outlook by Region
North America
Key Market Dynamics
North America Nanocoatings Market Size Outlook by Type, USD Million, 2021-2034
North America Nanocoatings Market Size Outlook by Application, USD Million, 2021-2034
North America Nanocoatings Market Size Outlook by Sales Channel, USD Million, 2021-2034
North America Nanocoatings Market Size Outlook by Country, USD Million, 2021-2034
Europe
Key Market Dynamics
Europe Nanocoatings Market Size Outlook by Type, USD Million, 2021-2034
Europe Nanocoatings Market Size Outlook by Application, USD Million, 2021-2034
Europe Nanocoatings Market Size Outlook by Sales Channel, USD Million, 2021-2034
Europe Nanocoatings Market Size Outlook by Country, USD Million, 2021-2034
Asia Pacific
Key Market Dynamics
Asia Pacific Nanocoatings Market Size Outlook by Type, USD Million, 2021-2034
Asia Pacific Nanocoatings Market Size Outlook by Application, USD Million, 2021-2034
Asia Pacific Nanocoatings Market Size Outlook by Sales Channel, USD Million, 2021-2034
Asia Pacific Nanocoatings Market Size Outlook by Country, USD Million, 2021-2034
South America
Key Market Dynamics
South America Nanocoatings Market Size Outlook by Type, USD Million, 2021-2034
South America Nanocoatings Market Size Outlook by Application, USD Million, 2021-2034
South America Nanocoatings Market Size Outlook by Sales Channel, USD Million, 2021-2034
South America Nanocoatings Market Size Outlook by Country, USD Million, 2021-2034
Middle East and Africa
Key Market Dynamics
Middle East and Africa Nanocoatings Market Size Outlook by Type, USD Million, 2021-2034
Middle East and Africa Nanocoatings Market Size Outlook by Application, USD Million, 2021-2034
Middle East and Africa Nanocoatings Market Size Outlook by Sales Channel, USD Million, 2021-2034
Middle East and Africa Nanocoatings Market Size Outlook by Country, USD Million, 2021-2034
10. United States Nanocoatings Market Analysis and Outlook, 2021- 2034
Key Statistics
United States Nanocoatings Market Size Outlook by Type, 2021- 2034
United States Nanocoatings Market Size Outlook by Application, 2021- 2034
United States Nanocoatings Market Size Outlook by End-User, 2021- 2034
11. Canada Nanocoatings Market Analysis and Outlook, 2021- 2034
Key Statistics
Canada Nanocoatings Market Size Outlook by Type, 2021- 2034
Canada Nanocoatings Market Size Outlook by Application, 2021- 2034
Canada Nanocoatings Market Size Outlook by End-User, 2021- 2034
12. Mexico Nanocoatings Market Analysis and Outlook, 2021- 2034
Key Statistics
Mexico Nanocoatings Market Size Outlook by Type, 2021- 2034
Mexico Nanocoatings Market Size Outlook by Application, 2021- 2034
Mexico Nanocoatings Market Size Outlook by End-User, 2021- 2034
13. Germany Nanocoatings Market Analysis and Outlook, 2021- 2034
Key Statistics
Germany Nanocoatings Market Size Outlook by Type, 2021- 2034
Germany Nanocoatings Market Size Outlook by Application, 2021- 2034
Germany Nanocoatings Market Size Outlook by End-User, 2021- 2034
14. France Nanocoatings Market Analysis and Outlook, 2021- 2034
Key Statistics
France Nanocoatings Market Size Outlook by Type, 2021- 2034
France Nanocoatings Market Size Outlook by Application, 2021- 2034
France Nanocoatings Market Size Outlook by End-User, 2021- 2034
15. United Kingdom Nanocoatings Market Analysis and Outlook, 2021- 2034
Key Statistics
United Kingdom Nanocoatings Market Size Outlook by Type, 2021- 2034
United Kingdom Nanocoatings Market Size Outlook by Application, 2021- 2034
United Kingdom Nanocoatings Market Size Outlook by End-User, 2021- 2034
16. Spain Nanocoatings Market Analysis and Outlook, 2021- 2034
Key Statistics
Spain Nanocoatings Market Size Outlook by Type, 2021- 2034
Spain Nanocoatings Market Size Outlook by Application, 2021- 2034
Spain Nanocoatings Market Size Outlook by End-User, 2021- 2034
17. Italy Nanocoatings Market Analysis and Outlook, 2021- 2034
Key Statistics
Italy Nanocoatings Market Size Outlook by Type, 2021- 2034
Italy Nanocoatings Market Size Outlook by Application, 2021- 2034
Italy Nanocoatings Market Size Outlook by End-User, 2021- 2034
18. Benelux Nanocoatings Market Analysis and Outlook, 2021- 2034
Key Statistics
Benelux Nanocoatings Market Size Outlook by Type, 2021- 2034
Benelux Nanocoatings Market Size Outlook by Application, 2021- 2034
Benelux Nanocoatings Market Size Outlook by End-User, 2021- 2034
19. Nordic Nanocoatings Market Analysis and Outlook, 2021- 2034
Key Statistics
Nordic Nanocoatings Market Size Outlook by Type, 2021- 2034
Nordic Nanocoatings Market Size Outlook by Application, 2021- 2034
Nordic Nanocoatings Market Size Outlook by End-User, 2021- 2034
20. Rest of Europe Nanocoatings Market Analysis and Outlook, 2021- 2034
Key Statistics
Rest of Europe Nanocoatings Market Size Outlook by Type, 2021- 2034
Rest of Europe Nanocoatings Market Size Outlook by Application, 2021- 2034
Rest of Europe Nanocoatings Market Size Outlook by End-User, 2021- 2034
21. China Nanocoatings Market Analysis and Outlook, 2021- 2034
Key Statistics
China Nanocoatings Market Size Outlook by Type, 2021- 2034
China Nanocoatings Market Size Outlook by Application, 2021- 2034
China Nanocoatings Market Size Outlook by End-User, 2021- 2034
22. India Nanocoatings Market Analysis and Outlook, 2021- 2034
Key Statistics
India Nanocoatings Market Size Outlook by Type, 2021- 2034
India Nanocoatings Market Size Outlook by Application, 2021- 2034
India Nanocoatings Market Size Outlook by End-User, 2021- 2034
23. Japan Nanocoatings Market Analysis and Outlook, 2021- 2034
Key Statistics
Japan Nanocoatings Market Size Outlook by Type, 2021- 2034
Japan Nanocoatings Market Size Outlook by Application, 2021- 2034
Japan Nanocoatings Market Size Outlook by End-User, 2021- 2034
24. South Korea Nanocoatings Market Analysis and Outlook, 2021- 2034
Key Statistics
South Korea Nanocoatings Market Size Outlook by Type, 2021- 2034
South Korea Nanocoatings Market Size Outlook by Application, 2021- 2034
South Korea Nanocoatings Market Size Outlook by End-User, 2021- 2034
25. Australia Nanocoatings Market Analysis and Outlook, 2021- 2034
Key Statistics
Australia Nanocoatings Market Size Outlook by Type, 2021- 2034
Australia Nanocoatings Market Size Outlook by Application, 2021- 2034
Australia Nanocoatings Market Size Outlook by End-User, 2021- 2034
26. South East Asia Nanocoatings Market Analysis and Outlook, 2021- 2034
Key Statistics
South East Asia Nanocoatings Market Size Outlook by Type, 2021- 2034
South East Asia Nanocoatings Market Size Outlook by Application, 2021- 2034
South East Asia Nanocoatings Market Size Outlook by End-User, 2021- 2034
27. Rest of Asia Pacific Nanocoatings Market Analysis and Outlook, 2021- 2034
Key Statistics
Rest of Asia Pacific Nanocoatings Market Size Outlook by Type, 2021- 2034
Rest of Asia Pacific Nanocoatings Market Size Outlook by Application, 2021- 2034
Rest of Asia Pacific Nanocoatings Market Size Outlook by End-User, 2021- 2034
28. Brazil Nanocoatings Market Analysis and Outlook, 2021- 2034
Key Statistics
Brazil Nanocoatings Market Size Outlook by Type, 2021- 2034
Brazil Nanocoatings Market Size Outlook by Application, 2021- 2034
Brazil Nanocoatings Market Size Outlook by End-User, 2021- 2034
29. Argentina Nanocoatings Market Analysis and Outlook, 2021- 2034
Key Statistics
Argentina Nanocoatings Market Size Outlook by Type, 2021- 2034
Argentina Nanocoatings Market Size Outlook by Application, 2021- 2034
Argentina Nanocoatings Market Size Outlook by End-User, 2021- 2034
30. Rest of South America Nanocoatings Market Analysis and Outlook, 2021- 2034
Key Statistics
Rest of South America Nanocoatings Market Size Outlook by Type, 2021- 2034
Rest of South America Nanocoatings Market Size Outlook by Application, 2021- 2034
Rest of South America Nanocoatings Market Size Outlook by End-User, 2021- 2034
31. United Arab Emirates Nanocoatings Market Analysis and Outlook, 2021- 2034
Key Statistics
United Arab Emirates Nanocoatings Market Size Outlook by Type, 2021- 2034
United Arab Emirates Nanocoatings Market Size Outlook by Application, 2021- 2034
United Arab Emirates Nanocoatings Market Size Outlook by End-User, 2021- 2034
32. Saudi Arabia Nanocoatings Market Analysis and Outlook, 2021- 2034
Key Statistics
Saudi Arabia Nanocoatings Market Size Outlook by Type, 2021- 2034
Saudi Arabia Nanocoatings Market Size Outlook by Application, 2021- 2034
Saudi Arabia Nanocoatings Market Size Outlook by End-User, 2021- 2034
33. Rest of Middle East Nanocoatings Market Analysis and Outlook, 2021- 2034
Key Statistics
Rest of Middle East Nanocoatings Market Size Outlook by Type, 2021- 2034
Rest of Middle East Nanocoatings Market Size Outlook by Application, 2021- 2034
Rest of Middle East Nanocoatings Market Size Outlook by End-User, 2021- 2034
34. South Africa Nanocoatings Market Analysis and Outlook, 2021- 2034
Key Statistics
South Africa Nanocoatings Market Size Outlook by Type, 2021- 2034
South Africa Nanocoatings Market Size Outlook by Application, 2021- 2034
South Africa Nanocoatings Market Size Outlook by End-User, 2021- 2034
35. Rest of Africa Nanocoatings Market Analysis and Outlook, 2021- 2034
Key Statistics
Rest of Africa Nanocoatings Market Size Outlook by Type, 2021- 2034
Rest of Africa Nanocoatings Market Size Outlook by Application, 2021- 2034
Rest of Africa Nanocoatings Market Size Outlook by End-User, 2021- 2034
36. Key Companies
Market Share Analysis
Aisin Corp
Allison Transmissions
BorgWarner Inc
Eaton Corp
GKN Automotive Ltd
Hyundai Transys
JATCO Ltd
Magna International Inc
Schaeffler AG
Vitesco Technologies
ZF Friedrichshafen AG
Company Benchmarking
Financial Analysis
37. Recent Market Developments
38. Appendix
Looking Ahead
Research Methodology
Legal Disclaimer
