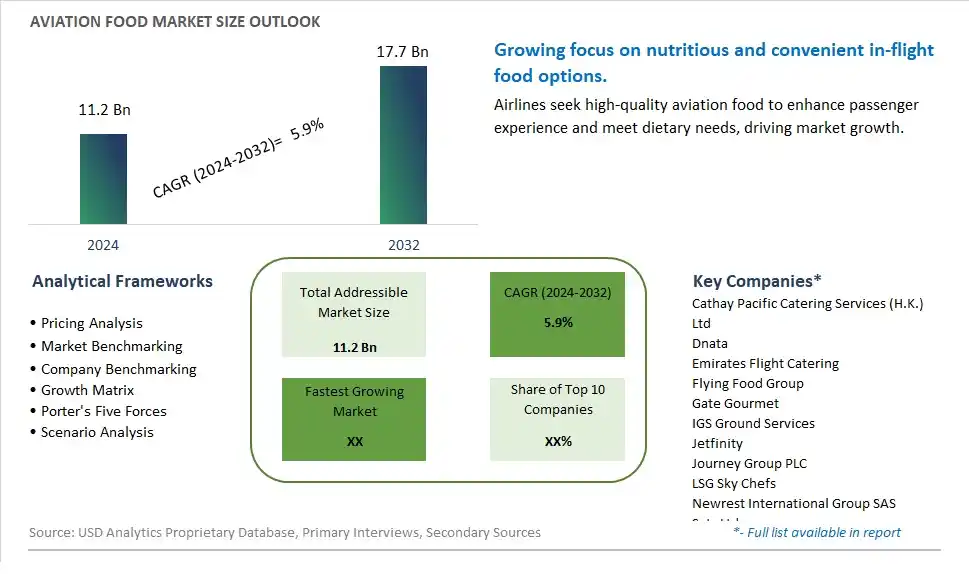
Global Aviation Food Market Size is valued at $11.2 Billion in 2024 and is forecast to register a growth rate (CAGR) of 5.9% to reach $17.7 Billion by 2032.
The global Aviation Food Market Comprehensive Study analyzes and forecasts the market size across 6 regions and 24 countries for diverse segments -By Type (Meals, Bakery and Confectionary, Beverages, Others), By Application (Economy Class, Business Class, First Class, Others)
An Introduction to Aviation Food Market
In 2024, the Aviation Food market is expanding rapidly, fueled by the growing emphasis on enhancing passenger experience and the increasing diversity of dietary needs among travelers. The market encompasses a wide range of food products designed specifically for consumption during flights, including main courses, snacks, and special dietary meals. Advances in food safety, packaging, and storage technologies are ensuring that aviation food maintains its quality and taste at high altitudes. The market is also benefiting from the trend towards healthier, fresher, and more varied meal options, as airlines strive to cater to health-conscious passengers and those with specific dietary requirements.
Aviation Food Competitive Landscape
The market report analyses the leading companies in the industry including Cathay Pacific Catering Services (H.K.) Ltd, Dnata, Emirates Flight Catering, Flying Food Group, Gate Gourmet, IGS Ground Services, Jetfinity, Journey Group PLC, LSG Sky Chefs, Newrest International Group SAS, Sats Ltd, and Others.
Aviation Food Market Dynamics
Aviation Food Market Trend: Shift Towards Healthier and Diverse Food Options
The most prominent market trend for Aviation Food is the ongoing shift towards healthier and diverse food options for air travelers. As passengers become more health-conscious and mindful of their dietary choices, airlines and catering providers are responding by offering a wider range of nutritious meals, vegetarian and vegan options, gluten-free alternatives, and allergen-free menus. This trend reflects the growing demand for healthier inflight dining experiences that cater to various dietary preferences and restrictions, aligning with consumer expectations for quality and customization in aviation food services.
Aviation Food Market Driver: Customer Experience and Brand Differentiation
A key market driver for Aviation Food is the focus on customer experience and brand differentiation within the airline industry. In an increasingly competitive market, airlines are leveraging inflight dining as a strategic tool to enhance passenger satisfaction, loyalty, and brand perception. By partnering with reputable chefs, culinary experts, and food suppliers, airlines can elevate their food offerings, create signature menus, and showcase local flavors, cultural cuisines, and seasonal ingredients, driving demand for premium and memorable dining experiences that set them apart from competitors.
Aviation Food Market Opportunity: Premiumization and Culinary Innovation
A potential opportunity within the Aviation Food market lies in premiumization and culinary innovation to elevate inflight dining experiences. Collaborating with renowned chefs, celebrity food influencers, and hospitality experts can bring creativity, authenticity, and culinary expertise to onboard menus, offering passengers a taste of gourmet dining at altitude. Additionally, incorporating sustainability practices, eco-friendly packaging, and farm-to-table sourcing can appeal to environmentally conscious travelers and contribute to a more sustainable aviation food ecosystem. By embracing premiumization and culinary innovation, airlines and catering providers can seize opportunities to attract discerning travelers, enhance brand value, and drive growth in the aviation food market.
Aviation Food Market Share Analysis: Meals segment generated the highest revenue share in the industry
The largest segment in the Aviation Food Market is Meals. This segment encompasses a wide range of food options specifically designed for consumption during air travel. Meals in aviation catering are meticulously crafted to meet the unique challenges of serving food at high altitudes while ensuring quality, taste, and safety. They often include a variety of dishes catering to different dietary preferences and restrictions, such as vegetarian, vegan, gluten-free, and halal options, to accommodate the diverse needs of passengers. Meals are a critical component of the overall passenger experience, contributing significantly to customer satisfaction and loyalty. Airlines and catering companies continuously innovate within this segment, introducing new menu offerings, enhancing food presentation, and improving the overall dining experience onboard. As air travel continues to rebound and passenger numbers increase, the Meals segment is expected to maintain its dominance in the Aviation Food Market, driven by the ongoing demand for high-quality and diverse food options during flights.
Aviation Food Market Share Analysis: Economy Class is the fastest growing segment over the forecast period to 2032
The fastest-growing segment in the Aviation Food Market is Economy Class. This segment represents the meals and food offerings specifically tailored for passengers traveling in economy class on airlines. With the increasing popularity of air travel and the expansion of budget airlines offering affordable fares, the number of passengers flying in economy class has surged significantly. As a result, there is a growing demand for cost-effective yet quality food options that meet the taste preferences and dietary needs of economy class travelers. Airlines and catering services are focusing on enhancing the variety, nutritional value, and overall quality of meals served in economy class to improve the overall passenger experience. Additionally, advancements in food packaging and preservation technologies ensure that meals remain fresh and appetizing throughout the flight duration. The Economy Class segment is poised for rapid growth as airlines strive to differentiate their services and attract more passengers, especially in the context of the post-pandemic recovery phase in the aviation industry.
Aviation Food Market Segmentation
By Type
Meals
Bakery and Confectionary
Beverages
Others
By Application
Economy Class
Business Class
First Class
Others
Countries Analyzed
North America (US, Canada, Mexico)
Europe (Germany, UK, France, Spain, Italy, Russia, Rest of Europe)
Asia Pacific (China, India, Japan, South Korea, Australia, South East Asia, Rest of Asia)
South America (Brazil, Argentina, Rest of South America)
Middle East and Africa (Saudi Arabia, UAE, Rest of Middle East, South Africa, Egypt, Rest of Africa)
Aviation Food Companies Profiled in the Study
Cathay Pacific Catering Services (H.K.) Ltd
Dnata
Emirates Flight Catering
Flying Food Group
Gate Gourmet
IGS Ground Services
Jetfinity
Journey Group PLC
LSG Sky Chefs
Newrest International Group SAS
Sats Ltd
*- List Not Exhaustive
Chapter 1. TABLE OF CONTENTS
Chapter 2. Introduction to Aviation Food Market
2.1. Market Overview
2.2. Key Statistics and Report Highlights
2.3. Scope of the Comprehensive Study
2.3.1. Market Definition
2.3.2 Countries and Regions Covered
2.3.3 Research Objective
2.3.4 Units, Currency, and Conversions
2.3.5 Industry Value Chain
2.4. Key Market Segments
2.5. Key Companies
2.6. Study Period
Chapter 3. Strategic Analysis Review
3.1. Aviation Food Pricing Analysis and Forecast
3.2. Porter’s Five Forces
3.3. Market Ecosystem
3.4. SWOT Analysis
3.5. Regulatory Scenario
3.3. Effects of Inflation, Russia-Ukraine War, moderating economic growth, and other macroeconomic factors
Chapter 4. Competitive Landscape
4.1. Market Share Analysis
4.1.1. Global Aviation Food Market Share by Company, 2023
4.1.2. Product Offerings of Leading Aviation Food Companies
4.2. Market Entropy
4.2.1. New Product Launches in the Industry
4.2.2. Mergers, Acquisitions, Joint ventures, and Partnerships
4.3. Key Strategies and Best Practices
Chapter 5. Global Market Projections: Best, Reference, and Low Case Scenarios
5.1. Growth Analysis- Case Scenario Definitions
5.2. Low Growth Case Scenario Forecasts
5.3. Reference Growth Case Scenario Forecasts
5.4. High Growth Case Scenario Forecasts
Chapter 6. Market Dynamics
6.1. Aviation Food Market Drivers
6.2. Aviation Food Market Challenges
6.6. Aviation Food Market Opportunities
6.4. Aviation Food Market Trends
Chapter 7. Global Aviation Food Market Outlook Trends
7.1. Global Aviation Food Revenue (USD Million) and CAGR (%) by Type (2021-2032)
7.2. Global Aviation Food Revenue (USD Million) and CAGR (%) by Application (2021-2032)
7.3. Global Aviation Food Revenue (USD Million) and CAGR (%) by Product (2021-2032)
By Type
Meals
Bakery and Confectionary
Beverages
Others
By Application
Economy Class
Business Class
First Class
Others
Chapter 8. Global Aviation Food Regional Analysis and Outlook
8.1. Global Aviation Food Revenue (USD Million) By Regions (2021- 2032)
8.2. North America Aviation Food Revenue (USD Million) by Country (2021-2032)
8.2.1. United States Aviation Food Regional Analysis and Outlook
8.2.2. Canada Aviation Food Regional Analysis and Outlook
8.2.3. Mexico Aviation Food Regional Analysis and Outlook
8.3. Europe Aviation Food Revenue (USD Million), by Country (2021-2032)
8.3.1. Germany Aviation Food Regional Analysis and Outlook
8.3.2. France Aviation Food Regional Analysis and Outlook
8.3.3. United Kingdom Aviation Food Regional Analysis and Outlook
8.3.4. Spain Aviation Food Regional Analysis and Outlook
8.3.5. Italy Aviation Food Regional Analysis and Outlook
8.3.6. Russia Aviation Food Regional Analysis and Outlook
8.3.7. Rest of Europe Aviation Food Regional Analysis and Outlook
8.4. Asia Pacific Aviation Food Revenue (USD Million) by Country (2021-2032)
8.4.1. China Aviation Food Regional Analysis and Outlook
8.4.2. Japan Aviation Food Regional Analysis and Outlook
8.4.3. India Aviation Food Regional Analysis and Outlook
8.4.4. South Korea Aviation Food Regional Analysis and Outlook
8.4.5. Australia Aviation Food Regional Analysis and Outlook
8.4.6. South East Asia Aviation Food Regional Analysis and Outlook
8.4.7. Rest of Asia Pacific Aviation Food Regional Analysis and Outlook
8.5. South America Aviation Food Revenue (USD Million), by Country (2021-2032)
8.5.1. Brazil Aviation Food Regional Analysis and Outlook
8.5.2. Argentina Aviation Food Regional Analysis and Outlook
8.5.3. Rest of South America Aviation Food Regional Analysis and Outlook
8.6. Middle East and Africa Aviation Food Revenue (USD Million) by Country (2021-2032)
8.6.1. Middle East Aviation Food Regional Analysis and Outlook
8.6.2. Africa Aviation Food Regional Analysis and Outlook
Chapter 9. North America Aviation Food Analysis and Outlook
9.1. North America Aviation Food Revenue (USD Million) by Segments (2021-2032)
9.1.1. North America Aviation Food Revenue (USD Million) by Type (2021-2032)
9.1.2. North America Aviation Food Revenue (USD Million) by Application (2021-2032)
9.1.3. North America Aviation Food Revenue (USD Million) by Product (2021-2032)
By Type
Meals
Bakery and Confectionary
Beverages
Others
By Application
Economy Class
Business Class
First Class
Others
Chapter 10. Europe Aviation Food Analysis and Outlook
10.1. Europe Aviation Food Revenue (USD Million), by Segments (USD Million) (2021-2032)
10.1.1. Europe Aviation Food Revenue (USD Million) by Type (2021-2032)
10.1.2. Europe Aviation Food Revenue (USD Million) by Application (2021-2032)
10.1.3. Europe Aviation Food Revenue (USD Million) by Product (2021-2032)
By Type
Meals
Bakery and Confectionary
Beverages
Others
By Application
Economy Class
Business Class
First Class
Others
Chapter 11. Asia Pacific Aviation Food Analysis and Outlook
11.1. Asia Pacific Aviation Food Revenue (USD Million), and Revenue (USD Million) by Segments (2021-2032)
11.1.1. Asia Pacific Aviation Food Revenue (USD Million) by Type (2021-2032)
11.1.2. Asia Pacific Aviation Food Revenue (USD Million) by Application (2021-2032)
11.1.3. Asia Pacific Aviation Food Revenue (USD Million) by Product (2021-2032)
By Type
Meals
Bakery and Confectionary
Beverages
Others
By Application
Economy Class
Business Class
First Class
Others
Chapter 12. South America Aviation Food Analysis and Outlook
12.1. South America Aviation Food Revenue (USD Million), by Segments (2021-2032)
12.1.1. South America Aviation Food Revenue (USD Million) by Type (2021-2032)
12.1.2. South America Aviation Food Revenue (USD Million) by Application (2021-2032)
12.1.3. South America Aviation Food Revenue (USD Million) by Product (2021-2032)
By Type
Meals
Bakery and Confectionary
Beverages
Others
By Application
Economy Class
Business Class
First Class
Others
Chapter 13. Middle East and Africa Aviation Food Analysis and Outlook
13.1. Middle East and Africa Aviation Food Revenue (USD Million), by Segments (2021-2032)
13.1.1. Middle East and Africa Aviation Food Revenue (USD Million) by Type (2021-2032)
13.1.2. Middle East and Africa Aviation Food Revenue (USD Million) by Application (2021-2032)
13.1.3. Middle East and Africa Aviation Food Revenue (USD Million) by Product (2021-2032)
By Type
Meals
Bakery and Confectionary
Beverages
Others
By Application
Economy Class
Business Class
First Class
Others
Chapter 14. Aviation Food Company Profiles
14.1 Business Overview
14.2 Product Profiles
14.3 SWOT Profiles
14.5 Recent Developments
14.6 Financial Profile
List of Companies
Cathay Pacific Catering Services (H.K.) Ltd
Dnata
Emirates Flight Catering
Flying Food Group
Gate Gourmet
IGS Ground Services
Jetfinity
Journey Group PLC
LSG Sky Chefs
Newrest International Group SAS
Sats Ltd
15. Methodology and Data Sources
15.1 Customization Offerings
15.2 Subscription Services
15.3 Related Reports
15.4 Publisher Expertise
LIST OF TABLES
Table 1 Market Segmentation Analysis
Table 2 Global Aviation Food Market Share of Leading Companies, 2023
Table 3 Product Offerings of Leading Companies
Table 4 Low Growth Scenario Forecasts
Table 5 Reference Case Growth Scenario
Table 6 High Growth Case Scenario
Table 7 Global Aviation Food Revenue (USD Million) And CAGR (%) By Type (2021-2032)
Table 8 Global Aviation Food Revenue (USD Million) And CAGR (%) By Application (2021-2032)
Table 9 Global Aviation Food Revenue (USD Million) And CAGR (%) By Product (2021-2032)
Table 10 Global Aviation Food Market Revenue (USD Million) By Regions (2021-2032)
Table 11 Global Aviation Food Market Share (%) By Regions (2021-2032)
Table 12 North America Aviation Food Revenue (USD Million) By Country (2021-2032)
Table 13 Europe Aviation Food Revenue (USD Million) By Country (2021-2032)
Table 14 Asia Pacific Aviation Food Revenue (USD Million) By Country (2021-2032)
Table 15 South America Aviation Food Revenue (USD Million) By Country (2021-2032)
Table 16 Middle East and Africa Aviation Food Revenue (USD Million) By Region (2021-2032)
Table 17 North America Aviation Food Revenue (USD Million) By Type (2021-2032)
Table 18 North America Aviation Food Revenue (USD Million) By Application (2021-2032)
Table 19 North America Aviation Food Revenue (USD Million) By Product (2021-2032)
Table 20 Europe Aviation Food Revenue (USD Million) By Type (2021-2032)
Table 21 Europe Aviation Food Revenue (USD Million) By Application (2021-2032)
Table 22 Europe Aviation Food Revenue (USD Million) By Product (2021-2032)
Table 23 Asia Pacific Aviation Food Revenue (USD Million) By Type (2021-2032)
Table 24 Asia Pacific Aviation Food Revenue (USD Million) By Application (2021-2032)
Table 25 Asia Pacific Aviation Food Revenue (USD Million) By Product (2021-2032)
Table 26 South America Aviation Food Revenue (USD Million) By Type (2021-2032)
Table 27 South America Aviation Food Revenue (USD Million) By Application (2021-2032)
Table 28 South America Aviation Food Revenue (USD Million) By Product (2021-2032)
Table 29 Middle East and Africa Aviation Food Revenue (USD Million) By Type (2021-2032)
Table 30 Middle East and Africa Aviation Food Revenue (USD Million) By Application (2021-2032)
Table 31 Middle East and Africa Aviation Food Revenue (USD Million) By Product (2021-2032)
LIST OF FIGURES
Figure 1. Market Scope
Figure 2. Pricing Forecasts Per Unit, 2023- 2032
Figure 3. Porter’s Five Forces
Figure 4. Global Aviation Food Market Revenue (USD Million) By Regions (2021-2032)
Figure 5. Global Aviation Food Market Share (%) By Regions (2023)
Figure 6. North America Aviation Food Revenue (USD Million) By Country (2021-2032)
Figure 7. United States Aviation Food Revenue (USD Million) By Country (2021-2032)
Figure 8. Canada Aviation Food Revenue (USD Million) By Country (2021-2032)
Figure 9. Mexico Aviation Food Revenue (USD Million) By Country (2021-2032)
Figure 10. Europe Aviation Food Revenue (USD Million) By Country (2021-2032)
Figure 11. Germany Aviation Food Revenue (USD Million) By Country (2021-2032)
Figure 12. France Aviation Food Revenue (USD Million) By Country (2021-2032)
Figure 13. United Kingdom Aviation Food Revenue (USD Million) By Country (2021-2032)
Figure 14. Spain Aviation Food Revenue (USD Million) By Country (2021-2032)
Figure 15. Italy Aviation Food Revenue (USD Million) By Country (2021-2032)
Figure 16. Russia Aviation Food Revenue (USD Million) By Country (2021-2032)
Figure 17. Rest of Europe Aviation Food Revenue (USD Million) By Country (2021-2032)
Figure 11. Asia Pacific Aviation Food Revenue (USD Million) By Country (2021-2032)
Figure 12. China Aviation Food Revenue (USD Million) By Country (2021-2032)
Figure 13. Japan Aviation Food Revenue (USD Million) By Country (2021-2032)
Figure 14. India Aviation Food Revenue (USD Million) By Country (2021-2032)
Figure 15. South Korea Aviation Food Revenue (USD Million) By Country (2021-2032)
Figure 16. Australia Aviation Food Revenue (USD Million) By Country (2021-2032)
Figure 17. South East Asia Aviation Food Revenue (USD Million) By Country (2021-2032)
Figure 18. South America Aviation Food Revenue (USD Million) By Country (2021-2032)
Figure 19. Brazil Aviation Food Revenue (USD Million) By Country (2021-2032)
Figure 20. Argentina Aviation Food Revenue (USD Million) By Country (2021-2032)
Figure 21. Rest of Asia Pacific Aviation Food Revenue (USD Million) By Country (2021-2032)
Figure 22. Middle East and Africa Aviation Food Revenue (USD Million) By Region (2021-2032)
Figure 23. Saudi Arabia Aviation Food Revenue (USD Million) By Region (2021-2032)
Figure 24. The UAE Aviation Food Revenue (USD Million) By Region (2021-2032)
Figure 25. Rest of Middle East Aviation Food Revenue (USD Million) By Region (2021-2032)
Figure 26. South Africa Aviation Food Revenue (USD Million) By Region (2021-2032)
Figure 27. Africa Aviation Food Revenue (USD Million) By Region (2021-2032)
Figure 28. North America Aviation Food Revenue (USD Million) By Type (2021-2032)
Figure 29. North America Aviation Food Revenue (USD Million) By Application (2021-2032)
Figure 30. North America Aviation Food Revenue (USD Million) By Product (2021-2032)
Figure 31. Europe Aviation Food Revenue (USD Million) By Type (2021-2032)
Figure 32. Europe Aviation Food Revenue (USD Million) By Application (2021-2032)
Figure 33. Europe Aviation Food Revenue (USD Million) By Product (2021-2032)
Figure 34. Asia Pacific Aviation Food Revenue (USD Million) By Type (2021-2032)
Figure 35. Asia Pacific Aviation Food Revenue (USD Million) By Application (2021-2032)
Figure 36. Asia Pacific Aviation Food Revenue (USD Million) By Product (2021-2032)
Figure 37. South America Aviation Food Revenue (USD Million) By Type (2021-2032)
Figure 38. South America Aviation Food Revenue (USD Million) By Application (2021-2032)
Figure 39. South America Aviation Food Revenue (USD Million) By Product (2021-2032)
Figure 40. Middle East and Africa Aviation Food Revenue (USD Million) By Type (2021-2032)
Figure 41. Middle East and Africa Aviation Food Revenue (USD Million) By Application (2021-2032)
Figure 42. Middle East and Africa Aviation Food Revenue (USD Million) By Product (2021-2032)
By Type
Meals
Bakery and Confectionary
Beverages
Others
By Application
Economy Class
Business Class
First Class
Others
Countries Analyzed
North America (US, Canada, Mexico)
Europe (Germany, UK, France, Spain, Italy, Russia, Rest of Europe)
Asia Pacific (China, India, Japan, South Korea, Australia, South East Asia, Rest of Asia)
South America (Brazil, Argentina, Rest of South America)
Middle East and Africa (Saudi Arabia, UAE, Rest of Middle East, South Africa, Egypt, Rest of Africa)
