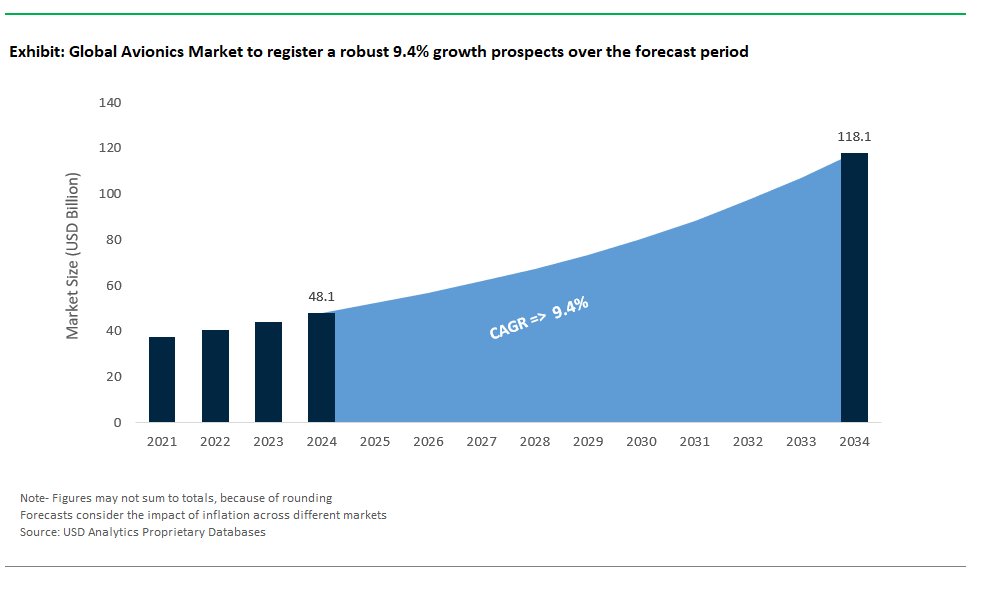
Global Avionics Market Size is valued at $48.1 Billion in 2024 and is forecast to register a growth rate (CAGR) of 9.4% to reach $118.1 Billion by 2034.
The market growth is driven by an increasing rise in urban air mobility represents a significant trend driving the avionics market. UAM solutions, including electric vertical takeoff and landing (eVTOL) aircraft and air taxis, require advanced avionics systems tailored for urban airspace management, traffic coordination, and integration with existing air traffic control infrastructure. Avionics manufacturers are developing lightweight, compact, and efficient systems to support the safe and reliable operation of UAM vehicles, facilitating the transition toward sustainable urban transportation solutions. Leading Companies focusing on Advanced Cockpit Technologies, Autonomous Flight Systems, Enhanced Connectivity and Data Analytics, and others to boost market shares in the industry.
Avionics Market Overview
The avionics market encompasses a wide array of electronic systems crucial for aircraft navigation, communication, and control. It is driven by factors such as increasing air traffic, demand for modernization, and regulatory mandates. Advancements in technology, including digitalization and automation, are reshaping the market, leading to the integration of satellite-based navigation and communication systems, as well as the development of autonomous capabilities. Major players like Honeywell Aerospace, Collins Aerospace, and Thales Group dominate the market, facing challenges such as regulatory compliance and cybersecurity threats. Yet, opportunities exist for innovation and expansion into emerging sectors like urban air mobility and unmanned aerial systems.
Avionics Market Dynamics
Avionics Market Trends- Dive into the transformative power of next-generation avionics as they revolutionize flight and reshape the aviation landscape.
Embark on an exploration of the transformative world of next-generation avionics, where technological breakthroughs are fundamentally changing the way we fly and shaping the aviation landscape. Through advancements in digitalization, automation, and connectivity, modern avionics systems are pushing the boundaries of safety, efficiency, and operational capabilities. Immerse yourself in the seamless integration of satellite-based navigation, sophisticated flight management systems, and immersive augmented reality displays, empowering pilots with unparalleled situational awareness and decision-making prowess. Dive into the realm of autonomous flight systems and artificial intelligence, where unmanned aerial vehicles soar with precision and independence, unlocking new frontiers in aerial transportation and surveillance. Experience firsthand the convergence of data analytics, predictive maintenance, and real-time communication, optimizing fleet performance, minimizing downtime, and revolutionizing the passenger experience. Welcome to the dawn of the next-generation avionics era, where innovation knows no bounds and the future of flight is at our fingertips.
Avionics Market Driver- The avionics market is surging due to the growing demand for automation and autonomy in-flight systems.
The rise in demand for automation and autonomy within in-flight systems is fueling the growth of the avionics market. Technological advancements have led to a noticeable shift towards incorporating automated features and autonomous capabilities into aircraft avionics. This shift is aimed at improving operational efficiency, easing pilot workload, and enhancing safety protocols. Avionics manufacturers are heavily investing in the development of sophisticated flight management systems, autonomous flight control systems, and unmanned aerial vehicles (UAVs) equipped with cutting-edge avionics solutions. Additionally, the integration of artificial intelligence (AI) and machine learning algorithms further enhances these systems by enabling real-time data analysis, predictive maintenance, and adaptive automation. Consequently, the avionics market is witnessing significant expansion as airlines and aviation stakeholders strive to capitalize on automation and autonomy to meet industry demands while ensuring top-tier safety and operational efficiency standards.
Avionics Market Opportunity- The avionics market sees a surge in demand for cybersecurity solutions due to heightened awareness of potential threats.
With the aviation industry increasingly dependent on digital technology, the avionics market is witnessing a sharp rise in the demand for cybersecurity solutions. This surge is driven by a heightened awareness of the potential threats posed by cyber-attacks targeting aircraft systems. Stakeholders in aviation, including manufacturers, airlines, and regulatory bodies, are intensifying their efforts to protect against such threats, which could compromise flight safety, data integrity, and passenger confidentiality. Avionics manufacturers are proactively developing robust cybersecurity measures tailored to the unique challenges of aviation, encompassing secure communication protocols, encryption methods, intrusion detection systems, and real-time threat monitoring capabilities. Moreover, collaborative efforts within the industry and regulatory actions are pivotal in establishing cybersecurity standards and best practices to effectively mitigate risks and ensure the resilience of avionics systems amidst evolving cyber threats.
Avionics Market Share Analysis- Line Fit is poised to register the fastest growth rate (CAGR) over the forecast period from 2025 to 2034.
The Global Avionics Market is analyzed across Line Fit, Retrofit, and others. Line Fit is poised to register the fastest growth. The Line Fit Avionics Market, involving the installation of avionics systems during aircraft assembly, experiences growing demand driven by benefits such as seamless integration, cost efficiency, and regulatory compliance. With increasing new aircraft deliveries, especially in commercial aviation, manufacturers like Boeing and Airbus drive this segment by equipping their aircraft with advanced avionics. Technological advancements such as digital displays and connectivity solutions further contribute to market growth, offering airlines access to the latest innovations upon delivery.
Avionics Market Share Analysis- Commercial Aviation held a significant market share in 2024
The Global Avionics Market is analyzed across various platforms including Commercial Aviation, Military Aviation, General Aviation, Special Mission Aviation, and others. Of these, Commercial Aviation held a significant market share in 2024. The commercial aviation avionics market is experiencing robust growth, driven by factors like increasing air travel demand, fleet modernization, and technological advancements. Key trends include the adoption of advanced flight management and communication systems, satellite navigation, and digital displays. Regulatory mandates for safety and efficiency also contribute to market expansion. Major players are innovating and collaborating to offer tailored avionics solutions for commercial airlines globally.
Avionics Market Report Scope
|
Parameter
|
Details
|
|
Market Size (2024)
|
$48.1 Billion
|
|
Market Size (2034)
|
$118.1 Billion
|
|
Market Growth Rate
|
9.4%
|
|
Segments
|
By Fit (Line Fit, Retrofit), By Platform (Commercial Aviation, Military Aviation, General Aviation, Special Mission Aviation), By System (Communication, Navigation, Electronic Flight Displays, Flight Management, Power and Data Management, Payload and Mission Management, Traffic and Collision Management, Weather Detection)
|
|
Study Period
|
2019- 2024 and 2025-2034
|
|
Units
|
Revenue (USD)
|
|
Qualitative Analysis
|
Porter’s Five Forces, SWOT Profile, Market Share, Scenario Forecasts, Market Ecosystem, Company Ranking, Market Dynamics, Industry Benchmarking
|
|
Companies
|
Astronautics Corp of America, BAE Systems, Curtiss-Wright Corp, Elbit Systems Ltd, Garmin International, General Electric, Honeywell International Inc, L3Harris Technologies Inc, Leonardo S.p.A, Meggitt PLC, Northrop Grumman, Raytheon Technologies Corp, Safran SA, Thales Group, TransDigm Group Inc, and Others.
|
|
Countries
|
US, Canada, Mexico, Germany, France, Spain, Italy, UK, Russia, China, India, Japan, South Korea, Australia, South East Asia, Brazil, Argentina, Middle East, Africa
|
Avionics Market Segmentation
By Fit
By Platform
- Commercial Aviation
- Military Aviation
- General Aviation
- Special Mission Aviation
By System
- Communication
- Navigation
- Electronic Flight Displays
- Flight Management
- Power and Data Management
- Payload and Mission Management
- Traffic and Collision Management
- Weather Detection
By Region
- North America (United States, Canada, Mexico)
- Europe (Germany, France, United Kingdom, Spain, Italy, Others)
- Asia Pacific (China, India, Japan, South Korea, Australia, Others)
- Latin America (Brazil, Argentina, Others)
- Middle East and Africa (Saudi Arabia, UAE, Kuwait, Other Middle East, South Africa, Nigeria, Other Africa)
Avionics Market Companies
- Raytheon Technologies Corporation (United States)
- Honeywell International Inc (United States)
- L3Harris Technologies Inc. (United States)
- General Electric (United States)
- BAE Systems (United Kingdom)
- Meggitt PLC(United Kingdom)
- Thales Group (France)
- Curtiss-Wright Corporation (United States)
- Northrop Grumman (United States)
- Garmin International (United States)
- TransDigm Group Inc(United States)
- Leonardo S.p.A (Italy)
- Astronautics Corporation of America (United States)
- Safran SA (France)
- Elbit Systems Ltd (Israel)
*List not exhaustive
Avionics Market Outlook 2024
1 Market Overview
1.1 Introduction to the Avionics Market
1.2 Scope of the Study
1.3 Research Objective
1.3.1 Key Market Scope and Segments
1.3.2 Players Covered
1.3.3 Years Considered
2 Executive Summary
2.1 2024 Avionics Industry- Market Statistics
3 Market Dynamics
3.1 Market Drivers
3.2 Market Challenges
3.3 Market Opportunities
3.4 Market Trends
4 Market Factor Analysis
4.1 Porter’s Five Forces
4.2 Market Entropy
4.2.1 Global Avionics Market Companies with Area Served
4.2.2 Products Offerings Global Avionics Market
5 Recession Impact Analysis and Outlook Scenarios
5.1.1 Recission Impact Analysis
5.1.2 Market Growth Scenario- Base Case
5.1.3 Market Growth Scenario- Reference Case
5.1.4 Market Growth Scenario- High Case
6 Global Avionics Market Trends
6.1 Global Avionics Revenue (USD Million) and CAGR (%) by Type (2018-2032)
6.2 Global Avionics Revenue (USD Million) and CAGR (%) by Applications (2018-2032)
6.3 Global Avionics Revenue (USD Million) and CAGR (%) by regions (2018-2032)
7 Global Avionics Market Revenue (USD Million) by Type, and Applications (2018-2023)
7.1 Global Avionics Revenue (USD Million) by Type (2018-2023)
7.1.1 Global Avionics Revenue (USD Million), Market Share (%) by Type (2018-2023)
7.2 Global Avionics Revenue (USD Million) by Applications (2018-2023)
7.2.1 Global Avionics Revenue (USD Million), Market Share (%) by Applications (2018-2023)
8 Global Avionics Development Regional Status and Outlook
8.1 Global Avionics Revenue (USD Million) By Regions (2018-2023)
8.2 North America Avionics Revenue (USD Million) by Type, and Application (2018-2023)
8.2.1 North America Avionics Revenue (USD Million) by Country (2018-2023)
8.2.2 North America Avionics Revenue (USD Million) by Type (2018-2023)
8.2.3 North America Avionics Revenue (USD Million) by Applications (2018-2023)
8.3 Europe Avionics Revenue (USD Million), by Type, and Applications (USD Million) (2018-2023)
8.3.1 Europe Avionics Revenue (USD Million), by Country (2018-2023)
8.3.2 Europe Avionics Revenue (USD Million) by Type (2018-2023)
8.3.3 Europe Avionics Revenue (USD Million) by Applications (2018-2023)
8.4 Asia Pacific Avionics Revenue (USD Million), and Revenue (USD Million) by Type, and Applications (2018-2023)
8.4.1 Asia Pacific Avionics Revenue (USD Million) by Country (2018-2023)
8.4.2 Asia Pacific Avionics Revenue (USD Million) by Type (2018-2023)
8.4.3 Asia Pacific Avionics Revenue (USD Million) by Applications (2018-2023)
8.5 South America Avionics Revenue (USD Million), by Type, and Applications (2018-2023)
8.5.1 South America Avionics Revenue (USD Million), by Country (2018-2023)
8.5.2 South America Avionics Revenue (USD Million) by Type (2018-2023)
8.5.3 South America Avionics Revenue (USD Million) by Applications (2018-2023)
8.6 Middle East and Africa Avionics Revenue (USD Million), by Type, Technology, Application, Thickness (2018-2023)
8.6.1 Middle East and Africa Avionics Revenue (USD Million) by Country (2018-2023)
8.6.2 Middle East and Africa Avionics Revenue (USD Million) by Type (2018-2023)
8.6.3 Middle East and Africa Avionics Revenue (USD Million) by Applications (2018-2023)
9 Company Profiles
10 Global Avionics Market Revenue (USD Million), by Type, and Applications (2024-2032)
10.1 Global Avionics Revenue (USD Million) and Market Share (%) by Type (2024-2032)
10.1.1 Global Avionics Revenue (USD Million), and Market Share (%) by Type (2024-2032)
10.2 Global Avionics Revenue (USD Million) and Market Share (%) by Applications (2024-2032)
10.2.1 Global Avionics Revenue (USD Million), and Market Share (%) by Applications (2024-2032)
11 Global Avionics Development Regional Status and Outlook Forecast
11.1 Global Avionics Revenue (USD Million) By Regions (2024-2032)
11.2 North America Avionics Revenue (USD Million) by Type, and Applications (2024-2032)
11.2.1 North America Avionics Revenue (USD) Million by Country (2024-2032)
11.2.2 North America Avionics Revenue (USD Million), by Type (2024-2032)
11.2.3 North America Avionics Revenue (USD Million), Market Share (%) by Applications (2024-2032)
11.3 Europe Avionics Revenue (USD Million), by Type, and Applications (2024-2032)
11.3.1 Europe Avionics Revenue (USD Million), by Country (2024-2032)
11.3.2 Europe Avionics Revenue (USD Million), by Type (2024-2032)
11.3.3 Europe Avionics Revenue (USD Million), by Applications (2024-2032)
11.4 Asia Pacific Avionics Revenue (USD Million) by Type, and Applications (2024-2032)
11.4.1 Asia Pacific Avionics Revenue (USD Million), by Country (2024-2032)
11.4.2 Asia Pacific Avionics Revenue (USD Million), by Type (2024-2032)
11.4.3 Asia Pacific Avionics Revenue (USD Million), by Applications (2024-2032)
11.5 South America Avionics Revenue (USD Million), by Type, and Applications (2024-2032)
11.5.1 South America Avionics Revenue (USD Million), by Country (2024-2032)
11.5.2 South America Avionics Revenue (USD Million), by Type (2024-2032)
11.5.3 South America Avionics Revenue (USD Million), by Applications (2024-2032)
11.6 Middle East and Africa Avionics Revenue (USD Million), by Type, and Applications (2024-2032)
11.6.1 Middle East and Africa Avionics Revenue (USD Million), by region (2024-2032)
11.6.2 Middle East and Africa Avionics Revenue (USD Million), by Type (2024-2032)
11.6.3 Middle East and Africa Avionics Revenue (USD Million), by Applications (2024-2032)
12 Methodology and Data Sources
12.1 Methodology/Research Approach
12.1.1 Research Programs/Design
12.1.2 Market Size Estimation
12.1.3 Market Breakdown and Data Triangulation
12.2 Data Sources
12.2.1 Secondary Sources
12.2.2 Primary Sources
12.3 Disclaimer
List of Tables
Table 1 Market Segmentation Analysis
Table 2 Global Avionics Market Companies with Areas Served
Table 3 Products Offerings Global Avionics Market
Table 4 Low Growth Scenario Forecasts
Table 5 Reference Case Growth Scenario
Table 6 High Growth Case Scenario
Table 7 Global Avionics Revenue (USD Million) And CAGR (%) By Type (2018-2032)
Table 8 Global Avionics Revenue (USD Million) And CAGR (%) By Applications (2018-2032)
Table 9 Global Avionics Revenue (USD Million) And CAGR (%) By Regions (2018-2032)
Table 10 Global Avionics Revenue (USD Million) By Type (2018-2023)
Table 11 Global Avionics Revenue Market Share (%) By Type (2018-2023)
Table 12 Global Avionics Revenue (USD Million) By Applications (2018-2023)
Table 13 Global Avionics Revenue Market Share (%) By Applications (2018-2023)
Table 14 Global Avionics Market Revenue (USD Million) By Regions (2018-2023)
Table 15 Global Avionics Market Share (%) By Regions (2018-2023)
Table 16 North America Avionics Revenue (USD Million) By Country (2018-2023)
Table 17 North America Avionics Revenue (USD Million) By Type (2018-2023)
Table 18 North America Avionics Revenue (USD Million) By Applications (2018-2023)
Table 19 Europe Avionics Revenue (USD Million) By Country (2018-2023)
Table 20 Europe Avionics Revenue (USD Million) By Type (2018-2023)
Table 21 Europe Avionics Revenue (USD Million) By Applications (2018-2023)
Table 22 Asia Pacific Avionics Revenue (USD Million) By Country (2018-2023)
Table 23 Asia Pacific Avionics Revenue (USD Million) By Type (2018-2023)
Table 24 Asia Pacific Avionics Revenue (USD Million) By Applications (2018-2023)
Table 25 South America Avionics Revenue (USD Million) By Country (2018-2023)
Table 26 South America Avionics Revenue (USD Million) By Type (2018-2023)
Table 27 South America Avionics Revenue (USD Million) By Applications (2018-2023)
Table 28 Middle East and Africa Avionics Revenue (USD Million) By Region (2018-2023)
Table 29 Middle East and Africa Avionics Revenue (USD Million) By Type (2018-2023)
Table 30 Middle East and Africa Avionics Revenue (USD Million) By Applications (2018-2023)
Table 31 Financial Analysis
Table 32 Global Avionics Revenue (USD Million) By Type (2024-2032)
Table 33 Global Avionics Revenue Market Share (%) By Type (2024-2032)
Table 34 Global Avionics Revenue (USD Million) By Applications (2024-2032)
Table 35 Global Avionics Revenue Market Share (%) By Applications (2024-2032)
Table 36 Global Avionics Market Revenue (USD Million), And Revenue (USD Million) By Regions (2024-2032)
Table 37 North America Avionics Revenue (USD)By Country (2024-2032)
Table 38 North America Avionics Revenue (USD Million) By Type (2024-2032)
Table 39 North America Avionics Revenue (USD Million) By Applications (2024-2032)
Table 40 Europe Avionics Revenue (USD Million) By Country (2024-2032)
Table 41 Europe Avionics Revenue (USD Million) By Type (2024-2032)
Table 42 Europe Avionics Revenue (USD Million) By Applications (2024-2032)
Table 43 Asia Pacific Avionics Revenue (USD Million) By Country (2024-2032)
Table 44 Asia Pacific Avionics Revenue (USD Million) By Type (2024-2032)
Table 45 Asia Pacific Avionics Revenue (USD Million) By Applications (2024-2032)
Table 46 South America Avionics Revenue (USD Million) By Country (2024-2032)
Table 47 South America Avionics Revenue (USD Million) By Type (2024-2032)
Table 48 South America Avionics Revenue (USD Million) By Applications (2024-2032)
Table 49 Middle East and Africa Avionics Revenue (USD Million) By Region (2024-2032)
Table 50 Middle East and Africa Avionics Revenue (USD Million) By Region (2024-2032)
Table 51 Middle East and Africa Avionics Revenue (USD Million) By Type (2024-2032)
Table 52 Middle East and Africa Avionics Revenue (USD Million) By Applications (2024-2032)
Table 53 Research Programs/Design for This Report
Table 54 Key Data Information from Secondary Sources
Table 55 Key Data Information from Primary Sources
List of Figures
Figure 1 Market Scope
Figure 2 Porter’s Five Forces
Figure 3 Global Avionics Revenue (USD Million) By Type (2018-2023)
Figure 4 Global Avionics Revenue Market Share (%) By Type (2023)
Figure 5 Global Avionics Revenue (USD Million) By Applications (2018-2023)
Figure 6 Global Avionics Revenue Market Share (%) By Applications (2023)
Figure 7 Global Avionics Market Revenue (USD Million) By Regions (2018-2023)
Figure 8 Global Avionics Market Share (%) By Regions (2023)
Figure 9 North America Avionics Revenue (USD Million) By Country (2018-2023)
Figure 10 North America Avionics Revenue (USD Million) By Type (2018-2023)
Figure 11 North America Avionics Revenue (USD Million) By Applications (2018-2023)
Figure 12 Europe Avionics Revenue (USD Million) By Country (2018-2023)
Figure 13 Europe Avionics Revenue (USD Million) By Type (2018-2023)
Figure 14 Europe Avionics Revenue (USD Million) By Applications (2018-2023)
Figure 15 Asia Pacific Avionics Revenue (USD Million) By Country (2018-2023)
Figure 16 Asia Pacific Avionics Revenue (USD Million) By Type (2018-2023)
Figure 17 Asia Pacific Avionics Revenue (USD Million) By Applications (2018-2023)
Figure 18 South America Avionics Revenue (USD Million) By Country (2018-2023)
Figure 19 South America Avionics Revenue (USD Million) By Type (2018-2023)
Figure 20 South America Avionics Revenue (USD Million) By Applications (2018-2023)
Figure 21 Middle East and Africa Avionics Revenue (USD Million) By Region (2018-2023)
Figure 22 Middle East and Africa Avionics Revenue (USD Million) By Type (2018-2023)
Figure 23 Middle East and Africa Avionics Revenue (USD Million) By Applications (2018-2023)
Figure 24 Global Avionics Revenue (USD Million) By Type (2024-2032)
Figure 25 Global Avionics Revenue Market Share (%) By Type (2030)
Figure 26 Global Avionics Revenue (USD Million) By Applications (2024-2032)
Figure 27 Global Avionics Revenue Market Share (%) By Applications (2030)
Figure 28 Global Avionics Market Revenue (USD Million) By Regions (2024-2032)
Figure 29 North America Avionics Revenue (USD Million) By Country (2024-2032)
Figure 30 North America Avionics Revenue (USD Million) By Type (2024-2032)
Figure 31 North America Avionics Revenue (USD Million) By Applications (2024-2032)
Figure 32 Europe Avionics Revenue (USD Million) By Country (2024-2032)
Figure 33 Europe Avionics Revenue (USD Million) By Type (2024-2032)
Figure 34 Europe Avionics Revenue (USD Million) By Applications (2024-2032)
Figure 35 Asia Pacific Avionics Revenue (USD Million) By Country (2024-2032)
Figure 36 Asia Pacific Avionics Revenue (USD Million) By Type (2024-2032)
Figure 37 Asia Pacific Avionics Revenue (USD Million) By Applications (2024-2032)
Figure 38 South America Avionics Revenue (USD Million) By Country (2024-2032)
Figure 39 South America Avionics Revenue (USD Million) By Type (2024-2032)
Figure 40 South America Avionics Revenue (USD Million) By Applications (2024-2032)
Figure 41 Middle East and Africa Avionics Revenue (USD Million) By Region (2024-2032)
Figure 42 Middle East and Africa Avionics Revenue (USD Million) By Region (2024-2032)
Figure 43 Middle East and Africa Avionics Revenue (USD Million) By Type (2024-2032)
Figure 44 Middle East and Africa Avionics Revenue (USD Million) By Applications (2024-2032)
Figure 45 Bottom-Up and Top-Down Approaches for This Report
Figure 46 Data Triangulation
