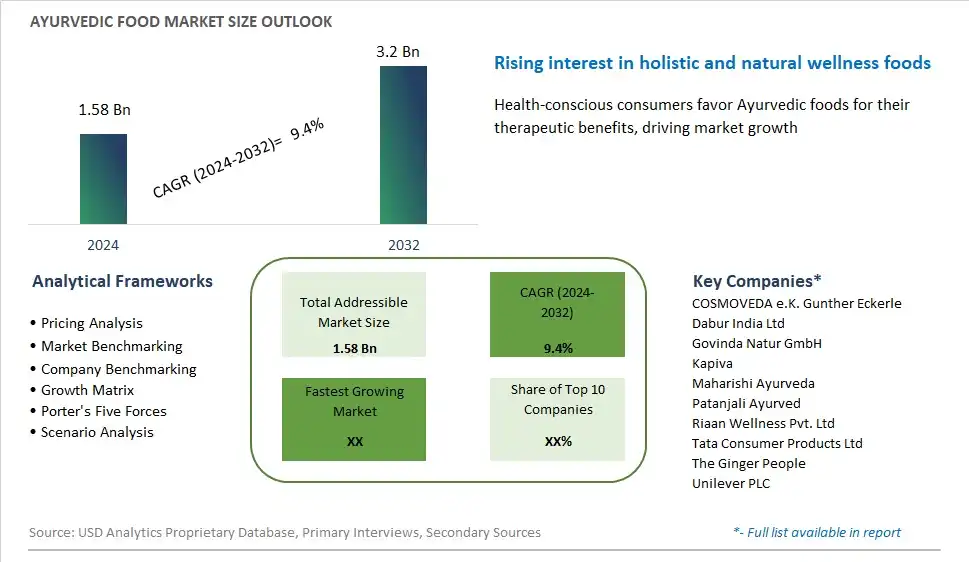
Global Ayurvedic Food Market Size is valued at $1.58 Billion in 2024 and is forecast to register a growth rate (CAGR) of 9.4% to reach $3.2 Billion by 2032.
The global Ayurvedic Food Market Comprehensive Study analyzes and forecasts the market size across 6 regions and 24 countries for diverse segments -By Product (Solid Form, Liquid Form), By Application (Supermarkets/Hypermarkets, Drug Stores, Online Retailers, Others)
An Introduction to Ayurvedic Food Market
In 2024, the market for Ayurvedic food experiences robust growth as consumers increasingly prioritize holistic health and wellness practices. Rooted in ancient Indian philosophy, Ayurveda emphasizes the balance between mind, body, and spirit through dietary and lifestyle choices. Ayurvedic foods, formulated according to these principles, are gaining traction among health-conscious consumers seeking natural remedies and preventive measures for various ailments. These foods often feature a diverse array of herbs, spices, and medicinal plants known for their therapeutic properties, such as turmeric, ashwagandha, and tulsi. With the rise of functional foods and personalized nutrition trends, Ayurvedic principles are being incorporated into modern dietary plans and packaged products, ranging from herbal teas and spice blends to ready-to-eat meals and supplements. As consumers seek alternatives to conventional medicine and embrace holistic approaches to well-being, the Ayurvedic food market is poised for continued expansion and innovation.
Ayurvedic Food Competitive Landscape
The market report analyses the leading companies in the industry including COSMOVEDA e.K. Gunther Eckerle, Dabur India Ltd, Govinda Natur GmbH, Kapiva, Maharishi Ayurveda, Patanjali Ayurved, Riaan Wellness Pvt. Ltd, Tata Consumer Products Ltd, The Ginger People, Unilever PLC, and Others.
Ayurvedic Food Market Dynamics
Ayurvedic Food Market Trend: Growing Consumer Interest in Holistic Health and Wellness
A prominent trend in the ayurvedic food market is the growing consumer interest in holistic health and wellness. Ayurveda, an ancient Indian system of medicine, emphasizes the balance of mind, body, and spirit through natural remedies, dietary practices, and lifestyle choices. As people increasingly seek alternatives to conventional medicine and adopt holistic approaches to health, there is a rising demand for ayurvedic foods that are believed to promote well-being, vitality, and longevity. This trend is driven by a growing awareness of the interconnectedness of diet and health, as well as the desire for natural, plant-based solutions to support overall wellness. As a result, there is a growing market for ayurvedic foods that incorporate traditional ingredients and principles to address various health concerns and promote holistic wellness.
Market Driver: Shift Towards Functional and Nutraceutical Foods
A key driver shaping the ayurvedic food market is the shift towards functional and nutraceutical foods. Functional foods are those that offer additional health benefits beyond basic nutrition, often containing bioactive compounds or ingredients with specific health-promoting properties. Ayurvedic foods, with their emphasis on natural ingredients and therapeutic properties, are increasingly recognized as functional foods that can contribute to overall health and well-being. This driver is fueled by changing consumer preferences towards preventive healthcare, personalized nutrition, and natural remedies, as well as advancements in food science and technology that enable the development of innovative functional food products. As consumers seek foods that support specific health goals or address health concerns, there is a growing demand for ayurvedic foods that offer functional benefits such as immune support, digestive health, stress relief, and detoxification.
Market Opportunity: Innovation in Ayurvedic Food Formulations and Product Development
An opportunity for growth in the ayurvedic food market lies in innovation in product formulations and development. With the increasing popularity of ayurvedic principles and practices, there is potential to expand the range of ayurvedic food products to cater to diverse consumer preferences and dietary needs. This includes the development of convenient and accessible ayurvedic food options such as ready-to-eat meals, snacks, beverages, and dietary supplements that align with modern lifestyles and nutritional requirements. Additionally, there is opportunity to leverage traditional ayurvedic ingredients and formulations in new product categories, such as functional beverages, protein bars, and meal replacements, to appeal to health-conscious consumers seeking convenient and nutritious options. By investing in research and development, collaborating with ayurvedic practitioners and food scientists, and capitalizing on consumer trends, stakeholders in the ayurvedic food market can unlock new opportunities for innovation and market growth.
Ayurvedic Food Market Share Analysis: Solid Form held the dominant market share in 2024
The Solid Form segment dominates the Ayurvedic Food Market as the largest segment due to its traditional roots, ease of consumption, and diverse product offerings. Solid forms of Ayurvedic foods encompass a wide range of products, including herbal powders, tablets, capsules, and snacks, all formulated based on Ayurvedic principles and traditional recipes. These solid forms offer convenience and portability, making them popular choices for consumers seeking to incorporate Ayurvedic principles into their daily routines. Additionally, solid Ayurvedic foods often contain concentrated herbal extracts and formulations designed to support specific health goals, such as digestion, immunity, and overall well-being. Furthermore, solid Ayurvedic food products have a longer shelf life compared to their liquid counterparts, providing extended storage and convenience for consumers. With the growing interest in natural and holistic wellness practices, the Solid Form segment of the Ayurvedic Food Market continues to expand, driven by consumer demand for convenient and effective Ayurvedic food options that align with their health and lifestyle preferences.
Ayurvedic Food Market Share Analysis: Online Retailers market is poised to register the fastest growth rae over the forecast period to 2032
The Online Retailers segment within the Ayurvedic Food Market is the fastest-growing segment, propelled by the increasing adoption of e-commerce platforms and the convenience of online shopping for health and wellness products. With the rise of digitalization and the surge in demand for natural and holistic remedies, consumers are turning to online channels to purchase Ayurvedic foods and supplements. Online retailers offer a diverse range of Ayurvedic food products, including herbal powders, supplements, teas, and snacks, providing consumers with access to a wide variety of brands and formulations from the comfort of their homes. Additionally, the COVID-19 pandemic has accelerated the shift towards online shopping as consumers prioritize safety and contactless transactions. Furthermore, online retailers often provide exclusive deals, discounts, and personalized recommendations, enhancing the overall shopping experience and driving consumer preference towards online channels. As a result, the Online Retailers segment of the Ayurvedic Food Market experiences rapid growth, reshaping the distribution landscape and driving innovation in digital marketing strategies within the health and wellness industry.
Ayurvedic Food Market Segmentation
By Product
Solid Form
Liquid Form
By Application
Supermarkets/Hypermarkets
Drug Stores
Online Retailers
Others
Countries Analyzed
North America (US, Canada, Mexico)
Europe (Germany, UK, France, Spain, Italy, Russia, Rest of Europe)
Asia Pacific (China, India, Japan, South Korea, Australia, South East Asia, Rest of Asia)
South America (Brazil, Argentina, Rest of South America)
Middle East and Africa (Saudi Arabia, UAE, Rest of Middle East, South Africa, Egypt, Rest of Africa)
Ayurvedic Food Companies Profiled in the Study
COSMOVEDA e.K. Gunther Eckerle
Dabur India Ltd
Govinda Natur GmbH
Kapiva
Maharishi Ayurveda
Patanjali Ayurved
Riaan Wellness Pvt. Ltd
Tata Consumer Products Ltd
The Ginger People
Unilever PLC
*- List Not Exhaustive
Chapter 1. TABLE OF CONTENTS
Chapter 2. Introduction to Ayurvedic Food Market
2.1. Market Overview
2.2. Key Statistics and Report Highlights
2.3. Scope of the Comprehensive Study
2.3.1. Market Definition
2.3.2 Countries and Regions Covered
2.3.3 Research Objective
2.3.4 Units, Currency, and Conversions
2.3.5 Industry Value Chain
2.4. Key Market Segments
2.5. Key Companies
2.6. Study Period
Chapter 3. Strategic Analysis Review
3.1. Ayurvedic Food Pricing Analysis and Forecast
3.2. Porter’s Five Forces
3.3. Market Ecosystem
3.4. SWOT Analysis
3.5. Regulatory Scenario
3.3. Effects of Inflation, Russia-Ukraine War, moderating economic growth, and other macroeconomic factors
Chapter 4. Competitive Landscape
4.1. Market Share Analysis
4.1.1. Global Ayurvedic Food Market Share by Company, 2023
4.1.2. Product Offerings of Leading Ayurvedic Food Companies
4.2. Market Entropy
4.2.1. New Product Launches in the Industry
4.2.2. Mergers, Acquisitions, Joint ventures, and Partnerships
4.3. Key Strategies and Best Practices
Chapter 5. Global Market Projections: Best, Reference, and Low Case Scenarios
5.1. Growth Analysis- Case Scenario Definitions
5.2. Low Growth Case Scenario Forecasts
5.3. Reference Growth Case Scenario Forecasts
5.4. High Growth Case Scenario Forecasts
Chapter 6. Market Dynamics
6.1. Ayurvedic Food Market Drivers
6.2. Ayurvedic Food Market Challenges
6.6. Ayurvedic Food Market Opportunities
6.4. Ayurvedic Food Market Trends
Chapter 7. Global Ayurvedic Food Market Outlook Trends
7.1. Global Ayurvedic Food Revenue (USD Million) and CAGR (%) by Type (2021-2032)
7.2. Global Ayurvedic Food Revenue (USD Million) and CAGR (%) by Application (2021-2032)
7.3. Global Ayurvedic Food Revenue (USD Million) and CAGR (%) by Product (2021-2032)
By Product
Solid Form
Liquid Form
By Application
Supermarkets/Hypermarkets
Drug Stores
Online Retailers
Others
Chapter 8. Global Ayurvedic Food Regional Analysis and Outlook
8.1. Global Ayurvedic Food Revenue (USD Million) By Regions (2021- 2032)
8.2. North America Ayurvedic Food Revenue (USD Million) by Country (2021-2032)
8.2.1. United States Ayurvedic Food Regional Analysis and Outlook
8.2.2. Canada Ayurvedic Food Regional Analysis and Outlook
8.2.3. Mexico Ayurvedic Food Regional Analysis and Outlook
8.3. Europe Ayurvedic Food Revenue (USD Million), by Country (2021-2032)
8.3.1. Germany Ayurvedic Food Regional Analysis and Outlook
8.3.2. France Ayurvedic Food Regional Analysis and Outlook
8.3.3. United Kingdom Ayurvedic Food Regional Analysis and Outlook
8.3.4. Spain Ayurvedic Food Regional Analysis and Outlook
8.3.5. Italy Ayurvedic Food Regional Analysis and Outlook
8.3.6. Russia Ayurvedic Food Regional Analysis and Outlook
8.3.7. Rest of Europe Ayurvedic Food Regional Analysis and Outlook
8.4. Asia Pacific Ayurvedic Food Revenue (USD Million) by Country (2021-2032)
8.4.1. China Ayurvedic Food Regional Analysis and Outlook
8.4.2. Japan Ayurvedic Food Regional Analysis and Outlook
8.4.3. India Ayurvedic Food Regional Analysis and Outlook
8.4.4. South Korea Ayurvedic Food Regional Analysis and Outlook
8.4.5. Australia Ayurvedic Food Regional Analysis and Outlook
8.4.6. South East Asia Ayurvedic Food Regional Analysis and Outlook
8.4.7. Rest of Asia Pacific Ayurvedic Food Regional Analysis and Outlook
8.5. South America Ayurvedic Food Revenue (USD Million), by Country (2021-2032)
8.5.1. Brazil Ayurvedic Food Regional Analysis and Outlook
8.5.2. Argentina Ayurvedic Food Regional Analysis and Outlook
8.5.3. Rest of South America Ayurvedic Food Regional Analysis and Outlook
8.6. Middle East and Africa Ayurvedic Food Revenue (USD Million) by Country (2021-2032)
8.6.1. Middle East Ayurvedic Food Regional Analysis and Outlook
8.6.2. Africa Ayurvedic Food Regional Analysis and Outlook
Chapter 9. North America Ayurvedic Food Analysis and Outlook
9.1. North America Ayurvedic Food Revenue (USD Million) by Segments (2021-2032)
9.1.1. North America Ayurvedic Food Revenue (USD Million) by Type (2021-2032)
9.1.2. North America Ayurvedic Food Revenue (USD Million) by Application (2021-2032)
9.1.3. North America Ayurvedic Food Revenue (USD Million) by Product (2021-2032)
By Product
Solid Form
Liquid Form
By Application
Supermarkets/Hypermarkets
Drug Stores
Online Retailers
Others
Chapter 10. Europe Ayurvedic Food Analysis and Outlook
10.1. Europe Ayurvedic Food Revenue (USD Million), by Segments (USD Million) (2021-2032)
10.1.1. Europe Ayurvedic Food Revenue (USD Million) by Type (2021-2032)
10.1.2. Europe Ayurvedic Food Revenue (USD Million) by Application (2021-2032)
10.1.3. Europe Ayurvedic Food Revenue (USD Million) by Product (2021-2032)
By Product
Solid Form
Liquid Form
By Application
Supermarkets/Hypermarkets
Drug Stores
Online Retailers
Others
Chapter 11. Asia Pacific Ayurvedic Food Analysis and Outlook
11.1. Asia Pacific Ayurvedic Food Revenue (USD Million), and Revenue (USD Million) by Segments (2021-2032)
11.1.1. Asia Pacific Ayurvedic Food Revenue (USD Million) by Type (2021-2032)
11.1.2. Asia Pacific Ayurvedic Food Revenue (USD Million) by Application (2021-2032)
11.1.3. Asia Pacific Ayurvedic Food Revenue (USD Million) by Product (2021-2032)
By Product
Solid Form
Liquid Form
By Application
Supermarkets/Hypermarkets
Drug Stores
Online Retailers
Others
Chapter 12. South America Ayurvedic Food Analysis and Outlook
12.1. South America Ayurvedic Food Revenue (USD Million), by Segments (2021-2032)
12.1.1. South America Ayurvedic Food Revenue (USD Million) by Type (2021-2032)
12.1.2. South America Ayurvedic Food Revenue (USD Million) by Application (2021-2032)
12.1.3. South America Ayurvedic Food Revenue (USD Million) by Product (2021-2032)
By Product
Solid Form
Liquid Form
By Application
Supermarkets/Hypermarkets
Drug Stores
Online Retailers
Others
Chapter 13. Middle East and Africa Ayurvedic Food Analysis and Outlook
13.1. Middle East and Africa Ayurvedic Food Revenue (USD Million), by Segments (2021-2032)
13.1.1. Middle East and Africa Ayurvedic Food Revenue (USD Million) by Type (2021-2032)
13.1.2. Middle East and Africa Ayurvedic Food Revenue (USD Million) by Application (2021-2032)
13.1.3. Middle East and Africa Ayurvedic Food Revenue (USD Million) by Product (2021-2032)
By Product
Solid Form
Liquid Form
By Application
Supermarkets/Hypermarkets
Drug Stores
Online Retailers
Others
Chapter 14. Ayurvedic Food Company Profiles
14.1 Business Overview
14.2 Product Profiles
14.3 SWOT Profiles
14.5 Recent Developments
14.6 Financial Profile
List of Companies
COSMOVEDA e.K. Gunther Eckerle
Dabur India Ltd
Govinda Natur GmbH
Kapiva
Maharishi Ayurveda
Patanjali Ayurved
Riaan Wellness Pvt. Ltd
Tata Consumer Products Ltd
The Ginger People
Unilever PLC
15. Methodology and Data Sources
15.1 Customization Offerings
15.2 Subscription Services
15.3 Related Reports
15.4 Publisher Expertise
LIST OF TABLES
Table 1 Market Segmentation Analysis
Table 2 Global Ayurvedic Food Market Share of Leading Companies, 2023
Table 3 Product Offerings of Leading Companies
Table 4 Low Growth Scenario Forecasts
Table 5 Reference Case Growth Scenario
Table 6 High Growth Case Scenario
Table 7 Global Ayurvedic Food Revenue (USD Million) And CAGR (%) By Type (2021-2032)
Table 8 Global Ayurvedic Food Revenue (USD Million) And CAGR (%) By Application (2021-2032)
Table 9 Global Ayurvedic Food Revenue (USD Million) And CAGR (%) By Product (2021-2032)
Table 10 Global Ayurvedic Food Market Revenue (USD Million) By Regions (2021-2032)
Table 11 Global Ayurvedic Food Market Share (%) By Regions (2021-2032)
Table 12 North America Ayurvedic Food Revenue (USD Million) By Country (2021-2032)
Table 13 Europe Ayurvedic Food Revenue (USD Million) By Country (2021-2032)
Table 14 Asia Pacific Ayurvedic Food Revenue (USD Million) By Country (2021-2032)
Table 15 South America Ayurvedic Food Revenue (USD Million) By Country (2021-2032)
Table 16 Middle East and Africa Ayurvedic Food Revenue (USD Million) By Region (2021-2032)
Table 17 North America Ayurvedic Food Revenue (USD Million) By Type (2021-2032)
Table 18 North America Ayurvedic Food Revenue (USD Million) By Application (2021-2032)
Table 19 North America Ayurvedic Food Revenue (USD Million) By Product (2021-2032)
Table 20 Europe Ayurvedic Food Revenue (USD Million) By Type (2021-2032)
Table 21 Europe Ayurvedic Food Revenue (USD Million) By Application (2021-2032)
Table 22 Europe Ayurvedic Food Revenue (USD Million) By Product (2021-2032)
Table 23 Asia Pacific Ayurvedic Food Revenue (USD Million) By Type (2021-2032)
Table 24 Asia Pacific Ayurvedic Food Revenue (USD Million) By Application (2021-2032)
Table 25 Asia Pacific Ayurvedic Food Revenue (USD Million) By Product (2021-2032)
Table 26 South America Ayurvedic Food Revenue (USD Million) By Type (2021-2032)
Table 27 South America Ayurvedic Food Revenue (USD Million) By Application (2021-2032)
Table 28 South America Ayurvedic Food Revenue (USD Million) By Product (2021-2032)
Table 29 Middle East and Africa Ayurvedic Food Revenue (USD Million) By Type (2021-2032)
Table 30 Middle East and Africa Ayurvedic Food Revenue (USD Million) By Application (2021-2032)
Table 31 Middle East and Africa Ayurvedic Food Revenue (USD Million) By Product (2021-2032)
LIST OF FIGURES
Figure 1. Market Scope
Figure 2. Pricing Forecasts Per Unit, 2023- 2032
Figure 3. Porter’s Five Forces
Figure 4. Global Ayurvedic Food Market Revenue (USD Million) By Regions (2021-2032)
Figure 5. Global Ayurvedic Food Market Share (%) By Regions (2023)
Figure 6. North America Ayurvedic Food Revenue (USD Million) By Country (2021-2032)
Figure 7. United States Ayurvedic Food Revenue (USD Million) By Country (2021-2032)
Figure 8. Canada Ayurvedic Food Revenue (USD Million) By Country (2021-2032)
Figure 9. Mexico Ayurvedic Food Revenue (USD Million) By Country (2021-2032)
Figure 10. Europe Ayurvedic Food Revenue (USD Million) By Country (2021-2032)
Figure 11. Germany Ayurvedic Food Revenue (USD Million) By Country (2021-2032)
Figure 12. France Ayurvedic Food Revenue (USD Million) By Country (2021-2032)
Figure 13. United Kingdom Ayurvedic Food Revenue (USD Million) By Country (2021-2032)
Figure 14. Spain Ayurvedic Food Revenue (USD Million) By Country (2021-2032)
Figure 15. Italy Ayurvedic Food Revenue (USD Million) By Country (2021-2032)
Figure 16. Russia Ayurvedic Food Revenue (USD Million) By Country (2021-2032)
Figure 17. Rest of Europe Ayurvedic Food Revenue (USD Million) By Country (2021-2032)
Figure 11. Asia Pacific Ayurvedic Food Revenue (USD Million) By Country (2021-2032)
Figure 12. China Ayurvedic Food Revenue (USD Million) By Country (2021-2032)
Figure 13. Japan Ayurvedic Food Revenue (USD Million) By Country (2021-2032)
Figure 14. India Ayurvedic Food Revenue (USD Million) By Country (2021-2032)
Figure 15. South Korea Ayurvedic Food Revenue (USD Million) By Country (2021-2032)
Figure 16. Australia Ayurvedic Food Revenue (USD Million) By Country (2021-2032)
Figure 17. South East Asia Ayurvedic Food Revenue (USD Million) By Country (2021-2032)
Figure 18. South America Ayurvedic Food Revenue (USD Million) By Country (2021-2032)
Figure 19. Brazil Ayurvedic Food Revenue (USD Million) By Country (2021-2032)
Figure 20. Argentina Ayurvedic Food Revenue (USD Million) By Country (2021-2032)
Figure 21. Rest of Asia Pacific Ayurvedic Food Revenue (USD Million) By Country (2021-2032)
Figure 22. Middle East and Africa Ayurvedic Food Revenue (USD Million) By Region (2021-2032)
Figure 23. Saudi Arabia Ayurvedic Food Revenue (USD Million) By Region (2021-2032)
Figure 24. The UAE Ayurvedic Food Revenue (USD Million) By Region (2021-2032)
Figure 25. Rest of Middle East Ayurvedic Food Revenue (USD Million) By Region (2021-2032)
Figure 26. South Africa Ayurvedic Food Revenue (USD Million) By Region (2021-2032)
Figure 27. Africa Ayurvedic Food Revenue (USD Million) By Region (2021-2032)
Figure 28. North America Ayurvedic Food Revenue (USD Million) By Type (2021-2032)
Figure 29. North America Ayurvedic Food Revenue (USD Million) By Application (2021-2032)
Figure 30. North America Ayurvedic Food Revenue (USD Million) By Product (2021-2032)
Figure 31. Europe Ayurvedic Food Revenue (USD Million) By Type (2021-2032)
Figure 32. Europe Ayurvedic Food Revenue (USD Million) By Application (2021-2032)
Figure 33. Europe Ayurvedic Food Revenue (USD Million) By Product (2021-2032)
Figure 34. Asia Pacific Ayurvedic Food Revenue (USD Million) By Type (2021-2032)
Figure 35. Asia Pacific Ayurvedic Food Revenue (USD Million) By Application (2021-2032)
Figure 36. Asia Pacific Ayurvedic Food Revenue (USD Million) By Product (2021-2032)
Figure 37. South America Ayurvedic Food Revenue (USD Million) By Type (2021-2032)
Figure 38. South America Ayurvedic Food Revenue (USD Million) By Application (2021-2032)
Figure 39. South America Ayurvedic Food Revenue (USD Million) By Product (2021-2032)
Figure 40. Middle East and Africa Ayurvedic Food Revenue (USD Million) By Type (2021-2032)
Figure 41. Middle East and Africa Ayurvedic Food Revenue (USD Million) By Application (2021-2032)
Figure 42. Middle East and Africa Ayurvedic Food Revenue (USD Million) By Product (2021-2032)
By Product
Solid Form
Liquid Form
By Application
Supermarkets/Hypermarkets
Drug Stores
Online Retailers
Others
Countries Analyzed
North America (US, Canada, Mexico)
Europe (Germany, UK, France, Spain, Italy, Russia, Rest of Europe)
Asia Pacific (China, India, Japan, South Korea, Australia, South East Asia, Rest of Asia)
South America (Brazil, Argentina, Rest of South America)
Middle East and Africa (Saudi Arabia, UAE, Rest of Middle East, South Africa, Egypt, Rest of Africa)
