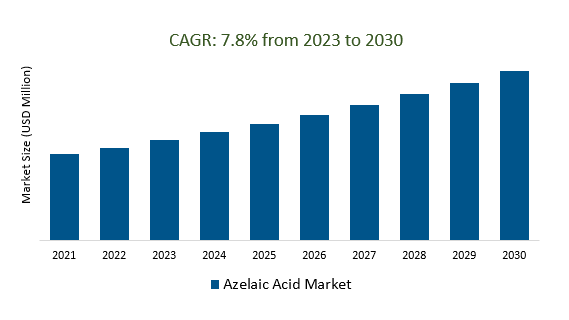
The global Azelaic Acid Market Size is estimated to register 7.8% growth over the forecast period from 2023 to 2030.
The market growth is driven predominantly by the increasing Azelaic acid is known for its beneficial properties in treating skin conditions such as acne, rosacea, and hyperpigmentation. The increasing emphasis on skincare and personal grooming, along with a growing awareness of effective skincare ingredients, could drive demand for products containing azelaic acid. Leading companies are focusing on Expanding Applications, Increased Research and Innovation, Growth in Emerging Markets, Customized and Personalized Products, Technological Advancements, and others to boost market shares in the industry.
Market Overview
The Azelaic Acid market encompasses the versatile application of a naturally occurring dicarboxylic acid in skincare, pharmaceuticals, food additives, and industrial uses. It primarily targets skin concerns like acne, rosacea, and hyperpigmentation in the cosmetics and skincare sector, while its antimicrobial and anti-inflammatory properties also find potential in pharmaceuticals, food preservation, and chemical production. Market growth is driven by the expanding skincare industry, rising consumer awareness, prevalence of skin conditions, and increasing demand for natural ingredients
Market Dynamics
Market Trends- Companies are launching Growing Skincare Industry to attract a consumer base
The Azelaic Acid market benefits significantly from the growth of the skincare industry, driven by rising consumer awareness and demand for effective solutions. Azelaic acid's proven efficacy in addressing skin issues like acne and rosacea positions it as a sought-after ingredient in skincare products. As the skincare market expands due to increased emphasis on personal grooming and beauty standards, the demand for products incorporating azelaic acid is increasing, making it a valuable opportunity for manufacturers and suppliers in the industry.
Market Driver- Shift Towards Natural and Organic Ingredients demand for efficient Metal Cleaner Market
The Azelaic Acid market is influenced by the shift towards natural and organic ingredients in the cosmetic and skincare industry. With consumers seeking safer and more sustainable options, the demand for products containing natural ingredients like azelaic acid, derived from sources like grains, is growing. This trend aligns with the preference for cleaner and greener formulations, driving manufacturers to incorporate azelaic acid into their products to meet the demand for natural and organic skincare solutions.
Market Opportunity-Introduction of Increase in Cosmetic Spending
The Azelaic Acid market benefits from the increase in cosmetic spending, as consumers allocate more funds to skincare and beauty products. With a growing emphasis on self-care and grooming, consumers are willing to invest in products that address specific skin concerns. Azelaic acid's effectiveness in treating conditions like acne, rosacea, and hyperpigmentation makes it an attractive ingredient for skincare formulations. As cosmetic spending rises, the demand for products containing azelaic acid is expected to increase, presenting a favorable market opportunity for manufacturers and suppliers in the skincare industry.
Market Share Analysis- The pharmaceutical-grade azelaic Acid Market will register the fastest growth
The global Azelaic Acid Market is analyzed across Pharmaceutical Grade, Technical Grade, Pharmaceutical Grade, and others. Of these, Pharmaceutical Grade is poised to register the fastest growth. The pharmaceutical-grade segment is a significant aspect of the Azelaic Acid market. Azelaic acid's antimicrobial, anti-inflammatory, and skin-lightening properties have garnered attention in the pharmaceutical industry for dermatological treatments. Pharmaceutical-grade azelaic acid is used in formulations to address skin conditions such as acne, rosacea, and melasma.
Market Share Analysis- Cosmetics held a significant market share in 2023
The global Azelaic Acid Market is analyzed across a wide range of applications including Cosmetics, Electronics, Pharmaceuticals, and others. Of these, Cosmetics held a significant market share in 2023. In the Azelaic Acid market, the cosmetics sector is pivotal, leveraging azelaic acid's established benefits in treating skin concerns like acne and hyperpigmentation. Its incorporation into skincare products aligns with the demand for effective solutions, catering to consumers seeking visible results. The cosmetics industry's utilization of azelaic acid reflects the trend of integrating specialized ingredients, driving market growth as it addresses diverse skincare needs.
Azelaic Acid Market Segmentation
By Type
• Polymer Grade
• Technical Grade
• Pharmaceutical Grade
By Application
• Pharmaceuticals
• Plastics
• Adhesives
• Lubricants
• Electronics
• Cosmetics
By Region
• North America (United States, Canada, Mexico)
• Europe (Germany, France, United Kingdom, Spain, Italy, Others)
• Asia Pacific (China, India, Japan, South Korea, Australia, Others)
• Latin America (Brazil, Argentina, Others)
• Middle East and Africa (Saudi Arabia, UAE, Kuwait, Other Middle East, South Africa, Nigeria, Other Africa)
Azelaic Acid Market companies
• Emery Oleochemicals
• Hubei Tuochu
• Electronic Materials
• Matrica
• Jiangsu Senxuan
• Nantong Hengxing
• Ninghai Zhong long
• BASF
• Croda Sipo
* List not exhaustive
Azelaic Acid Market Outlook 2023
1 Market Overview
1.1 Introduction to Azelaic Acid Market
1.2 Scope of the Study
1.3 Research Objective
1.3.1 Key Market Scope and Segments
1.3.2 Players Covered
1.3.3 Years Considered
2 Executive Summary
2.1 2023 Azelaic Acid Industry- Market Statistics
3 Market Dynamics
3.1 Market Drivers
3.2 Market Challenges
3.3 Market Opportunities
3.4 Market Trends
4 Market Factor Analysis
4.1 Porter’s Five Forces
4.2 Market Entropy
4.2.1 Global Azelaic Acid Market Companies with Area Served
4.2.2 Products Offerings Global Azelaic Acid Market
5 COVID-19 Impact Analysis and Outlook Scenarios
5.1.1 Covid-19 Impact Analysis
5.1.2 Post-COVID-19 Scenario- Low Growth Case
5.1.3 Post-COVID-19 Scenario- Reference Growth Case
5.1.4 Post-COVID-19 Scenario- Low Growth Case
6 Global Azelaic Acid Market Trends
6.1 Global Azelaic Acid Revenue (USD Million) and CAGR (%) by Type (2018-2028)
6.2 Global Azelaic Acid Revenue (USD Million) and CAGR (%) by Applications (2018-2028)
6.3 Global Azelaic Acid Revenue (USD Million) and CAGR (%) by Regions (2018-2028)
7 Global Azelaic Acid Market Revenue (USD Million) by Type, and Applications (2018-2022)
7.1 Global Azelaic Acid Revenue (USD Million) by Type (2018-2022)
7.1.1 Global Azelaic Acid Revenue (USD Million), Market Share (%) by Type (2018-2022)
7.2 Global Azelaic Acid Revenue (USD Million) by Applications (2018-2022)
7.2.1 Global Azelaic Acid Revenue (USD Million), Market Share (%) by Applications (2018-2022)
8 Global Azelaic Acid Development Regional Status and Outlook
8.1 Global Azelaic Acid Revenue (USD Million) By Regions (2018-2022)
8.2 North America Azelaic Acid Revenue (USD Million) by Type, and Application (2018-2022)
8.2.1 North America Azelaic Acid Revenue (USD Million) by Country (2018-2022)
8.2.2 North America Azelaic Acid Revenue (USD Million) by Type (2018-2022)
8.2.3 North America Azelaic Acid Revenue (USD Million) by Applications (2018-2022)
8.3 Europe Azelaic Acid Revenue (USD Million), by Type, and Applications (USD Million) (2018-2022)
8.3.1 Europe Azelaic Acid Revenue (USD Million), by Country (2018-2022)
8.3.2 Europe Azelaic Acid Revenue (USD Million) by Type (2018-2022)
8.3.3 Europe Azelaic Acid Revenue (USD Million) by Applications (2018-2022)
8.4 Asia Pacific Azelaic Acid Revenue (USD Million), and Revenue (USD Million) by Type, and Applications (2018-2022)
8.4.1 Asia Pacific Azelaic Acid Revenue (USD Million) by Country (2018-2022)
8.4.2 Asia Pacific Azelaic Acid Revenue (USD Million) by Type (2018-2022)
8.4.3 Asia Pacific Azelaic Acid Revenue (USD Million) by Applications (2018-2022)
8.5 South America Azelaic Acid Revenue (USD Million), by Type, and Applications (2018-2022)
8.5.1 South America Azelaic Acid Revenue (USD Million), by Country (2018-2022)
8.5.2 South America Azelaic Acid Revenue (USD Million) by Type (2018-2022)
8.5.3 South America Azelaic Acid Revenue (USD Million) by Applications (2018-2022)
8.6 Middle East and Africa Azelaic Acid Revenue (USD Million), by Type, Technology, Application, Thickness (2018-2022)
8.6.1 Middle East and Africa Azelaic Acid Revenue (USD Million) by Country (2018-2022)
8.6.2 Middle East and Africa Azelaic Acid Revenue (USD Million) by Type (2018-2022)
8.6.3 Middle East and Africa Azelaic Acid Revenue (USD Million) by Applications (2018-2022)
9 Company Profiles
10 Global Azelaic Acid Market Revenue (USD Million), by Type, and Applications (2023-2028)
10.1 Global Azelaic Acid Revenue (USD Million) and Market Share (%) by Type (2023-2028)
10.1.1 Global Azelaic Acid Revenue (USD Million), and Market Share (%) by Type (2023-2028)
10.2 Global Azelaic Acid Revenue (USD Million) and Market Share (%) by Applications (2023-2028)
10.2.1 Global Azelaic Acid Revenue (USD Million), and Market Share (%) by Applications (2023-2028)
11 Global Azelaic Acid Development Regional Status and Outlook Forecast
11.1 Global Azelaic Acid Revenue (USD Million) By Regions (2023-2028)
11.2 North America Azelaic Acid Revenue (USD Million) by Type, and Applications (2023-2028)
11.2.1 North America Azelaic Acid Revenue (USD) Million by Country (2023-2028)
11.2.2 North America Azelaic Acid Revenue (USD Million), by Type (2023-2028)
11.2.3 North America Azelaic Acid Revenue (USD Million), Market Share (%) by Applications (2023-2028)
11.3 Europe Azelaic Acid Revenue (USD Million), by Type, and Applications (2023-2028)
11.3.1 Europe Azelaic Acid Revenue (USD Million), by Country (2023-2028)
11.3.2 Europe Azelaic Acid Revenue (USD Million), by Type (2023-2028)
11.3.3 Europe Azelaic Acid Revenue (USD Million), by Applications (2023-2028)
11.4 Asia Pacific Azelaic Acid Revenue (USD Million) by Type, and Applications (2023-2028)
11.4.1 Asia Pacific Azelaic Acid Revenue (USD Million), by Country (2023-2028)
11.4.2 Asia Pacific Azelaic Acid Revenue (USD Million), by Type (2023-2028)
11.4.3 Asia Pacific Azelaic Acid Revenue (USD Million), by Applications (2023-2028)
11.5 South America Azelaic Acid Revenue (USD Million), by Type, and Applications (2023-2028)
11.5.1 South America Azelaic Acid Revenue (USD Million), by Country (2023-2028)
11.5.2 South America Azelaic Acid Revenue (USD Million), by Type (2023-2028)
11.5.3 South America Azelaic Acid Revenue (USD Million), by Applications (2023-2028)
11.6 Middle East and Africa Azelaic Acid Revenue (USD Million), by Type, and Applications (2023-2028)
11.6.1 Middle East and Africa Azelaic Acid Revenue (USD Million), by Region (2023-2028)
11.6.2 Middle East and Africa Azelaic Acid Revenue (USD Million), by Type (2023-2028)
11.6.3 Middle East and Africa Azelaic Acid Revenue (USD Million), by Applications (2023-2028)
12 Methodology and Data Sources
12.1 Methodology/Research Approach
12.1.1 Research Programs/Design
12.1.2 Market Size Estimation
12.1.3 Market Breakdown and Data Triangulation
12.2 Data Sources
12.2.1 Secondary Sources
12.2.2 Primary Sources
12.3 Disclaimer
List Of Tables
Table 1 Market Segmentation Analysis
Table 2 Global Azelaic Acid Market Companies with Areas Served
Table 3 Products Offerings Global Azelaic Acid Market
Table 4 Low Growth Scenario Forecasts
Table 5 Reference Case Growth Scenario
Table 6 High Growth Case Scenario
Table 7 Global Azelaic Acid Revenue (USD Million) And CAGR (%) By Type (2018-2028)
Table 8 Global Azelaic Acid Revenue (USD Million) And CAGR (%) By Applications (2018-2028)
Table 9 Global Azelaic Acid Revenue (USD Million) And CAGR (%) By Regions (2018-2028)
Table 10 Global Azelaic Acid Revenue (USD Million) By Type (2018-2022)
Table 11 Global Azelaic Acid Revenue Market Share (%) By Type (2018-2022)
Table 12 Global Azelaic Acid Revenue (USD Million) By Applications (2018-2022)
Table 13 Global Azelaic Acid Revenue Market Share (%) By Applications (2018-2022)
Table 14 Global Azelaic Acid Market Revenue (USD Million) By Regions (2018-2022)
Table 15 Global Azelaic Acid Market Share (%) By Regions (2018-2022)
Table 16 North America Azelaic Acid Revenue (USD Million) By Country (2018-2022)
Table 17 North America Azelaic Acid Revenue (USD Million) By Type (2018-2022)
Table 18 North America Azelaic Acid Revenue (USD Million) By Applications (2018-2022)
Table 19 Europe Azelaic Acid Revenue (USD Million) By Country (2018-2022)
Table 20 Europe Azelaic Acid Revenue (USD Million) By Type (2018-2022)
Table 21 Europe Azelaic Acid Revenue (USD Million) By Applications (2018-2022)
Table 22 Asia Pacific Azelaic Acid Revenue (USD Million) By Country (2018-2022)
Table 23 Asia Pacific Azelaic Acid Revenue (USD Million) By Type (2018-2022)
Table 24 Asia Pacific Azelaic Acid Revenue (USD Million) By Applications (2018-2022)
Table 25 South America Azelaic Acid Revenue (USD Million) By Country (2018-2022)
Table 26 South America Azelaic Acid Revenue (USD Million) By Type (2018-2022)
Table 27 South America Azelaic Acid Revenue (USD Million) By Applications (2018-2022)
Table 28 Middle East and Africa Azelaic Acid Revenue (USD Million) By Region (2018-2022)
Table 29 Middle East and Africa Azelaic Acid Revenue (USD Million) By Type (2018-2022)
Table 30 Middle East and Africa Azelaic Acid Revenue (USD Million) By Applications (2018-2022)
Table 31 Financial Analysis
Table 32 Global Azelaic Acid Revenue (USD Million) By Type (2023-2028)
Table 33 Global Azelaic Acid Revenue Market Share (%) By Type (2023-2028)
Table 34 Global Azelaic Acid Revenue (USD Million) By Applications (2023-2028)
Table 35 Global Azelaic Acid Revenue Market Share (%) By Applications (2023-2028)
Table 36 Global Azelaic Acid Market Revenue (USD Million), And Revenue (USD Million) By Regions (2023-2028)
Table 37 North America Azelaic Acid Revenue (USD)By Country (2023-2028)
Table 38 North America Azelaic Acid Revenue (USD Million) By Type (2023-2028)
Table 39 North America Azelaic Acid Revenue (USD Million) By Applications (2023-2028)
Table 40 Europe Azelaic Acid Revenue (USD Million) By Country (2023-2028)
Table 41 Europe Azelaic Acid Revenue (USD Million) By Type (2023-2028)
Table 42 Europe Azelaic Acid Revenue (USD Million) By Applications (2023-2028)
Table 43 Asia Pacific Azelaic Acid Revenue (USD Million) By Country (2023-2028)
Table 44 Asia Pacific Azelaic Acid Revenue (USD Million) By Type (2023-2028)
Table 45 Asia Pacific Azelaic Acid Revenue (USD Million) By Applications (2023-2028)
Table 46 South America Azelaic Acid Revenue (USD Million) By Country (2023-2028)
Table 47 South America Azelaic Acid Revenue (USD Million) By Type (2023-2028)
Table 48 South America Azelaic Acid Revenue (USD Million) By Applications (2023-2028)
Table 49 Middle East and Africa Azelaic Acid Revenue (USD Million) By Region (2023-2028)
Table 50 Middle East and Africa Azelaic Acid Revenue (USD Million) By Region (2023-2028)
Table 51 Middle East and Africa Azelaic Acid Revenue (USD Million) By Type (2023-2028)
Table 52 Middle East and Africa Azelaic Acid Revenue (USD Million) By Applications (2023-2028)
Table 53 Research Programs/Design for This Report
Table 54 Key Data Information from Secondary Sources
Table 55 Key Data Information from Primary Sources
List Of Figures
Figure 1 Market Scope
Figure 2 Porter’s Five Forces
Figure 3 Global Azelaic Acid Revenue (USD Million) By Type (2018-2022)
Figure 4 Global Azelaic Acid Revenue Market Share (%) By Type (2022)
Figure 5 Global Azelaic Acid Revenue (USD Million) By Applications (2018-2022)
Figure 6 Global Azelaic Acid Revenue Market Share (%) By Applications (2022)
Figure 7 Global Azelaic Acid Market Revenue (USD Million) By Regions (2018-2022)
Figure 8 Global Azelaic Acid Market Share (%) By Regions (2022)
Figure 9 North America Azelaic Acid Revenue (USD Million) By Country (2018-2022)
Figure 10 North America Azelaic Acid Revenue (USD Million) By Type (2018-2022)
Figure 11 North America Azelaic Acid Revenue (USD Million) By Applications (2018-2022)
Figure 12 Europe Azelaic Acid Revenue (USD Million) By Country (2018-2022)
Figure 13 Europe Azelaic Acid Revenue (USD Million) By Type (2018-2022)
Figure 14 Europe Azelaic Acid Revenue (USD Million) By Applications (2018-2022)
Figure 15 Asia Pacific Azelaic Acid Revenue (USD Million) By Country (2018-2022)
Figure 16 Asia Pacific Azelaic Acid Revenue (USD Million) By Type (2018-2022)
Figure 17 Asia Pacific Azelaic Acid Revenue (USD Million) By Applications (2018-2022)
Figure 18 South America Azelaic Acid Revenue (USD Million) By Country (2018-2022)
Figure 19 South America Azelaic Acid Revenue (USD Million) By Type (2018-2022)
Figure 20 South America Azelaic Acid Revenue (USD Million) By Applications (2018-2022)
Figure 21 Middle East and Africa Azelaic Acid Revenue (USD Million) By Region (2018-2022)
Figure 22 Middle East and Africa Azelaic Acid Revenue (USD Million) By Type (2018-2022)
Figure 23 Middle East and Africa Azelaic Acid Revenue (USD Million) By Applications (2018-2022)
Figure 24 Global Azelaic Acid Revenue (USD Million) By Type (2023-2028)
Figure 25 Global Azelaic Acid Revenue Market Share (%) By Type (2028)
Figure 26 Global Azelaic Acid Revenue (USD Million) By Applications (2023-2028)
Figure 27 Global Azelaic Acid Revenue Market Share (%) By Applications (2028)
Figure 28 Global Azelaic Acid Market Revenue (USD Million) By Regions (2023-2028)
Figure 29 North America Azelaic Acid Revenue (USD Million) By Country (2023-2028)
Figure 30 North America Azelaic Acid Revenue (USD Million) By Type (2023-2028)
Figure 31 North America Azelaic Acid Revenue (USD Million) By Applications (2023-2028)
Figure 32 Europe Azelaic Acid Revenue (USD Million) By Country (2023-2028)
Figure 33 Europe Azelaic Acid Revenue (USD Million) By Type (2023-2028)
Figure 34 Europe Azelaic Acid Revenue (USD Million) By Applications (2023-2028)
Figure 35 Asia Pacific Azelaic Acid Revenue (USD Million) By Country (2023-2028)
Figure 36 Asia Pacific Azelaic Acid Revenue (USD Million) By Type (2023-2028)
Figure 37 Asia Pacific Azelaic Acid Revenue (USD Million) By Applications (2023-2028)
Figure 38 South America Azelaic Acid Revenue (USD Million) By Country (2023-2028)
Figure 39 South America Azelaic Acid Revenue (USD Million) By Type (2023-2028)
Figure 40 South America Azelaic Acid Revenue (USD Million) By Applications (2023-2028)
Figure 41 Middle East and Africa Azelaic Acid Revenue (USD Million) By Region (2023-2028)
Figure 42 Middle East and Africa Azelaic Acid Revenue (USD Million) By Region (2023-2028)
Figure 43 Middle East and Africa Azelaic Acid Revenue (USD Million) By Type (2023-2028)
Figure 44 Middle East and Africa Azelaic Acid Revenue (USD Million) By Applications (2023-2028)
Figure 45 Bottom-Up and Top-Down Approaches For This Report
Figure 46 Data Triangulation
Azelaic Acid Market Segmentation
By Type
• Polymer Grade
• Technical Grade
• Pharmaceutical Grade
By Application
• Pharmaceuticals
• Plastics
• Adhesives
• Lubricants
• Electronics
• Cosmetics
By Region
• North America (United States, Canada, Mexico)
• Europe (Germany, France, United Kingdom, Spain, Italy, Others)
• Asia Pacific (China, India, Japan, South Korea, Australia, Others)
• Latin America (Brazil, Argentina, Others)
• Middle East and Africa (Saudi Arabia, UAE, Kuwait, Other Middle East, South Africa, Nigeria, Other Africa)
