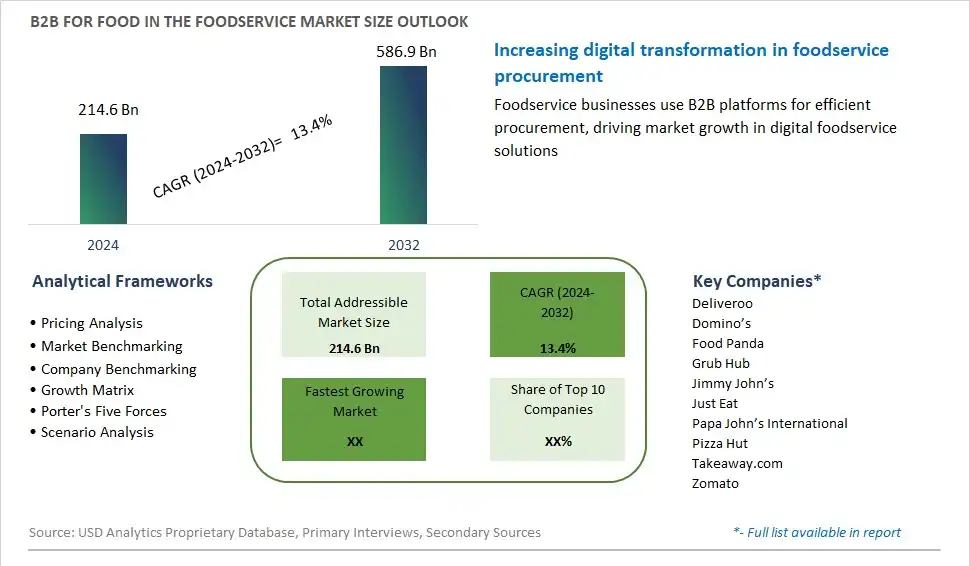
Global B2B For Food in the Foodservice Market Size is valued at $214.6 Billion in 2024 and is forecast to register a growth rate (CAGR) of 13.4% to reach $586.9 Billion by 2032.
The global B2B For Food in the Foodservice Market Comprehensive Study analyzes and forecasts the market size across 6 regions and 24 countries for diverse segments -By Type (Fresh Food, Processed food), By Application (Restaurant, Hotel, Others)
An Introduction to B2B For Food in the Foodservice Market
The B2B for Food in the Foodservice Market focuses on the supply of food products and ingredients to foodservice establishments, including restaurants, hotels, and catering services. This market is driven by the growth of the foodservice industry, increasing consumer demand for diverse and high-quality food options, and the rise of online B2B platforms. Additionally, advancements in supply chain management and the expansion of foodservice operations globally support market growth.
B2B For Food In Foodservice Competitive Landscape
The market report analyses the leading companies in the industry including Deliveroo, Domino’s, Food Panda, Grub Hub, Jimmy John’s, Just Eat, Papa John’s International, Pizza Hut, Takeaway.com, Zomato, and Others.
B2B For Food In Foodservice Market Dynamics
Market Trend: Digitalization and Online Platforms
The most prominent trend in the B2B For Food in the Foodservice Market is the digitalization and rise of online platforms. As technology advances, more foodservice businesses are adopting digital solutions for procurement and supply chain management. Online B2B platforms enable foodservice operators to easily source ingredients, compare prices, and streamline their purchasing processes. This trend is driven by the need for efficiency, cost savings, and better inventory management. The adoption of digital platforms is transforming the foodservice supply chain and enhancing the overall procurement experience
Market Driver: Growth of the Foodservice Industry
The growth of the foodservice industry is a major driver of the B2B For Food in the Foodservice Market. As consumer demand for dining out and food delivery services increases, foodservice operators are expanding their operations and requiring more efficient supply chain solutions. The need for timely and reliable sourcing of ingredients and products is driving the adoption of B2B platforms that offer streamlined procurement processes and improved supply chain visibility. The expanding foodservice industry is boosting the demand for B2B food procurement solutions
Market Opportunity: Expansion of Value-Added Services
A significant opportunity in the B2B For Food in the Foodservice Market lies in the expansion of value-added services. As competition intensifies, B2B platforms can differentiate themselves by offering additional services such as inventory management, demand forecasting, and supply chain analytics. By providing these value-added services, companies can help foodservice operators optimize their operations, reduce waste, and improve profitability. The development of comprehensive and integrated B2B solutions can attract more customers and drive market growth
B2B For Food in the Foodservice Market Share Analysis: Type (Fresh Food, Processed Food)
The processed food segment is anticipated to be the fastest-growing in the B2B For Food in the Foodservice Market by type to 2032. Processed foods offer convenience, extended shelf life, and consistent quality, making them a preferred choice for foodservice operators. The demand for processed food is driven by the increasing need for ready-to-cook and ready-to-eat meal solutions in the foodservice industry, particularly in fast-casual and quick-service restaurants. Additionally, advancements in food processing technologies and the development of high-quality, nutritious processed food products contribute to the segment's rapid growth. The expansion of the foodservice industry and the rising consumer demand for convenient dining options support the growth of the processed food segment.
B2B For Food in the Foodservice Market Share Analysis: Application (Restaurant, Hotel, Others)
The restaurant segment is expected to be the fastest-growing in the B2B For Food in the Foodservice Market by application to 2032. The demand for B2B food solutions in restaurants is driven by the increasing number of foodservice establishments and the growing trend of dining out. Restaurants require a consistent supply of high-quality ingredients and meal solutions to meet the diverse preferences of their customers. The rise of fast-casual and quick-service restaurant formats, which emphasize speed, convenience, and quality, further boosts the demand for B2B food solutions. Additionally, the growing focus on menu innovation and the incorporation of new and trending ingredients support the segment's rapid growth.
B2B For Food In Foodservice Market Segmentation
By Type
Fresh Food
Processed food
By Application
Restaurant
Hotel
Others
Countries Analyzed
North America (US, Canada, Mexico)
Europe (Germany, UK, France, Spain, Italy, Russia, Rest of Europe)
Asia Pacific (China, India, Japan, South Korea, Australia, South East Asia, Rest of Asia)
South America (Brazil, Argentina, Rest of South America)
Middle East and Africa (Saudi Arabia, UAE, Rest of Middle East, South Africa, Egypt, Rest of Africa)
B2B For Food In Foodservice Companies Profiled in the Study
Deliveroo
Domino’s
Food Panda
Grub Hub
Jimmy John’s
Just Eat
Papa John’s International
Pizza Hut
Takeaway.com
Zomato
*- List Not Exhaustive
Chapter 1. TABLE OF CONTENTS
Chapter 2. Introduction to B2B For Food In Foodservice Market
2.1. Market Overview
2.2. Key Statistics and Report Highlights
2.3. Scope of the Comprehensive Study
2.3.1. Market Definition
2.3.2 Countries and Regions Covered
2.3.3 Research Objective
2.3.4 Units, Currency, and Conversions
2.3.5 Industry Value Chain
2.4. Key Market Segments
2.5. Key Companies
2.6. Study Period
Chapter 3. Strategic Analysis Review
3.1. B2B For Food In Foodservice Pricing Analysis and Forecast
3.2. Porter’s Five Forces
3.3. Market Ecosystem
3.4. SWOT Analysis
3.5. Regulatory Scenario
3.3. Effects of Inflation, Russia-Ukraine War, moderating economic growth, and other macroeconomic factors
Chapter 4. Competitive Landscape
4.1. Market Share Analysis
4.1.1. Global B2B For Food In Foodservice Market Share by Company, 2023
4.1.2. Product Offerings of Leading B2B For Food In Foodservice Companies
4.2. Market Entropy
4.2.1. New Product Launches in the Industry
4.2.2. Mergers, Acquisitions, Joint ventures, and Partnerships
4.3. Key Strategies and Best Practices
Chapter 5. Global Market Projections: Best, Reference, and Low Case Scenarios
5.1. Growth Analysis- Case Scenario Definitions
5.2. Low Growth Case Scenario Forecasts
5.3. Reference Growth Case Scenario Forecasts
5.4. High Growth Case Scenario Forecasts
Chapter 6. Market Dynamics
6.1. B2B For Food In Foodservice Market Drivers
6.2. B2B For Food In Foodservice Market Challenges
6.6. B2B For Food In Foodservice Market Opportunities
6.4. B2B For Food In Foodservice Market Trends
Chapter 7. Global B2B For Food In Foodservice Market Outlook Trends
7.1. Global B2B For Food In Foodservice Revenue (USD Million) and CAGR (%) by Type (2021-2032)
7.2. Global B2B For Food In Foodservice Revenue (USD Million) and CAGR (%) by Application (2021-2032)
7.3. Global B2B For Food In Foodservice Revenue (USD Million) and CAGR (%) by Product (2021-2032)
By Type
Fresh Food
Processed food
By Application
Restaurant
Hotel
Others
Chapter 8. Global B2B For Food In Foodservice Regional Analysis and Outlook
8.1. Global B2B For Food In Foodservice Revenue (USD Million) By Regions (2021- 2032)
8.2. North America B2B For Food In Foodservice Revenue (USD Million) by Country (2021-2032)
8.2.1. United States B2B For Food In Foodservice Regional Analysis and Outlook
8.2.2. Canada B2B For Food In Foodservice Regional Analysis and Outlook
8.2.3. Mexico B2B For Food In Foodservice Regional Analysis and Outlook
8.3. Europe B2B For Food In Foodservice Revenue (USD Million), by Country (2021-2032)
8.3.1. Germany B2B For Food In Foodservice Regional Analysis and Outlook
8.3.2. France B2B For Food In Foodservice Regional Analysis and Outlook
8.3.3. United Kingdom B2B For Food In Foodservice Regional Analysis and Outlook
8.3.4. Spain B2B For Food In Foodservice Regional Analysis and Outlook
8.3.5. Italy B2B For Food In Foodservice Regional Analysis and Outlook
8.3.6. Russia B2B For Food In Foodservice Regional Analysis and Outlook
8.3.7. Rest of Europe B2B For Food In Foodservice Regional Analysis and Outlook
8.4. Asia Pacific B2B For Food In Foodservice Revenue (USD Million) by Country (2021-2032)
8.4.1. China B2B For Food In Foodservice Regional Analysis and Outlook
8.4.2. Japan B2B For Food In Foodservice Regional Analysis and Outlook
8.4.3. India B2B For Food In Foodservice Regional Analysis and Outlook
8.4.4. South Korea B2B For Food In Foodservice Regional Analysis and Outlook
8.4.5. Australia B2B For Food In Foodservice Regional Analysis and Outlook
8.4.6. South East Asia B2B For Food In Foodservice Regional Analysis and Outlook
8.4.7. Rest of Asia Pacific B2B For Food In Foodservice Regional Analysis and Outlook
8.5. South America B2B For Food In Foodservice Revenue (USD Million), by Country (2021-2032)
8.5.1. Brazil B2B For Food In Foodservice Regional Analysis and Outlook
8.5.2. Argentina B2B For Food In Foodservice Regional Analysis and Outlook
8.5.3. Rest of South America B2B For Food In Foodservice Regional Analysis and Outlook
8.6. Middle East and Africa B2B For Food In Foodservice Revenue (USD Million) by Country (2021-2032)
8.6.1. Middle East B2B For Food In Foodservice Regional Analysis and Outlook
8.6.2. Africa B2B For Food In Foodservice Regional Analysis and Outlook
Chapter 9. North America B2B For Food In Foodservice Analysis and Outlook
9.1. North America B2B For Food In Foodservice Revenue (USD Million) by Segments (2021-2032)
9.1.1. North America B2B For Food In Foodservice Revenue (USD Million) by Type (2021-2032)
9.1.2. North America B2B For Food In Foodservice Revenue (USD Million) by Application (2021-2032)
9.1.3. North America B2B For Food In Foodservice Revenue (USD Million) by Product (2021-2032)
By Type
Fresh Food
Processed food
By Application
Restaurant
Hotel
Others
Chapter 10. Europe B2B For Food In Foodservice Analysis and Outlook
10.1. Europe B2B For Food In Foodservice Revenue (USD Million), by Segments (USD Million) (2021-2032)
10.1.1. Europe B2B For Food In Foodservice Revenue (USD Million) by Type (2021-2032)
10.1.2. Europe B2B For Food In Foodservice Revenue (USD Million) by Application (2021-2032)
10.1.3. Europe B2B For Food In Foodservice Revenue (USD Million) by Product (2021-2032)
By Type
Fresh Food
Processed food
By Application
Restaurant
Hotel
Others
Chapter 11. Asia Pacific B2B For Food In Foodservice Analysis and Outlook
11.1. Asia Pacific B2B For Food In Foodservice Revenue (USD Million), and Revenue (USD Million) by Segments (2021-2032)
11.1.1. Asia Pacific B2B For Food In Foodservice Revenue (USD Million) by Type (2021-2032)
11.1.2. Asia Pacific B2B For Food In Foodservice Revenue (USD Million) by Application (2021-2032)
11.1.3. Asia Pacific B2B For Food In Foodservice Revenue (USD Million) by Product (2021-2032)
By Type
Fresh Food
Processed food
By Application
Restaurant
Hotel
Others
Chapter 12. South America B2B For Food In Foodservice Analysis and Outlook
12.1. South America B2B For Food In Foodservice Revenue (USD Million), by Segments (2021-2032)
12.1.1. South America B2B For Food In Foodservice Revenue (USD Million) by Type (2021-2032)
12.1.2. South America B2B For Food In Foodservice Revenue (USD Million) by Application (2021-2032)
12.1.3. South America B2B For Food In Foodservice Revenue (USD Million) by Product (2021-2032)
By Type
Fresh Food
Processed food
By Application
Restaurant
Hotel
Others
Chapter 13. Middle East and Africa B2B For Food In Foodservice Analysis and Outlook
13.1. Middle East and Africa B2B For Food In Foodservice Revenue (USD Million), by Segments (2021-2032)
13.1.1. Middle East and Africa B2B For Food In Foodservice Revenue (USD Million) by Type (2021-2032)
13.1.2. Middle East and Africa B2B For Food In Foodservice Revenue (USD Million) by Application (2021-2032)
13.1.3. Middle East and Africa B2B For Food In Foodservice Revenue (USD Million) by Product (2021-2032)
By Type
Fresh Food
Processed food
By Application
Restaurant
Hotel
Others
Chapter 14. B2B For Food In Foodservice Company Profiles
14.1 Business Overview
14.2 Product Profiles
14.3 SWOT Profiles
14.5 Recent Developments
14.6 Financial Profile
List of Companies
Deliveroo
Domino’s
Food Panda
Grub Hub
Jimmy John’s
Just Eat
Papa John’s International
Pizza Hut
Takeaway.com
Zomato
15. Methodology and Data Sources
15.1 Customization Offerings
15.2 Subscription Services
15.3 Related Reports
15.4 Publisher Expertise
LIST OF TABLES
Table 1 Market Segmentation Analysis
Table 2 Global B2B For Food In Foodservice Market Share of Leading Companies, 2023
Table 3 Product Offerings of Leading Companies
Table 4 Low Growth Scenario Forecasts
Table 5 Reference Case Growth Scenario
Table 6 High Growth Case Scenario
Table 7 Global B2B For Food In Foodservice Revenue (USD Million) And CAGR (%) By Type (2021-2032)
Table 8 Global B2B For Food In Foodservice Revenue (USD Million) And CAGR (%) By Application (2021-2032)
Table 9 Global B2B For Food In Foodservice Revenue (USD Million) And CAGR (%) By Product (2021-2032)
Table 10 Global B2B For Food In Foodservice Market Revenue (USD Million) By Regions (2021-2032)
Table 11 Global B2B For Food In Foodservice Market Share (%) By Regions (2021-2032)
Table 12 North America B2B For Food In Foodservice Revenue (USD Million) By Country (2021-2032)
Table 13 Europe B2B For Food In Foodservice Revenue (USD Million) By Country (2021-2032)
Table 14 Asia Pacific B2B For Food In Foodservice Revenue (USD Million) By Country (2021-2032)
Table 15 South America B2B For Food In Foodservice Revenue (USD Million) By Country (2021-2032)
Table 16 Middle East and Africa B2B For Food In Foodservice Revenue (USD Million) By Region (2021-2032)
Table 17 North America B2B For Food In Foodservice Revenue (USD Million) By Type (2021-2032)
Table 18 North America B2B For Food In Foodservice Revenue (USD Million) By Application (2021-2032)
Table 19 North America B2B For Food In Foodservice Revenue (USD Million) By Product (2021-2032)
Table 20 Europe B2B For Food In Foodservice Revenue (USD Million) By Type (2021-2032)
Table 21 Europe B2B For Food In Foodservice Revenue (USD Million) By Application (2021-2032)
Table 22 Europe B2B For Food In Foodservice Revenue (USD Million) By Product (2021-2032)
Table 23 Asia Pacific B2B For Food In Foodservice Revenue (USD Million) By Type (2021-2032)
Table 24 Asia Pacific B2B For Food In Foodservice Revenue (USD Million) By Application (2021-2032)
Table 25 Asia Pacific B2B For Food In Foodservice Revenue (USD Million) By Product (2021-2032)
Table 26 South America B2B For Food In Foodservice Revenue (USD Million) By Type (2021-2032)
Table 27 South America B2B For Food In Foodservice Revenue (USD Million) By Application (2021-2032)
Table 28 South America B2B For Food In Foodservice Revenue (USD Million) By Product (2021-2032)
Table 29 Middle East and Africa B2B For Food In Foodservice Revenue (USD Million) By Type (2021-2032)
Table 30 Middle East and Africa B2B For Food In Foodservice Revenue (USD Million) By Application (2021-2032)
Table 31 Middle East and Africa B2B For Food In Foodservice Revenue (USD Million) By Product (2021-2032)
LIST OF FIGURES
Figure 1. Market Scope
Figure 2. Pricing Forecasts Per Unit, 2023- 2032
Figure 3. Porter’s Five Forces
Figure 4. Global B2B For Food In Foodservice Market Revenue (USD Million) By Regions (2021-2032)
Figure 5. Global B2B For Food In Foodservice Market Share (%) By Regions (2023)
Figure 6. North America B2B For Food In Foodservice Revenue (USD Million) By Country (2021-2032)
Figure 7. United States B2B For Food In Foodservice Revenue (USD Million) By Country (2021-2032)
Figure 8. Canada B2B For Food In Foodservice Revenue (USD Million) By Country (2021-2032)
Figure 9. Mexico B2B For Food In Foodservice Revenue (USD Million) By Country (2021-2032)
Figure 10. Europe B2B For Food In Foodservice Revenue (USD Million) By Country (2021-2032)
Figure 11. Germany B2B For Food In Foodservice Revenue (USD Million) By Country (2021-2032)
Figure 12. France B2B For Food In Foodservice Revenue (USD Million) By Country (2021-2032)
Figure 13. United Kingdom B2B For Food In Foodservice Revenue (USD Million) By Country (2021-2032)
Figure 14. Spain B2B For Food In Foodservice Revenue (USD Million) By Country (2021-2032)
Figure 15. Italy B2B For Food In Foodservice Revenue (USD Million) By Country (2021-2032)
Figure 16. Russia B2B For Food In Foodservice Revenue (USD Million) By Country (2021-2032)
Figure 17. Rest of Europe B2B For Food In Foodservice Revenue (USD Million) By Country (2021-2032)
Figure 11. Asia Pacific B2B For Food In Foodservice Revenue (USD Million) By Country (2021-2032)
Figure 12. China B2B For Food In Foodservice Revenue (USD Million) By Country (2021-2032)
Figure 13. Japan B2B For Food In Foodservice Revenue (USD Million) By Country (2021-2032)
Figure 14. India B2B For Food In Foodservice Revenue (USD Million) By Country (2021-2032)
Figure 15. South Korea B2B For Food In Foodservice Revenue (USD Million) By Country (2021-2032)
Figure 16. Australia B2B For Food In Foodservice Revenue (USD Million) By Country (2021-2032)
Figure 17. South East Asia B2B For Food In Foodservice Revenue (USD Million) By Country (2021-2032)
Figure 18. South America B2B For Food In Foodservice Revenue (USD Million) By Country (2021-2032)
Figure 19. Brazil B2B For Food In Foodservice Revenue (USD Million) By Country (2021-2032)
Figure 20. Argentina B2B For Food In Foodservice Revenue (USD Million) By Country (2021-2032)
Figure 21. Rest of Asia Pacific B2B For Food In Foodservice Revenue (USD Million) By Country (2021-2032)
Figure 22. Middle East and Africa B2B For Food In Foodservice Revenue (USD Million) By Region (2021-2032)
Figure 23. Saudi Arabia B2B For Food In Foodservice Revenue (USD Million) By Region (2021-2032)
Figure 24. The UAE B2B For Food In Foodservice Revenue (USD Million) By Region (2021-2032)
Figure 25. Rest of Middle East B2B For Food In Foodservice Revenue (USD Million) By Region (2021-2032)
Figure 26. South Africa B2B For Food In Foodservice Revenue (USD Million) By Region (2021-2032)
Figure 27. Africa B2B For Food In Foodservice Revenue (USD Million) By Region (2021-2032)
Figure 28. North America B2B For Food In Foodservice Revenue (USD Million) By Type (2021-2032)
Figure 29. North America B2B For Food In Foodservice Revenue (USD Million) By Application (2021-2032)
Figure 30. North America B2B For Food In Foodservice Revenue (USD Million) By Product (2021-2032)
Figure 31. Europe B2B For Food In Foodservice Revenue (USD Million) By Type (2021-2032)
Figure 32. Europe B2B For Food In Foodservice Revenue (USD Million) By Application (2021-2032)
Figure 33. Europe B2B For Food In Foodservice Revenue (USD Million) By Product (2021-2032)
Figure 34. Asia Pacific B2B For Food In Foodservice Revenue (USD Million) By Type (2021-2032)
Figure 35. Asia Pacific B2B For Food In Foodservice Revenue (USD Million) By Application (2021-2032)
Figure 36. Asia Pacific B2B For Food In Foodservice Revenue (USD Million) By Product (2021-2032)
Figure 37. South America B2B For Food In Foodservice Revenue (USD Million) By Type (2021-2032)
Figure 38. South America B2B For Food In Foodservice Revenue (USD Million) By Application (2021-2032)
Figure 39. South America B2B For Food In Foodservice Revenue (USD Million) By Product (2021-2032)
Figure 40. Middle East and Africa B2B For Food In Foodservice Revenue (USD Million) By Type (2021-2032)
Figure 41. Middle East and Africa B2B For Food In Foodservice Revenue (USD Million) By Application (2021-2032)
Figure 42. Middle East and Africa B2B For Food In Foodservice Revenue (USD Million) By Product (2021-2032)
By Type
Fresh Food
Processed food
By Application
Restaurant
Hotel
Others
Countries Analyzed
North America (US, Canada, Mexico)
Europe (Germany, UK, France, Spain, Italy, Russia, Rest of Europe)
Asia Pacific (China, India, Japan, South Korea, Australia, South East Asia, Rest of Asia)
South America (Brazil, Argentina, Rest of South America)
Middle East and Africa (Saudi Arabia, UAE, Rest of Middle East, South Africa, Egypt, Rest of Africa)
