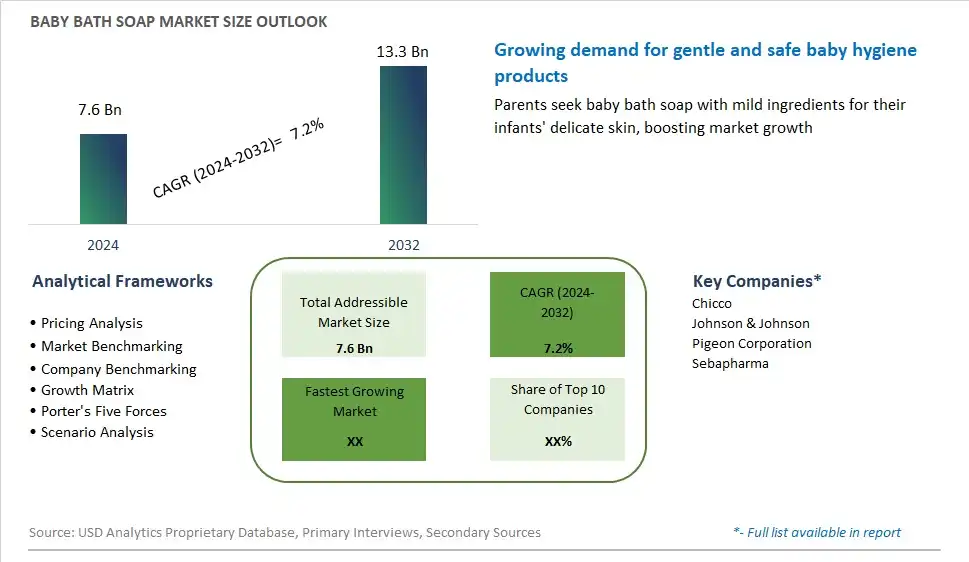
Global Baby Bath Soap Market Size is valued at $7.6 Billion in 2024 and is forecast to register a growth rate (CAGR) of 7.2% to reach $13.3 Billion by 2032.
The global Baby Bath Soap Market Comprehensive Study analyzes and forecasts the market size across 6 regions and 24 countries for diverse segments -By Type (Medicated, Non-medicated), By Application (Offline, Online)
An Introduction to Baby Bath Soap Market
The baby bath soap market in 2024 is characterized by a growing emphasis on gentle, natural formulations that prioritize the delicate skin of infants and toddlers. Parents are increasingly discerning about the products they use on their babies, seeking hypoallergenic and dermatologist-tested options that minimize the risk of irritation and allergic reactions. Manufacturers are responding to this demand by formulating baby bath soaps with mild cleansers, moisturizing ingredients, and soothing botanical extracts, avoiding harsh chemicals such as sulfates, parabens, and artificial fragrances. Additionally, eco-conscious consumers are driving the adoption of sustainable packaging and organic ingredients in baby bath soaps, aligning with their values of environmental responsibility and health-conscious parenting. As parental preferences continue to evolve towards safer and more natural baby care products, the market for gentle and eco-friendly baby bath soaps is poised for sustained growth and innovation.
Baby Bath Soap Competitive Landscape
The market report analyses the leading companies in the industry including Chicco, Johnson & Johnson, Pigeon Corporation, Sebapharma, and Others.
Baby Bath Soap Market Dynamics
Baby Bath Soap Market Trend: Rising Demand for Natural and Organic Baby Care Products
A significant trend in the baby bath soap market is the increasing demand for natural and organic baby care products. Parents are becoming more conscious of the ingredients used in baby products, preferring gentle and chemical-free formulations to protect their baby's delicate skin. This trend is driven by growing concerns about skin sensitivities, allergies, and long-term health effects associated with synthetic chemicals found in traditional baby soaps. As a result, there is a growing market for baby bath soaps formulated with natural ingredients such as plant extracts, essential oils, and gentle cleansers that are free from harsh chemicals, fragrances, and artificial colors. Manufacturers are responding to this trend by offering a variety of natural and organic baby bath soaps that provide gentle cleansing while nourishing and protecting the baby's skin.
Market Driver: Increasing Birth Rates and Parental Concerns for Baby Health and Safety
A key driver influencing the baby bath soap market is the increasing birth rates and parental concerns for baby health and safety. With growing populations and rising incomes in many regions, there is a higher demand for baby care products, including bath soaps, as new parents seek to provide the best care for their infants. Additionally, heightened awareness of environmental issues, sustainability, and product safety has led parents to prioritize natural and eco-friendly options for their babies. This driver is fueled by the desire to protect babies from exposure to potentially harmful chemicals and allergens commonly found in conventional baby bath soaps, driving demand for safer and more transparent product formulations. As birth rates continue to rise and parental concerns for baby health and safety remain paramount, the demand for natural and organic baby bath soaps is expected to increase, presenting opportunities for market growth and innovation.
Market Opportunity: Expansion into Premium and Specialty Baby Care Segments
An opportunity for growth in the baby bath soap market lies in expansion into premium and specialty baby care segments. While there is a growing demand for natural and organic baby bath soaps, there is also a segment of consumers willing to pay a premium for products with added features, benefits, or luxury packaging. Manufacturers can capitalize on this opportunity by introducing premium baby bath soaps with additional skincare benefits such as moisturizing, soothing, or aromatherapy properties. Additionally, there is potential to target niche segments such as hypoallergenic, fragrance-free, or vegan baby bath soaps to cater to specific parental preferences and baby skin conditions. By diversifying product offerings and tapping into premium and specialty segments, manufacturers can broaden their customer base, increase brand loyalty, and drive sales growth in the competitive baby care market.
Baby Bath Soap Market Share Analysis: Non-medicated held the dominant market share in 2024
The Non-medicated segment dominates the Baby Bath Soap Market as the largest segment due to its widespread use, gentle formulations, and suitability for daily cleansing routines for infants and young children. Non-medicated baby bath soaps are specially formulated with mild ingredients, such as natural oils, moisturizers, and gentle cleansers, to cater to the delicate skin of babies. These soaps are free from harsh chemicals, fragrances, and additives that may irritate or dry out sensitive baby skin, making them a preferred choice among parents and caregivers. Further, non-medicated baby bath soaps often feature hypoallergenic and dermatologist-tested formulas, ensuring they are safe and gentle for daily use on newborns and infants. Additionally, the non-medicated segment includes a variety of product options, such as bar soaps, liquid soaps, and cleansers, offering parents flexibility in choosing the most suitable format for their baby's bath time routine. With the growing emphasis on natural and gentle skincare products for babies, the Non-medicated segment continues to maintain its dominance in the Baby Bath Soap Market, catering to the evolving needs and preferences of parents worldwide.
Baby Bath Soap Market Share Analysis: Online Segment held the dominant market share in 2024
The online segment is experiencing remarkable growth in the baby bath soap market due to several key factors. Firstly, the widespread adoption of e-commerce platforms has significantly expanded the reach of baby care products, making them easily accessible to a larger consumer base. Additionally, the convenience of online shopping, with features like doorstep delivery and a wide range of product options, appeals to busy parents seeking hassle-free shopping experiences. Further, the COVID-19 pandemic has accelerated the shift towards online shopping, as consumers prioritize safety and convenience. Furthermore, online platforms offer ample opportunities for brands to engage with consumers through targeted marketing campaigns and personalized recommendations, further fueling growth in this segment. As a result, the online segment is poised to continue its rapid expansion, capitalizing on the evolving preferences and shopping behaviors of modern parents.
Baby Bath Soap Market Segmentation
By Type
Medicated
Non-medicated
By Application
Offline
Online
Countries Analyzed
North America (US, Canada, Mexico)
Europe (Germany, UK, France, Spain, Italy, Russia, Rest of Europe)
Asia Pacific (China, India, Japan, South Korea, Australia, South East Asia, Rest of Asia)
South America (Brazil, Argentina, Rest of South America)
Middle East and Africa (Saudi Arabia, UAE, Rest of Middle East, South Africa, Egypt, Rest of Africa)
Baby Bath Soap Companies Profiled in the Study
Chicco
Johnson & Johnson
Pigeon Corporation
Sebapharma
*- List Not Exhaustive
Chapter 1. TABLE OF CONTENTS
Chapter 2. Introduction to Baby Bath Soap Market
2.1. Market Overview
2.2. Key Statistics and Report Highlights
2.3. Scope of the Comprehensive Study
2.3.1. Market Definition
2.3.2 Countries and Regions Covered
2.3.3 Research Objective
2.3.4 Units, Currency, and Conversions
2.3.5 Industry Value Chain
2.4. Key Market Segments
2.5. Key Companies
2.6. Study Period
Chapter 3. Strategic Analysis Review
3.1. Baby Bath Soap Pricing Analysis and Forecast
3.2. Porter’s Five Forces
3.3. Market Ecosystem
3.4. SWOT Analysis
3.5. Regulatory Scenario
3.3. Effects of Inflation, Russia-Ukraine War, moderating economic growth, and other macroeconomic factors
Chapter 4. Competitive Landscape
4.1. Market Share Analysis
4.1.1. Global Baby Bath Soap Market Share by Company, 2023
4.1.2. Product Offerings of Leading Baby Bath Soap Companies
4.2. Market Entropy
4.2.1. New Product Launches in the Industry
4.2.2. Mergers, Acquisitions, Joint ventures, and Partnerships
4.3. Key Strategies and Best Practices
Chapter 5. Global Market Projections: Best, Reference, and Low Case Scenarios
5.1. Growth Analysis- Case Scenario Definitions
5.2. Low Growth Case Scenario Forecasts
5.3. Reference Growth Case Scenario Forecasts
5.4. High Growth Case Scenario Forecasts
Chapter 6. Market Dynamics
6.1. Baby Bath Soap Market Drivers
6.2. Baby Bath Soap Market Challenges
6.6. Baby Bath Soap Market Opportunities
6.4. Baby Bath Soap Market Trends
Chapter 7. Global Baby Bath Soap Market Outlook Trends
7.1. Global Baby Bath Soap Revenue (USD Million) and CAGR (%) by Type (2021-2032)
7.2. Global Baby Bath Soap Revenue (USD Million) and CAGR (%) by Application (2021-2032)
7.3. Global Baby Bath Soap Revenue (USD Million) and CAGR (%) by Product (2021-2032)
By Type
Medicated
Non-medicated
By Application
Offline
Online
Chapter 8. Global Baby Bath Soap Regional Analysis and Outlook
8.1. Global Baby Bath Soap Revenue (USD Million) By Regions (2021- 2032)
8.2. North America Baby Bath Soap Revenue (USD Million) by Country (2021-2032)
8.2.1. United States Baby Bath Soap Regional Analysis and Outlook
8.2.2. Canada Baby Bath Soap Regional Analysis and Outlook
8.2.3. Mexico Baby Bath Soap Regional Analysis and Outlook
8.3. Europe Baby Bath Soap Revenue (USD Million), by Country (2021-2032)
8.3.1. Germany Baby Bath Soap Regional Analysis and Outlook
8.3.2. France Baby Bath Soap Regional Analysis and Outlook
8.3.3. United Kingdom Baby Bath Soap Regional Analysis and Outlook
8.3.4. Spain Baby Bath Soap Regional Analysis and Outlook
8.3.5. Italy Baby Bath Soap Regional Analysis and Outlook
8.3.6. Russia Baby Bath Soap Regional Analysis and Outlook
8.3.7. Rest of Europe Baby Bath Soap Regional Analysis and Outlook
8.4. Asia Pacific Baby Bath Soap Revenue (USD Million) by Country (2021-2032)
8.4.1. China Baby Bath Soap Regional Analysis and Outlook
8.4.2. Japan Baby Bath Soap Regional Analysis and Outlook
8.4.3. India Baby Bath Soap Regional Analysis and Outlook
8.4.4. South Korea Baby Bath Soap Regional Analysis and Outlook
8.4.5. Australia Baby Bath Soap Regional Analysis and Outlook
8.4.6. South East Asia Baby Bath Soap Regional Analysis and Outlook
8.4.7. Rest of Asia Pacific Baby Bath Soap Regional Analysis and Outlook
8.5. South America Baby Bath Soap Revenue (USD Million), by Country (2021-2032)
8.5.1. Brazil Baby Bath Soap Regional Analysis and Outlook
8.5.2. Argentina Baby Bath Soap Regional Analysis and Outlook
8.5.3. Rest of South America Baby Bath Soap Regional Analysis and Outlook
8.6. Middle East and Africa Baby Bath Soap Revenue (USD Million) by Country (2021-2032)
8.6.1. Middle East Baby Bath Soap Regional Analysis and Outlook
8.6.2. Africa Baby Bath Soap Regional Analysis and Outlook
Chapter 9. North America Baby Bath Soap Analysis and Outlook
9.1. North America Baby Bath Soap Revenue (USD Million) by Segments (2021-2032)
9.1.1. North America Baby Bath Soap Revenue (USD Million) by Type (2021-2032)
9.1.2. North America Baby Bath Soap Revenue (USD Million) by Application (2021-2032)
9.1.3. North America Baby Bath Soap Revenue (USD Million) by Product (2021-2032)
By Type
Medicated
Non-medicated
By Application
Offline
Online
Chapter 10. Europe Baby Bath Soap Analysis and Outlook
10.1. Europe Baby Bath Soap Revenue (USD Million), by Segments (USD Million) (2021-2032)
10.1.1. Europe Baby Bath Soap Revenue (USD Million) by Type (2021-2032)
10.1.2. Europe Baby Bath Soap Revenue (USD Million) by Application (2021-2032)
10.1.3. Europe Baby Bath Soap Revenue (USD Million) by Product (2021-2032)
By Type
Medicated
Non-medicated
By Application
Offline
Online
Chapter 11. Asia Pacific Baby Bath Soap Analysis and Outlook
11.1. Asia Pacific Baby Bath Soap Revenue (USD Million), and Revenue (USD Million) by Segments (2021-2032)
11.1.1. Asia Pacific Baby Bath Soap Revenue (USD Million) by Type (2021-2032)
11.1.2. Asia Pacific Baby Bath Soap Revenue (USD Million) by Application (2021-2032)
11.1.3. Asia Pacific Baby Bath Soap Revenue (USD Million) by Product (2021-2032)
By Type
Medicated
Non-medicated
By Application
Offline
Online
Chapter 12. South America Baby Bath Soap Analysis and Outlook
12.1. South America Baby Bath Soap Revenue (USD Million), by Segments (2021-2032)
12.1.1. South America Baby Bath Soap Revenue (USD Million) by Type (2021-2032)
12.1.2. South America Baby Bath Soap Revenue (USD Million) by Application (2021-2032)
12.1.3. South America Baby Bath Soap Revenue (USD Million) by Product (2021-2032)
By Type
Medicated
Non-medicated
By Application
Offline
Online
Chapter 13. Middle East and Africa Baby Bath Soap Analysis and Outlook
13.1. Middle East and Africa Baby Bath Soap Revenue (USD Million), by Segments (2021-2032)
13.1.1. Middle East and Africa Baby Bath Soap Revenue (USD Million) by Type (2021-2032)
13.1.2. Middle East and Africa Baby Bath Soap Revenue (USD Million) by Application (2021-2032)
13.1.3. Middle East and Africa Baby Bath Soap Revenue (USD Million) by Product (2021-2032)
By Type
Medicated
Non-medicated
By Application
Offline
Online
Chapter 14. Baby Bath Soap Company Profiles
14.1 Business Overview
14.2 Product Profiles
14.3 SWOT Profiles
14.5 Recent Developments
14.6 Financial Profile
List of Companies
Chicco
Johnson & Johnson
Pigeon Corporation
Sebapharma
15. Methodology and Data Sources
15.1 Customization Offerings
15.2 Subscription Services
15.3 Related Reports
15.4 Publisher Expertise
LIST OF TABLES
Table 1 Market Segmentation Analysis
Table 2 Global Baby Bath Soap Market Share of Leading Companies, 2023
Table 3 Product Offerings of Leading Companies
Table 4 Low Growth Scenario Forecasts
Table 5 Reference Case Growth Scenario
Table 6 High Growth Case Scenario
Table 7 Global Baby Bath Soap Revenue (USD Million) And CAGR (%) By Type (2021-2032)
Table 8 Global Baby Bath Soap Revenue (USD Million) And CAGR (%) By Application (2021-2032)
Table 9 Global Baby Bath Soap Revenue (USD Million) And CAGR (%) By Product (2021-2032)
Table 10 Global Baby Bath Soap Market Revenue (USD Million) By Regions (2021-2032)
Table 11 Global Baby Bath Soap Market Share (%) By Regions (2021-2032)
Table 12 North America Baby Bath Soap Revenue (USD Million) By Country (2021-2032)
Table 13 Europe Baby Bath Soap Revenue (USD Million) By Country (2021-2032)
Table 14 Asia Pacific Baby Bath Soap Revenue (USD Million) By Country (2021-2032)
Table 15 South America Baby Bath Soap Revenue (USD Million) By Country (2021-2032)
Table 16 Middle East and Africa Baby Bath Soap Revenue (USD Million) By Region (2021-2032)
Table 17 North America Baby Bath Soap Revenue (USD Million) By Type (2021-2032)
Table 18 North America Baby Bath Soap Revenue (USD Million) By Application (2021-2032)
Table 19 North America Baby Bath Soap Revenue (USD Million) By Product (2021-2032)
Table 20 Europe Baby Bath Soap Revenue (USD Million) By Type (2021-2032)
Table 21 Europe Baby Bath Soap Revenue (USD Million) By Application (2021-2032)
Table 22 Europe Baby Bath Soap Revenue (USD Million) By Product (2021-2032)
Table 23 Asia Pacific Baby Bath Soap Revenue (USD Million) By Type (2021-2032)
Table 24 Asia Pacific Baby Bath Soap Revenue (USD Million) By Application (2021-2032)
Table 25 Asia Pacific Baby Bath Soap Revenue (USD Million) By Product (2021-2032)
Table 26 South America Baby Bath Soap Revenue (USD Million) By Type (2021-2032)
Table 27 South America Baby Bath Soap Revenue (USD Million) By Application (2021-2032)
Table 28 South America Baby Bath Soap Revenue (USD Million) By Product (2021-2032)
Table 29 Middle East and Africa Baby Bath Soap Revenue (USD Million) By Type (2021-2032)
Table 30 Middle East and Africa Baby Bath Soap Revenue (USD Million) By Application (2021-2032)
Table 31 Middle East and Africa Baby Bath Soap Revenue (USD Million) By Product (2021-2032)
LIST OF FIGURES
Figure 1. Market Scope
Figure 2. Pricing Forecasts Per Unit, 2023- 2032
Figure 3. Porter’s Five Forces
Figure 4. Global Baby Bath Soap Market Revenue (USD Million) By Regions (2021-2032)
Figure 5. Global Baby Bath Soap Market Share (%) By Regions (2023)
Figure 6. North America Baby Bath Soap Revenue (USD Million) By Country (2021-2032)
Figure 7. United States Baby Bath Soap Revenue (USD Million) By Country (2021-2032)
Figure 8. Canada Baby Bath Soap Revenue (USD Million) By Country (2021-2032)
Figure 9. Mexico Baby Bath Soap Revenue (USD Million) By Country (2021-2032)
Figure 10. Europe Baby Bath Soap Revenue (USD Million) By Country (2021-2032)
Figure 11. Germany Baby Bath Soap Revenue (USD Million) By Country (2021-2032)
Figure 12. France Baby Bath Soap Revenue (USD Million) By Country (2021-2032)
Figure 13. United Kingdom Baby Bath Soap Revenue (USD Million) By Country (2021-2032)
Figure 14. Spain Baby Bath Soap Revenue (USD Million) By Country (2021-2032)
Figure 15. Italy Baby Bath Soap Revenue (USD Million) By Country (2021-2032)
Figure 16. Russia Baby Bath Soap Revenue (USD Million) By Country (2021-2032)
Figure 17. Rest of Europe Baby Bath Soap Revenue (USD Million) By Country (2021-2032)
Figure 11. Asia Pacific Baby Bath Soap Revenue (USD Million) By Country (2021-2032)
Figure 12. China Baby Bath Soap Revenue (USD Million) By Country (2021-2032)
Figure 13. Japan Baby Bath Soap Revenue (USD Million) By Country (2021-2032)
Figure 14. India Baby Bath Soap Revenue (USD Million) By Country (2021-2032)
Figure 15. South Korea Baby Bath Soap Revenue (USD Million) By Country (2021-2032)
Figure 16. Australia Baby Bath Soap Revenue (USD Million) By Country (2021-2032)
Figure 17. South East Asia Baby Bath Soap Revenue (USD Million) By Country (2021-2032)
Figure 18. South America Baby Bath Soap Revenue (USD Million) By Country (2021-2032)
Figure 19. Brazil Baby Bath Soap Revenue (USD Million) By Country (2021-2032)
Figure 20. Argentina Baby Bath Soap Revenue (USD Million) By Country (2021-2032)
Figure 21. Rest of Asia Pacific Baby Bath Soap Revenue (USD Million) By Country (2021-2032)
Figure 22. Middle East and Africa Baby Bath Soap Revenue (USD Million) By Region (2021-2032)
Figure 23. Saudi Arabia Baby Bath Soap Revenue (USD Million) By Region (2021-2032)
Figure 24. The UAE Baby Bath Soap Revenue (USD Million) By Region (2021-2032)
Figure 25. Rest of Middle East Baby Bath Soap Revenue (USD Million) By Region (2021-2032)
Figure 26. South Africa Baby Bath Soap Revenue (USD Million) By Region (2021-2032)
Figure 27. Africa Baby Bath Soap Revenue (USD Million) By Region (2021-2032)
Figure 28. North America Baby Bath Soap Revenue (USD Million) By Type (2021-2032)
Figure 29. North America Baby Bath Soap Revenue (USD Million) By Application (2021-2032)
Figure 30. North America Baby Bath Soap Revenue (USD Million) By Product (2021-2032)
Figure 31. Europe Baby Bath Soap Revenue (USD Million) By Type (2021-2032)
Figure 32. Europe Baby Bath Soap Revenue (USD Million) By Application (2021-2032)
Figure 33. Europe Baby Bath Soap Revenue (USD Million) By Product (2021-2032)
Figure 34. Asia Pacific Baby Bath Soap Revenue (USD Million) By Type (2021-2032)
Figure 35. Asia Pacific Baby Bath Soap Revenue (USD Million) By Application (2021-2032)
Figure 36. Asia Pacific Baby Bath Soap Revenue (USD Million) By Product (2021-2032)
Figure 37. South America Baby Bath Soap Revenue (USD Million) By Type (2021-2032)
Figure 38. South America Baby Bath Soap Revenue (USD Million) By Application (2021-2032)
Figure 39. South America Baby Bath Soap Revenue (USD Million) By Product (2021-2032)
Figure 40. Middle East and Africa Baby Bath Soap Revenue (USD Million) By Type (2021-2032)
Figure 41. Middle East and Africa Baby Bath Soap Revenue (USD Million) By Application (2021-2032)
Figure 42. Middle East and Africa Baby Bath Soap Revenue (USD Million) By Product (2021-2032)
By Type
Medicated
Non-medicated
By Application
Offline
Online
Countries Analyzed
North America (US, Canada, Mexico)
Europe (Germany, UK, France, Spain, Italy, Russia, Rest of Europe)
Asia Pacific (China, India, Japan, South Korea, Australia, South East Asia, Rest of Asia)
South America (Brazil, Argentina, Rest of South America)
Middle East and Africa (Saudi Arabia, UAE, Rest of Middle East, South Africa, Egypt, Rest of Africa)
