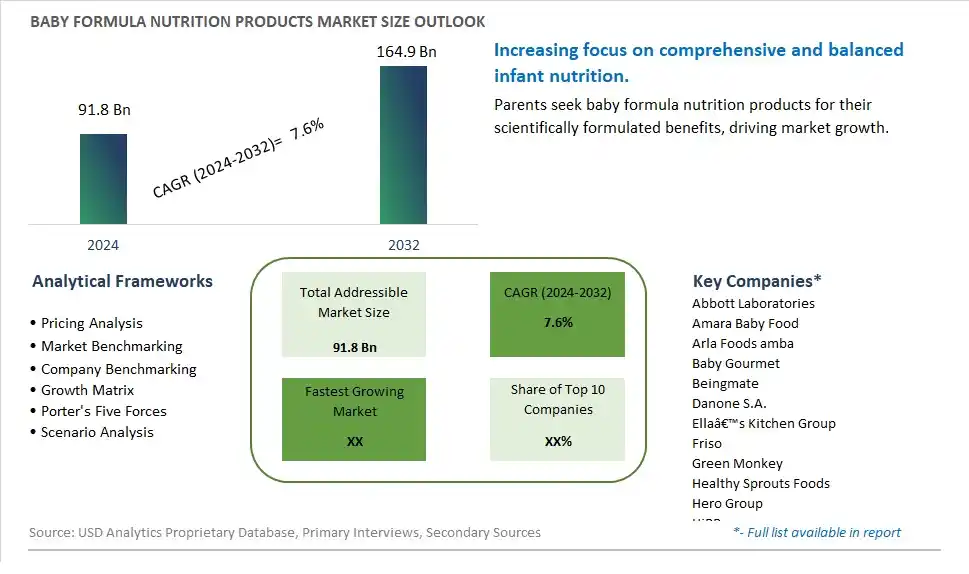
Global Baby Formula Nutrition Products Market Size is valued at $91.8 Billion in 2024 and is forecast to register a growth rate (CAGR) of 7.6% to reach $164.9 Billion by 2032.
The global Baby Formula Nutrition Products Market Comprehensive Study analyzes and forecasts the market size across 6 regions and 24 countries for diverse segments -By Type (Hypermarkets/Supermarkets, Medical Stores, Specialty Stores, Hard Discounter Stores, Others), By Application (Milk formula, Dried Baby food, Others)
An Introduction to Baby Formula Nutrition Products Market
The Baby Formula Nutrition Products market in 2024 is witnessing robust growth, driven by the rising awareness of the importance of balanced nutrition in early childhood development. The market includes a variety of specially formulated products designed to meet the dietary needs of infants and toddlers, providing essential nutrients for growth, immune support, and cognitive development. The market is supported by strong endorsement from healthcare professionals and increasing consumer demand for high-quality, evidence-based nutrition solutions. Advances in nutritional research and product formulation are enhancing the effectiveness and acceptance of baby formula nutrition products, ensuring optimal health outcomes for young children.
Baby Formula Nutrition Products Competitive Landscape
The market report analyses the leading companies in the industry including Abbott Laboratories, Amara Baby Food, Arla Foods amba, Baby Gourmet, Beingmate, Danone S.A., Ella’s Kitchen Group, Friso, Green Monkey, Healthy Sprouts Foods, Hero Group, HiPP, Meiji Co. Ltd, MJN, Morinaga, Nestlé S.A., The Kraft Heinz Company, and Others.
Baby Formula Nutrition Products Market Dynamics
Baby Formula Nutrition Products Market Trend: Rising Demand for Specialized Nutrition Solutions
The most prominent market trend for Baby Formula Nutrition Products is the rising demand for specialized nutrition solutions tailored to specific infant health needs. As parents and healthcare professionals recognize the importance of early childhood nutrition in supporting growth, development, and overall well-being, there's a growing interest in baby formulas designed to address unique nutritional requirements, such as formulas for premature infants, infants with allergies or digestive issues, and formulas enriched with specific nutrients for optimal brain development and immune support.
Baby Formula Nutrition Products Market Driver: Focus on Infant Health and Development
A key market driver for Baby Formula Nutrition Products is the focus on infant health, growth, and cognitive development. Parents, pediatricians, and nutrition experts prioritize formulas that provide essential nutrients, vitamins, and minerals necessary for healthy growth, immune function, and neurological development in babies. The drive to offer specialized formulas that meet specific nutritional needs, including iron fortification, omega-3 fatty acids, and prebiotics, propels the demand for innovative baby nutrition products that support overall infant health and development milestones.
Baby Formula Nutrition Products Market Opportunity: Innovation in Nutrient Formulation and Delivery
A potential opportunity within the Baby Formula Nutrition Products market lies in innovation in nutrient formulation and delivery systems to enhance the efficacy, bioavailability, and acceptance of infant formulas. Collaborating with scientists, researchers, and healthcare professionals can lead to the development of advanced formulas with optimized nutrient blends, micronutrients, and bioactive compounds that promote immune resilience, digestive health, and cognitive function in babies. Additionally, exploring advancements in delivery formats such as ready-to-feed liquid formulas, powdered formulas with enhanced solubility, and convenient packaging options can improve convenience, shelf stability, and ease of use for parents and caregivers, creating opportunities to capture market share and meet evolving consumer preferences in the baby nutrition segment.
Baby Formula Nutrition Products Market Share Analysis: Hypermarkets/Supermarkets segment generated the highest revenue share in the industry
The largest segment in the Baby Formula Nutrition Products Market based on sales channel is "Hypermarkets/Supermarkets." This segment represents the primary retail channel through which baby formula nutrition products are distributed and sold to consumers. Hypermarkets and supermarkets have established themselves as key players in the baby formula market due to their extensive reach, diverse product offerings, and strong consumer trust. These retail outlets provide a one-stop shopping experience for parents and caregivers, offering a wide range of baby formula brands, variants, and sizes to cater to varying nutritional needs and preferences. The prominence of the "Hypermarkets/Supermarkets" segment can be attributed to several factors driving its growth and dominance in the market. Firstly, these retail channels benefit from high foot traffic and visibility, attracting a large customer base seeking baby care products, including infant formula. Their strategic location in urban and suburban areas ensures accessibility and convenience for consumers, leading to increased sales and market share. Further, hypermarkets and supermarkets often offer competitive pricing, promotional discounts, and loyalty programs that incentivize repeat purchases and customer loyalty, further boosting sales volumes within this segment. In addition, these retail giants invest significantly in marketing and advertising campaigns to educate consumers about the nutritional benefits, safety standards, and quality assurances of the baby formula products they offer, fostering trust and brand loyalty among parents and caregivers. As a result, the "Hypermarkets/Supermarkets" segment emerges as the largest and most influential distribution channel in the Baby Formula Nutrition Products Market, playing a pivotal role in shaping consumer preferences and market trends.
Baby Formula Nutrition Products Market Share Analysis: Milk Formula is the fastest growing segment over the forecast period to 2032
The fastest-growing segment in the Baby Formula Nutrition Products Market based on application is "Milk Formula." This segment refers to infant formulas specifically designed to mimic the nutritional composition of breast milk, providing essential nutrients, vitamins, and minerals required for healthy growth and development during infancy. The "Milk Formula" segment is experiencing rapid growth primarily due to shifting consumer preferences towards convenient and nutritionally balanced feeding options for infants. Factors such as increasing awareness about the importance of early childhood nutrition, rising working mothers population, and advancements in formula technology contributing to formulations closer to breast milk composition are driving the demand for milk formula products. Further, the ongoing emphasis on infant health and well-being, coupled with the convenience and accessibility offered by milk formula products, further fuels the growth of this segment. Manufacturers are innovating to introduce new variants, such as hypoallergenic formulas, organic options, and fortified formulations, catering to diverse dietary needs and preferences of infants and toddlers. Additionally, robust marketing strategies, pediatrician recommendations, and regulatory support for infant nutrition products contribute to the expansion of the "Milk Formula" segment. As a result, it is anticipated that the "Milk Formula" segment will continue to exhibit significant growth momentum and emerge as a dominant category within the Baby Formula Nutrition Products Market by 2032.
Baby Formula Nutrition Products Market Segmentation
By Type
Hypermarkets/Supermarkets
Medical Stores
Specialty Stores
Hard Discounter Stores
Others
By Application
Milk formula
Dried Baby food
Others
Countries Analyzed
North America (US, Canada, Mexico)
Europe (Germany, UK, France, Spain, Italy, Russia, Rest of Europe)
Asia Pacific (China, India, Japan, South Korea, Australia, South East Asia, Rest of Asia)
South America (Brazil, Argentina, Rest of South America)
Middle East and Africa (Saudi Arabia, UAE, Rest of Middle East, South Africa, Egypt, Rest of Africa)
Baby Formula Nutrition Products Companies Profiled in the Study
Abbott Laboratories
Amara Baby Food
Arla Foods amba
Baby Gourmet
Beingmate
Danone S.A.
Ella’s Kitchen Group
Friso
Green Monkey
Healthy Sprouts Foods
Hero Group
HiPP
Meiji Co. Ltd
MJN
Morinaga
Nestlé S.A.
The Kraft Heinz Company
*- List Not Exhaustive
Chapter 1. TABLE OF CONTENTS
Chapter 2. Introduction to Baby Formula Nutrition Products Market
2.1. Market Overview
2.2. Key Statistics and Report Highlights
2.3. Scope of the Comprehensive Study
2.3.1. Market Definition
2.3.2 Countries and Regions Covered
2.3.3 Research Objective
2.3.4 Units, Currency, and Conversions
2.3.5 Industry Value Chain
2.4. Key Market Segments
2.5. Key Companies
2.6. Study Period
Chapter 3. Strategic Analysis Review
3.1. Baby Formula Nutrition Products Pricing Analysis and Forecast
3.2. Porter’s Five Forces
3.3. Market Ecosystem
3.4. SWOT Analysis
3.5. Regulatory Scenario
3.3. Effects of Inflation, Russia-Ukraine War, moderating economic growth, and other macroeconomic factors
Chapter 4. Competitive Landscape
4.1. Market Share Analysis
4.1.1. Global Baby Formula Nutrition Products Market Share by Company, 2023
4.1.2. Product Offerings of Leading Baby Formula Nutrition Products Companies
4.2. Market Entropy
4.2.1. New Product Launches in the Industry
4.2.2. Mergers, Acquisitions, Joint ventures, and Partnerships
4.3. Key Strategies and Best Practices
Chapter 5. Global Market Projections: Best, Reference, and Low Case Scenarios
5.1. Growth Analysis- Case Scenario Definitions
5.2. Low Growth Case Scenario Forecasts
5.3. Reference Growth Case Scenario Forecasts
5.4. High Growth Case Scenario Forecasts
Chapter 6. Market Dynamics
6.1. Baby Formula Nutrition Products Market Drivers
6.2. Baby Formula Nutrition Products Market Challenges
6.6. Baby Formula Nutrition Products Market Opportunities
6.4. Baby Formula Nutrition Products Market Trends
Chapter 7. Global Baby Formula Nutrition Products Market Outlook Trends
7.1. Global Baby Formula Nutrition Products Revenue (USD Million) and CAGR (%) by Type (2021-2032)
7.2. Global Baby Formula Nutrition Products Revenue (USD Million) and CAGR (%) by Application (2021-2032)
7.3. Global Baby Formula Nutrition Products Revenue (USD Million) and CAGR (%) by Product (2021-2032)
By Type
Hypermarkets/Supermarkets
Medical Stores
Specialty Stores
Hard Discounter Stores
Others
By Application
Milk formula
Dried Baby food
Others
Chapter 8. Global Baby Formula Nutrition Products Regional Analysis and Outlook
8.1. Global Baby Formula Nutrition Products Revenue (USD Million) By Regions (2021- 2032)
8.2. North America Baby Formula Nutrition Products Revenue (USD Million) by Country (2021-2032)
8.2.1. United States Baby Formula Nutrition Products Regional Analysis and Outlook
8.2.2. Canada Baby Formula Nutrition Products Regional Analysis and Outlook
8.2.3. Mexico Baby Formula Nutrition Products Regional Analysis and Outlook
8.3. Europe Baby Formula Nutrition Products Revenue (USD Million), by Country (2021-2032)
8.3.1. Germany Baby Formula Nutrition Products Regional Analysis and Outlook
8.3.2. France Baby Formula Nutrition Products Regional Analysis and Outlook
8.3.3. United Kingdom Baby Formula Nutrition Products Regional Analysis and Outlook
8.3.4. Spain Baby Formula Nutrition Products Regional Analysis and Outlook
8.3.5. Italy Baby Formula Nutrition Products Regional Analysis and Outlook
8.3.6. Russia Baby Formula Nutrition Products Regional Analysis and Outlook
8.3.7. Rest of Europe Baby Formula Nutrition Products Regional Analysis and Outlook
8.4. Asia Pacific Baby Formula Nutrition Products Revenue (USD Million) by Country (2021-2032)
8.4.1. China Baby Formula Nutrition Products Regional Analysis and Outlook
8.4.2. Japan Baby Formula Nutrition Products Regional Analysis and Outlook
8.4.3. India Baby Formula Nutrition Products Regional Analysis and Outlook
8.4.4. South Korea Baby Formula Nutrition Products Regional Analysis and Outlook
8.4.5. Australia Baby Formula Nutrition Products Regional Analysis and Outlook
8.4.6. South East Asia Baby Formula Nutrition Products Regional Analysis and Outlook
8.4.7. Rest of Asia Pacific Baby Formula Nutrition Products Regional Analysis and Outlook
8.5. South America Baby Formula Nutrition Products Revenue (USD Million), by Country (2021-2032)
8.5.1. Brazil Baby Formula Nutrition Products Regional Analysis and Outlook
8.5.2. Argentina Baby Formula Nutrition Products Regional Analysis and Outlook
8.5.3. Rest of South America Baby Formula Nutrition Products Regional Analysis and Outlook
8.6. Middle East and Africa Baby Formula Nutrition Products Revenue (USD Million) by Country (2021-2032)
8.6.1. Middle East Baby Formula Nutrition Products Regional Analysis and Outlook
8.6.2. Africa Baby Formula Nutrition Products Regional Analysis and Outlook
Chapter 9. North America Baby Formula Nutrition Products Analysis and Outlook
9.1. North America Baby Formula Nutrition Products Revenue (USD Million) by Segments (2021-2032)
9.1.1. North America Baby Formula Nutrition Products Revenue (USD Million) by Type (2021-2032)
9.1.2. North America Baby Formula Nutrition Products Revenue (USD Million) by Application (2021-2032)
9.1.3. North America Baby Formula Nutrition Products Revenue (USD Million) by Product (2021-2032)
By Type
Hypermarkets/Supermarkets
Medical Stores
Specialty Stores
Hard Discounter Stores
Others
By Application
Milk formula
Dried Baby food
Others
Chapter 10. Europe Baby Formula Nutrition Products Analysis and Outlook
10.1. Europe Baby Formula Nutrition Products Revenue (USD Million), by Segments (USD Million) (2021-2032)
10.1.1. Europe Baby Formula Nutrition Products Revenue (USD Million) by Type (2021-2032)
10.1.2. Europe Baby Formula Nutrition Products Revenue (USD Million) by Application (2021-2032)
10.1.3. Europe Baby Formula Nutrition Products Revenue (USD Million) by Product (2021-2032)
By Type
Hypermarkets/Supermarkets
Medical Stores
Specialty Stores
Hard Discounter Stores
Others
By Application
Milk formula
Dried Baby food
Others
Chapter 11. Asia Pacific Baby Formula Nutrition Products Analysis and Outlook
11.1. Asia Pacific Baby Formula Nutrition Products Revenue (USD Million), and Revenue (USD Million) by Segments (2021-2032)
11.1.1. Asia Pacific Baby Formula Nutrition Products Revenue (USD Million) by Type (2021-2032)
11.1.2. Asia Pacific Baby Formula Nutrition Products Revenue (USD Million) by Application (2021-2032)
11.1.3. Asia Pacific Baby Formula Nutrition Products Revenue (USD Million) by Product (2021-2032)
By Type
Hypermarkets/Supermarkets
Medical Stores
Specialty Stores
Hard Discounter Stores
Others
By Application
Milk formula
Dried Baby food
Others
Chapter 12. South America Baby Formula Nutrition Products Analysis and Outlook
12.1. South America Baby Formula Nutrition Products Revenue (USD Million), by Segments (2021-2032)
12.1.1. South America Baby Formula Nutrition Products Revenue (USD Million) by Type (2021-2032)
12.1.2. South America Baby Formula Nutrition Products Revenue (USD Million) by Application (2021-2032)
12.1.3. South America Baby Formula Nutrition Products Revenue (USD Million) by Product (2021-2032)
By Type
Hypermarkets/Supermarkets
Medical Stores
Specialty Stores
Hard Discounter Stores
Others
By Application
Milk formula
Dried Baby food
Others
Chapter 13. Middle East and Africa Baby Formula Nutrition Products Analysis and Outlook
13.1. Middle East and Africa Baby Formula Nutrition Products Revenue (USD Million), by Segments (2021-2032)
13.1.1. Middle East and Africa Baby Formula Nutrition Products Revenue (USD Million) by Type (2021-2032)
13.1.2. Middle East and Africa Baby Formula Nutrition Products Revenue (USD Million) by Application (2021-2032)
13.1.3. Middle East and Africa Baby Formula Nutrition Products Revenue (USD Million) by Product (2021-2032)
By Type
Hypermarkets/Supermarkets
Medical Stores
Specialty Stores
Hard Discounter Stores
Others
By Application
Milk formula
Dried Baby food
Others
Chapter 14. Baby Formula Nutrition Products Company Profiles
14.1 Business Overview
14.2 Product Profiles
14.3 SWOT Profiles
14.5 Recent Developments
14.6 Financial Profile
List of Companies
Abbott Laboratories
Amara Baby Food
Arla Foods amba
Baby Gourmet
Beingmate
Danone S.A.
Ella’s Kitchen Group
Friso
Green Monkey
Healthy Sprouts Foods
Hero Group
HiPP
Meiji Co. Ltd
MJN
Morinaga
Nestlé S.A.
The Kraft Heinz Company
15. Methodology and Data Sources
15.1 Customization Offerings
15.2 Subscription Services
15.3 Related Reports
15.4 Publisher Expertise
LIST OF TABLES
Table 1 Market Segmentation Analysis
Table 2 Global Baby Formula Nutrition Products Market Share of Leading Companies, 2023
Table 3 Product Offerings of Leading Companies
Table 4 Low Growth Scenario Forecasts
Table 5 Reference Case Growth Scenario
Table 6 High Growth Case Scenario
Table 7 Global Baby Formula Nutrition Products Revenue (USD Million) And CAGR (%) By Type (2021-2032)
Table 8 Global Baby Formula Nutrition Products Revenue (USD Million) And CAGR (%) By Application (2021-2032)
Table 9 Global Baby Formula Nutrition Products Revenue (USD Million) And CAGR (%) By Product (2021-2032)
Table 10 Global Baby Formula Nutrition Products Market Revenue (USD Million) By Regions (2021-2032)
Table 11 Global Baby Formula Nutrition Products Market Share (%) By Regions (2021-2032)
Table 12 North America Baby Formula Nutrition Products Revenue (USD Million) By Country (2021-2032)
Table 13 Europe Baby Formula Nutrition Products Revenue (USD Million) By Country (2021-2032)
Table 14 Asia Pacific Baby Formula Nutrition Products Revenue (USD Million) By Country (2021-2032)
Table 15 South America Baby Formula Nutrition Products Revenue (USD Million) By Country (2021-2032)
Table 16 Middle East and Africa Baby Formula Nutrition Products Revenue (USD Million) By Region (2021-2032)
Table 17 North America Baby Formula Nutrition Products Revenue (USD Million) By Type (2021-2032)
Table 18 North America Baby Formula Nutrition Products Revenue (USD Million) By Application (2021-2032)
Table 19 North America Baby Formula Nutrition Products Revenue (USD Million) By Product (2021-2032)
Table 20 Europe Baby Formula Nutrition Products Revenue (USD Million) By Type (2021-2032)
Table 21 Europe Baby Formula Nutrition Products Revenue (USD Million) By Application (2021-2032)
Table 22 Europe Baby Formula Nutrition Products Revenue (USD Million) By Product (2021-2032)
Table 23 Asia Pacific Baby Formula Nutrition Products Revenue (USD Million) By Type (2021-2032)
Table 24 Asia Pacific Baby Formula Nutrition Products Revenue (USD Million) By Application (2021-2032)
Table 25 Asia Pacific Baby Formula Nutrition Products Revenue (USD Million) By Product (2021-2032)
Table 26 South America Baby Formula Nutrition Products Revenue (USD Million) By Type (2021-2032)
Table 27 South America Baby Formula Nutrition Products Revenue (USD Million) By Application (2021-2032)
Table 28 South America Baby Formula Nutrition Products Revenue (USD Million) By Product (2021-2032)
Table 29 Middle East and Africa Baby Formula Nutrition Products Revenue (USD Million) By Type (2021-2032)
Table 30 Middle East and Africa Baby Formula Nutrition Products Revenue (USD Million) By Application (2021-2032)
Table 31 Middle East and Africa Baby Formula Nutrition Products Revenue (USD Million) By Product (2021-2032)
LIST OF FIGURES
Figure 1. Market Scope
Figure 2. Pricing Forecasts Per Unit, 2023- 2032
Figure 3. Porter’s Five Forces
Figure 4. Global Baby Formula Nutrition Products Market Revenue (USD Million) By Regions (2021-2032)
Figure 5. Global Baby Formula Nutrition Products Market Share (%) By Regions (2023)
Figure 6. North America Baby Formula Nutrition Products Revenue (USD Million) By Country (2021-2032)
Figure 7. United States Baby Formula Nutrition Products Revenue (USD Million) By Country (2021-2032)
Figure 8. Canada Baby Formula Nutrition Products Revenue (USD Million) By Country (2021-2032)
Figure 9. Mexico Baby Formula Nutrition Products Revenue (USD Million) By Country (2021-2032)
Figure 10. Europe Baby Formula Nutrition Products Revenue (USD Million) By Country (2021-2032)
Figure 11. Germany Baby Formula Nutrition Products Revenue (USD Million) By Country (2021-2032)
Figure 12. France Baby Formula Nutrition Products Revenue (USD Million) By Country (2021-2032)
Figure 13. United Kingdom Baby Formula Nutrition Products Revenue (USD Million) By Country (2021-2032)
Figure 14. Spain Baby Formula Nutrition Products Revenue (USD Million) By Country (2021-2032)
Figure 15. Italy Baby Formula Nutrition Products Revenue (USD Million) By Country (2021-2032)
Figure 16. Russia Baby Formula Nutrition Products Revenue (USD Million) By Country (2021-2032)
Figure 17. Rest of Europe Baby Formula Nutrition Products Revenue (USD Million) By Country (2021-2032)
Figure 11. Asia Pacific Baby Formula Nutrition Products Revenue (USD Million) By Country (2021-2032)
Figure 12. China Baby Formula Nutrition Products Revenue (USD Million) By Country (2021-2032)
Figure 13. Japan Baby Formula Nutrition Products Revenue (USD Million) By Country (2021-2032)
Figure 14. India Baby Formula Nutrition Products Revenue (USD Million) By Country (2021-2032)
Figure 15. South Korea Baby Formula Nutrition Products Revenue (USD Million) By Country (2021-2032)
Figure 16. Australia Baby Formula Nutrition Products Revenue (USD Million) By Country (2021-2032)
Figure 17. South East Asia Baby Formula Nutrition Products Revenue (USD Million) By Country (2021-2032)
Figure 18. South America Baby Formula Nutrition Products Revenue (USD Million) By Country (2021-2032)
Figure 19. Brazil Baby Formula Nutrition Products Revenue (USD Million) By Country (2021-2032)
Figure 20. Argentina Baby Formula Nutrition Products Revenue (USD Million) By Country (2021-2032)
Figure 21. Rest of Asia Pacific Baby Formula Nutrition Products Revenue (USD Million) By Country (2021-2032)
Figure 22. Middle East and Africa Baby Formula Nutrition Products Revenue (USD Million) By Region (2021-2032)
Figure 23. Saudi Arabia Baby Formula Nutrition Products Revenue (USD Million) By Region (2021-2032)
Figure 24. The UAE Baby Formula Nutrition Products Revenue (USD Million) By Region (2021-2032)
Figure 25. Rest of Middle East Baby Formula Nutrition Products Revenue (USD Million) By Region (2021-2032)
Figure 26. South Africa Baby Formula Nutrition Products Revenue (USD Million) By Region (2021-2032)
Figure 27. Africa Baby Formula Nutrition Products Revenue (USD Million) By Region (2021-2032)
Figure 28. North America Baby Formula Nutrition Products Revenue (USD Million) By Type (2021-2032)
Figure 29. North America Baby Formula Nutrition Products Revenue (USD Million) By Application (2021-2032)
Figure 30. North America Baby Formula Nutrition Products Revenue (USD Million) By Product (2021-2032)
Figure 31. Europe Baby Formula Nutrition Products Revenue (USD Million) By Type (2021-2032)
Figure 32. Europe Baby Formula Nutrition Products Revenue (USD Million) By Application (2021-2032)
Figure 33. Europe Baby Formula Nutrition Products Revenue (USD Million) By Product (2021-2032)
Figure 34. Asia Pacific Baby Formula Nutrition Products Revenue (USD Million) By Type (2021-2032)
Figure 35. Asia Pacific Baby Formula Nutrition Products Revenue (USD Million) By Application (2021-2032)
Figure 36. Asia Pacific Baby Formula Nutrition Products Revenue (USD Million) By Product (2021-2032)
Figure 37. South America Baby Formula Nutrition Products Revenue (USD Million) By Type (2021-2032)
Figure 38. South America Baby Formula Nutrition Products Revenue (USD Million) By Application (2021-2032)
Figure 39. South America Baby Formula Nutrition Products Revenue (USD Million) By Product (2021-2032)
Figure 40. Middle East and Africa Baby Formula Nutrition Products Revenue (USD Million) By Type (2021-2032)
Figure 41. Middle East and Africa Baby Formula Nutrition Products Revenue (USD Million) By Application (2021-2032)
Figure 42. Middle East and Africa Baby Formula Nutrition Products Revenue (USD Million) By Product (2021-2032)
By Type
Hypermarkets/Supermarkets
Medical Stores
Specialty Stores
Hard Discounter Stores
Others
By Application
Milk formula
Dried Baby food
Others
Countries Analyzed
North America (US, Canada, Mexico)
Europe (Germany, UK, France, Spain, Italy, Russia, Rest of Europe)
Asia Pacific (China, India, Japan, South Korea, Australia, South East Asia, Rest of Asia)
South America (Brazil, Argentina, Rest of South America)
Middle East and Africa (Saudi Arabia, UAE, Rest of Middle East, South Africa, Egypt, Rest of Africa)
