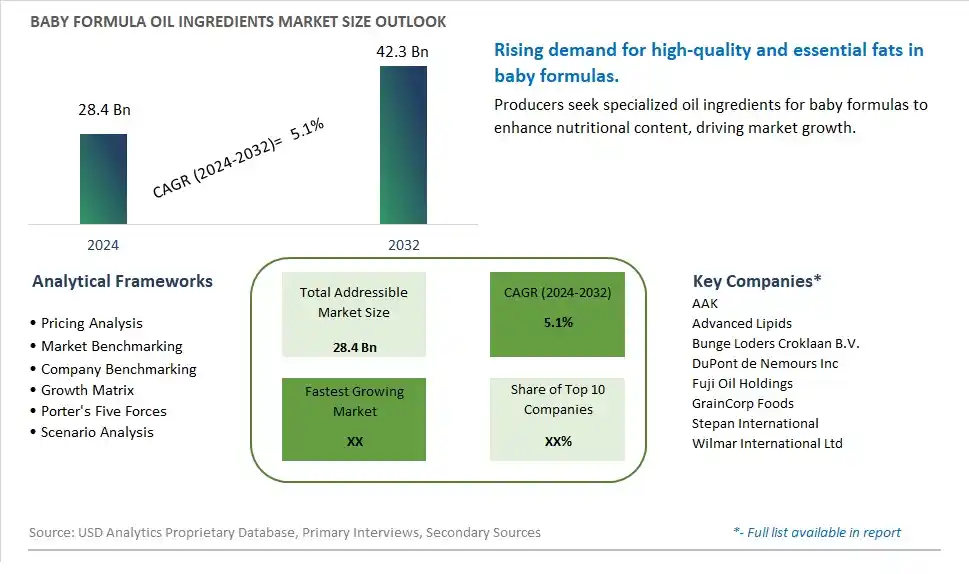
Global Baby Formula Oil Ingredients Market Size is valued at $28.4 Billion in 2024 and is forecast to register a growth rate (CAGR) of 5.1% to reach $42.3 Billion by 2032.
The global Baby Formula Oil Ingredients Market Comprehensive Study analyzes and forecasts the market size across 6 regions and 24 countries for diverse segments -By Type (OPO Fat, Others), By Application (0 to 6 Months, 6 to 12 Months, 12 to 36 Months)
An Introduction to Baby Formula Oil Ingredients Market
The Baby Formula Oil Ingredients market in 2024 is expanding steadily, driven by the essential role of oils in providing energy and supporting the development of the brain and nervous system in infants. The market includes various oil sources such as palm oil, coconut oil, soybean oil, and specialized blends tailored to infant nutritional needs. The market is supported by the growing demand for high-quality and carefully balanced oil ingredients in baby formulas. Innovations in oil extraction, refinement, and fortification are improving the safety, nutritional profile, and digestibility of these ingredients, catering to the needs of health-conscious parents and infants with specific dietary requirements.
Baby Formula Oil Ingredients Competitive Landscape
The market report analyses the leading companies in the industry including AAK, Advanced Lipids, Bunge Loders Croklaan B.V., DuPont de Nemours Inc, Fuji Oil Holdings, GrainCorp Foods, Stepan International, Wilmar International Ltd, and Others.
Baby Formula Oil Ingredients Market Dynamics
Baby Formula Oil Ingredients Market Trend: Growing Demand for Healthy Fats and Omega-3 Enrichment
The most prominent market trend for Baby Formula Oil Ingredients is the growing demand for healthy fats and omega-3 enrichment in infant formula products. As parents and healthcare providers recognize the essential role of fats in infant nutrition, there's an increasing interest in formulas enriched with high-quality oils rich in omega-3 fatty acids such as docosahexaenoic acid (DHA) and arachidonic acid (ARA). This trend reflects a focus on supporting brain development, vision, and overall health in babies, driving the demand for baby formulas with optimal oil ingredients and nutritional profiles.
Baby Formula Oil Ingredients Market Driver: Emphasis on Brain Development and Cognitive Function
A key market driver for Baby Formula Oil Ingredients is the emphasis on brain development and cognitive function in infants. Parents and healthcare professionals prioritize formulas that provide essential fatty acids, particularly DHA and ARA, as these fats are critical for brain growth, neural connectivity, and cognitive abilities during early infancy. The inclusion of high-quality oil ingredients in baby formulas drives demand as they contribute to neurological development, vision acuity, and overall cognitive health in newborns and infants.
Baby Formula Oil Ingredients Market Opportunity: Innovation in Oil Blends and Microencapsulation Technologies
A potential opportunity within the Baby Formula Oil Ingredients market lies in innovation in oil blends and microencapsulation technologies to enhance the stability, bioavailability, and nutritional benefits of omega-3 fatty acids in infant formulas. Collaborating with lipid scientists, nutrition experts, and formulation specialists can lead to the development of advanced oil blends with optimal ratios of DHA and ARA, as well as other beneficial fats such as medium-chain triglycerides (MCTs). Additionally, exploring microencapsulation techniques can improve the shelf life, sensory properties, and ease of digestion of oil ingredients, creating opportunities to offer premium, high-value baby formulas with enhanced nutritional benefits and parent satisfaction.
Baby Formula Oil Ingredients Market Share Analysis: OPO Fat segment generated the highest revenue share in the industry
The largest segment in the Baby Formula Oil Ingredients Market based on type is "OPO Fat." OPO (Oleic-Palmitic-Oleic) fat, also known as SN-2 Palmitate, is a specialized type of fat that mimics the structure of breast milk fat. It is widely used in infant formulas to enhance the nutritional profile and promote better digestion and absorption of essential nutrients by infants. The "OPO Fat" segment holds a dominant position in the market due to its proven benefits in supporting healthy growth and development in infants, such as improved fat and calcium absorption, softer stools, and reduced risk of constipation. Manufacturers prefer OPO fat as it provides a closer resemblance to the fat composition of breast milk, making it a suitable choice for formula-fed infants. The segment's prominence is also driven by increasing consumer awareness about the importance of early childhood nutrition, parental preferences for formulas that mimic breast milk properties, and endorsements from healthcare professionals regarding the benefits of OPO fat in infant formulas. Further, regulatory approvals and standards endorsing the use of OPO fat in infant nutrition further contribute to its market dominance. As a result of these factors, the "OPO Fat" segment continues to lead the Baby Formula Oil Ingredients Market and is expected to maintain its position as the largest segment in the foreseeable future, reflecting sustained demand for high-quality infant nutrition products.
Baby Formula Oil Ingredients Market Share Analysis: 0 to 6 Months is the fastest growing segment over the forecast period to 2032
The fastest-growing segment in the Baby Formula Oil Ingredients Market based on application is "0 to 6 Months." This segment represents the age group of infants from birth to six months, a critical phase in early childhood development where nutrition plays a pivotal role. The demand for specialized formula oils tailored for this age group has been on the rise due to several factors. Firstly, increased awareness among parents and caregivers regarding the importance of early nutrition for infants has led to a growing preference for high-quality infant formulas. Infants in the 0 to 6 months age range require specific nutrients and fats that mimic those found in breast milk to support their rapid growth, brain development, and overall health. Therefore, there is a significant demand for baby formula oil ingredients, such as OPO fat, which closely resemble the composition of breast milk fat and provide essential nutrients like omega-3 and omega-6 fatty acids. Additionally, advancements in infant formula formulations, along with endorsements from healthcare professionals, have contributed to the rapid growth of this segment. Regulatory support and guidelines emphasizing the nutritional needs of infants in the first six months further bolster the demand for specialized oil ingredients in infant formulas targeted at this age group. As a result, the "0 to 6 Months" segment is poised for robust growth and is expected to continue expanding substantially in the coming years, driven by the increasing focus on early childhood nutrition and the development of innovative formula products tailored to infants' specific age-related nutritional requirements.
Baby Formula Oil Ingredients Market Segmentation
By Type
OPO Fat
Others
By Application
0 to 6 Months
6 to 12 Months
12 to 36 Months
Countries Analyzed
North America (US, Canada, Mexico)
Europe (Germany, UK, France, Spain, Italy, Russia, Rest of Europe)
Asia Pacific (China, India, Japan, South Korea, Australia, South East Asia, Rest of Asia)
South America (Brazil, Argentina, Rest of South America)
Middle East and Africa (Saudi Arabia, UAE, Rest of Middle East, South Africa, Egypt, Rest of Africa)
Baby Formula Oil Ingredients Companies Profiled in the Study
AAK
Advanced Lipids
Bunge Loders Croklaan B.V.
DuPont de Nemours Inc
Fuji Oil Holdings
GrainCorp Foods
Stepan International
Wilmar International Ltd
*- List Not Exhaustive
Chapter 1. TABLE OF CONTENTS
Chapter 2. Introduction to Baby Formula Oil Ingredients Market
2.1. Market Overview
2.2. Key Statistics and Report Highlights
2.3. Scope of the Comprehensive Study
2.3.1. Market Definition
2.3.2 Countries and Regions Covered
2.3.3 Research Objective
2.3.4 Units, Currency, and Conversions
2.3.5 Industry Value Chain
2.4. Key Market Segments
2.5. Key Companies
2.6. Study Period
Chapter 3. Strategic Analysis Review
3.1. Baby Formula Oil Ingredients Pricing Analysis and Forecast
3.2. Porter’s Five Forces
3.3. Market Ecosystem
3.4. SWOT Analysis
3.5. Regulatory Scenario
3.3. Effects of Inflation, Russia-Ukraine War, moderating economic growth, and other macroeconomic factors
Chapter 4. Competitive Landscape
4.1. Market Share Analysis
4.1.1. Global Baby Formula Oil Ingredients Market Share by Company, 2023
4.1.2. Product Offerings of Leading Baby Formula Oil Ingredients Companies
4.2. Market Entropy
4.2.1. New Product Launches in the Industry
4.2.2. Mergers, Acquisitions, Joint ventures, and Partnerships
4.3. Key Strategies and Best Practices
Chapter 5. Global Market Projections: Best, Reference, and Low Case Scenarios
5.1. Growth Analysis- Case Scenario Definitions
5.2. Low Growth Case Scenario Forecasts
5.3. Reference Growth Case Scenario Forecasts
5.4. High Growth Case Scenario Forecasts
Chapter 6. Market Dynamics
6.1. Baby Formula Oil Ingredients Market Drivers
6.2. Baby Formula Oil Ingredients Market Challenges
6.6. Baby Formula Oil Ingredients Market Opportunities
6.4. Baby Formula Oil Ingredients Market Trends
Chapter 7. Global Baby Formula Oil Ingredients Market Outlook Trends
7.1. Global Baby Formula Oil Ingredients Revenue (USD Million) and CAGR (%) by Type (2021-2032)
7.2. Global Baby Formula Oil Ingredients Revenue (USD Million) and CAGR (%) by Application (2021-2032)
7.3. Global Baby Formula Oil Ingredients Revenue (USD Million) and CAGR (%) by Product (2021-2032)
By Type
OPO Fat
Others
By Application
0 to 6 Months
6 to 12 Months
12 to 36 Months
Chapter 8. Global Baby Formula Oil Ingredients Regional Analysis and Outlook
8.1. Global Baby Formula Oil Ingredients Revenue (USD Million) By Regions (2021- 2032)
8.2. North America Baby Formula Oil Ingredients Revenue (USD Million) by Country (2021-2032)
8.2.1. United States Baby Formula Oil Ingredients Regional Analysis and Outlook
8.2.2. Canada Baby Formula Oil Ingredients Regional Analysis and Outlook
8.2.3. Mexico Baby Formula Oil Ingredients Regional Analysis and Outlook
8.3. Europe Baby Formula Oil Ingredients Revenue (USD Million), by Country (2021-2032)
8.3.1. Germany Baby Formula Oil Ingredients Regional Analysis and Outlook
8.3.2. France Baby Formula Oil Ingredients Regional Analysis and Outlook
8.3.3. United Kingdom Baby Formula Oil Ingredients Regional Analysis and Outlook
8.3.4. Spain Baby Formula Oil Ingredients Regional Analysis and Outlook
8.3.5. Italy Baby Formula Oil Ingredients Regional Analysis and Outlook
8.3.6. Russia Baby Formula Oil Ingredients Regional Analysis and Outlook
8.3.7. Rest of Europe Baby Formula Oil Ingredients Regional Analysis and Outlook
8.4. Asia Pacific Baby Formula Oil Ingredients Revenue (USD Million) by Country (2021-2032)
8.4.1. China Baby Formula Oil Ingredients Regional Analysis and Outlook
8.4.2. Japan Baby Formula Oil Ingredients Regional Analysis and Outlook
8.4.3. India Baby Formula Oil Ingredients Regional Analysis and Outlook
8.4.4. South Korea Baby Formula Oil Ingredients Regional Analysis and Outlook
8.4.5. Australia Baby Formula Oil Ingredients Regional Analysis and Outlook
8.4.6. South East Asia Baby Formula Oil Ingredients Regional Analysis and Outlook
8.4.7. Rest of Asia Pacific Baby Formula Oil Ingredients Regional Analysis and Outlook
8.5. South America Baby Formula Oil Ingredients Revenue (USD Million), by Country (2021-2032)
8.5.1. Brazil Baby Formula Oil Ingredients Regional Analysis and Outlook
8.5.2. Argentina Baby Formula Oil Ingredients Regional Analysis and Outlook
8.5.3. Rest of South America Baby Formula Oil Ingredients Regional Analysis and Outlook
8.6. Middle East and Africa Baby Formula Oil Ingredients Revenue (USD Million) by Country (2021-2032)
8.6.1. Middle East Baby Formula Oil Ingredients Regional Analysis and Outlook
8.6.2. Africa Baby Formula Oil Ingredients Regional Analysis and Outlook
Chapter 9. North America Baby Formula Oil Ingredients Analysis and Outlook
9.1. North America Baby Formula Oil Ingredients Revenue (USD Million) by Segments (2021-2032)
9.1.1. North America Baby Formula Oil Ingredients Revenue (USD Million) by Type (2021-2032)
9.1.2. North America Baby Formula Oil Ingredients Revenue (USD Million) by Application (2021-2032)
9.1.3. North America Baby Formula Oil Ingredients Revenue (USD Million) by Product (2021-2032)
By Type
OPO Fat
Others
By Application
0 to 6 Months
6 to 12 Months
12 to 36 Months
Chapter 10. Europe Baby Formula Oil Ingredients Analysis and Outlook
10.1. Europe Baby Formula Oil Ingredients Revenue (USD Million), by Segments (USD Million) (2021-2032)
10.1.1. Europe Baby Formula Oil Ingredients Revenue (USD Million) by Type (2021-2032)
10.1.2. Europe Baby Formula Oil Ingredients Revenue (USD Million) by Application (2021-2032)
10.1.3. Europe Baby Formula Oil Ingredients Revenue (USD Million) by Product (2021-2032)
By Type
OPO Fat
Others
By Application
0 to 6 Months
6 to 12 Months
12 to 36 Months
Chapter 11. Asia Pacific Baby Formula Oil Ingredients Analysis and Outlook
11.1. Asia Pacific Baby Formula Oil Ingredients Revenue (USD Million), and Revenue (USD Million) by Segments (2021-2032)
11.1.1. Asia Pacific Baby Formula Oil Ingredients Revenue (USD Million) by Type (2021-2032)
11.1.2. Asia Pacific Baby Formula Oil Ingredients Revenue (USD Million) by Application (2021-2032)
11.1.3. Asia Pacific Baby Formula Oil Ingredients Revenue (USD Million) by Product (2021-2032)
By Type
OPO Fat
Others
By Application
0 to 6 Months
6 to 12 Months
12 to 36 Months
Chapter 12. South America Baby Formula Oil Ingredients Analysis and Outlook
12.1. South America Baby Formula Oil Ingredients Revenue (USD Million), by Segments (2021-2032)
12.1.1. South America Baby Formula Oil Ingredients Revenue (USD Million) by Type (2021-2032)
12.1.2. South America Baby Formula Oil Ingredients Revenue (USD Million) by Application (2021-2032)
12.1.3. South America Baby Formula Oil Ingredients Revenue (USD Million) by Product (2021-2032)
By Type
OPO Fat
Others
By Application
0 to 6 Months
6 to 12 Months
12 to 36 Months
Chapter 13. Middle East and Africa Baby Formula Oil Ingredients Analysis and Outlook
13.1. Middle East and Africa Baby Formula Oil Ingredients Revenue (USD Million), by Segments (2021-2032)
13.1.1. Middle East and Africa Baby Formula Oil Ingredients Revenue (USD Million) by Type (2021-2032)
13.1.2. Middle East and Africa Baby Formula Oil Ingredients Revenue (USD Million) by Application (2021-2032)
13.1.3. Middle East and Africa Baby Formula Oil Ingredients Revenue (USD Million) by Product (2021-2032)
By Type
OPO Fat
Others
By Application
0 to 6 Months
6 to 12 Months
12 to 36 Months
Chapter 14. Baby Formula Oil Ingredients Company Profiles
14.1 Business Overview
14.2 Product Profiles
14.3 SWOT Profiles
14.5 Recent Developments
14.6 Financial Profile
List of Companies
AAK
Advanced Lipids
Bunge Loders Croklaan B.V.
DuPont de Nemours Inc
Fuji Oil Holdings
GrainCorp Foods
Stepan International
Wilmar International Ltd
15. Methodology and Data Sources
15.1 Customization Offerings
15.2 Subscription Services
15.3 Related Reports
15.4 Publisher Expertise
LIST OF TABLES
Table 1 Market Segmentation Analysis
Table 2 Global Baby Formula Oil Ingredients Market Share of Leading Companies, 2023
Table 3 Product Offerings of Leading Companies
Table 4 Low Growth Scenario Forecasts
Table 5 Reference Case Growth Scenario
Table 6 High Growth Case Scenario
Table 7 Global Baby Formula Oil Ingredients Revenue (USD Million) And CAGR (%) By Type (2021-2032)
Table 8 Global Baby Formula Oil Ingredients Revenue (USD Million) And CAGR (%) By Application (2021-2032)
Table 9 Global Baby Formula Oil Ingredients Revenue (USD Million) And CAGR (%) By Product (2021-2032)
Table 10 Global Baby Formula Oil Ingredients Market Revenue (USD Million) By Regions (2021-2032)
Table 11 Global Baby Formula Oil Ingredients Market Share (%) By Regions (2021-2032)
Table 12 North America Baby Formula Oil Ingredients Revenue (USD Million) By Country (2021-2032)
Table 13 Europe Baby Formula Oil Ingredients Revenue (USD Million) By Country (2021-2032)
Table 14 Asia Pacific Baby Formula Oil Ingredients Revenue (USD Million) By Country (2021-2032)
Table 15 South America Baby Formula Oil Ingredients Revenue (USD Million) By Country (2021-2032)
Table 16 Middle East and Africa Baby Formula Oil Ingredients Revenue (USD Million) By Region (2021-2032)
Table 17 North America Baby Formula Oil Ingredients Revenue (USD Million) By Type (2021-2032)
Table 18 North America Baby Formula Oil Ingredients Revenue (USD Million) By Application (2021-2032)
Table 19 North America Baby Formula Oil Ingredients Revenue (USD Million) By Product (2021-2032)
Table 20 Europe Baby Formula Oil Ingredients Revenue (USD Million) By Type (2021-2032)
Table 21 Europe Baby Formula Oil Ingredients Revenue (USD Million) By Application (2021-2032)
Table 22 Europe Baby Formula Oil Ingredients Revenue (USD Million) By Product (2021-2032)
Table 23 Asia Pacific Baby Formula Oil Ingredients Revenue (USD Million) By Type (2021-2032)
Table 24 Asia Pacific Baby Formula Oil Ingredients Revenue (USD Million) By Application (2021-2032)
Table 25 Asia Pacific Baby Formula Oil Ingredients Revenue (USD Million) By Product (2021-2032)
Table 26 South America Baby Formula Oil Ingredients Revenue (USD Million) By Type (2021-2032)
Table 27 South America Baby Formula Oil Ingredients Revenue (USD Million) By Application (2021-2032)
Table 28 South America Baby Formula Oil Ingredients Revenue (USD Million) By Product (2021-2032)
Table 29 Middle East and Africa Baby Formula Oil Ingredients Revenue (USD Million) By Type (2021-2032)
Table 30 Middle East and Africa Baby Formula Oil Ingredients Revenue (USD Million) By Application (2021-2032)
Table 31 Middle East and Africa Baby Formula Oil Ingredients Revenue (USD Million) By Product (2021-2032)
LIST OF FIGURES
Figure 1. Market Scope
Figure 2. Pricing Forecasts Per Unit, 2023- 2032
Figure 3. Porter’s Five Forces
Figure 4. Global Baby Formula Oil Ingredients Market Revenue (USD Million) By Regions (2021-2032)
Figure 5. Global Baby Formula Oil Ingredients Market Share (%) By Regions (2023)
Figure 6. North America Baby Formula Oil Ingredients Revenue (USD Million) By Country (2021-2032)
Figure 7. United States Baby Formula Oil Ingredients Revenue (USD Million) By Country (2021-2032)
Figure 8. Canada Baby Formula Oil Ingredients Revenue (USD Million) By Country (2021-2032)
Figure 9. Mexico Baby Formula Oil Ingredients Revenue (USD Million) By Country (2021-2032)
Figure 10. Europe Baby Formula Oil Ingredients Revenue (USD Million) By Country (2021-2032)
Figure 11. Germany Baby Formula Oil Ingredients Revenue (USD Million) By Country (2021-2032)
Figure 12. France Baby Formula Oil Ingredients Revenue (USD Million) By Country (2021-2032)
Figure 13. United Kingdom Baby Formula Oil Ingredients Revenue (USD Million) By Country (2021-2032)
Figure 14. Spain Baby Formula Oil Ingredients Revenue (USD Million) By Country (2021-2032)
Figure 15. Italy Baby Formula Oil Ingredients Revenue (USD Million) By Country (2021-2032)
Figure 16. Russia Baby Formula Oil Ingredients Revenue (USD Million) By Country (2021-2032)
Figure 17. Rest of Europe Baby Formula Oil Ingredients Revenue (USD Million) By Country (2021-2032)
Figure 11. Asia Pacific Baby Formula Oil Ingredients Revenue (USD Million) By Country (2021-2032)
Figure 12. China Baby Formula Oil Ingredients Revenue (USD Million) By Country (2021-2032)
Figure 13. Japan Baby Formula Oil Ingredients Revenue (USD Million) By Country (2021-2032)
Figure 14. India Baby Formula Oil Ingredients Revenue (USD Million) By Country (2021-2032)
Figure 15. South Korea Baby Formula Oil Ingredients Revenue (USD Million) By Country (2021-2032)
Figure 16. Australia Baby Formula Oil Ingredients Revenue (USD Million) By Country (2021-2032)
Figure 17. South East Asia Baby Formula Oil Ingredients Revenue (USD Million) By Country (2021-2032)
Figure 18. South America Baby Formula Oil Ingredients Revenue (USD Million) By Country (2021-2032)
Figure 19. Brazil Baby Formula Oil Ingredients Revenue (USD Million) By Country (2021-2032)
Figure 20. Argentina Baby Formula Oil Ingredients Revenue (USD Million) By Country (2021-2032)
Figure 21. Rest of Asia Pacific Baby Formula Oil Ingredients Revenue (USD Million) By Country (2021-2032)
Figure 22. Middle East and Africa Baby Formula Oil Ingredients Revenue (USD Million) By Region (2021-2032)
Figure 23. Saudi Arabia Baby Formula Oil Ingredients Revenue (USD Million) By Region (2021-2032)
Figure 24. The UAE Baby Formula Oil Ingredients Revenue (USD Million) By Region (2021-2032)
Figure 25. Rest of Middle East Baby Formula Oil Ingredients Revenue (USD Million) By Region (2021-2032)
Figure 26. South Africa Baby Formula Oil Ingredients Revenue (USD Million) By Region (2021-2032)
Figure 27. Africa Baby Formula Oil Ingredients Revenue (USD Million) By Region (2021-2032)
Figure 28. North America Baby Formula Oil Ingredients Revenue (USD Million) By Type (2021-2032)
Figure 29. North America Baby Formula Oil Ingredients Revenue (USD Million) By Application (2021-2032)
Figure 30. North America Baby Formula Oil Ingredients Revenue (USD Million) By Product (2021-2032)
Figure 31. Europe Baby Formula Oil Ingredients Revenue (USD Million) By Type (2021-2032)
Figure 32. Europe Baby Formula Oil Ingredients Revenue (USD Million) By Application (2021-2032)
Figure 33. Europe Baby Formula Oil Ingredients Revenue (USD Million) By Product (2021-2032)
Figure 34. Asia Pacific Baby Formula Oil Ingredients Revenue (USD Million) By Type (2021-2032)
Figure 35. Asia Pacific Baby Formula Oil Ingredients Revenue (USD Million) By Application (2021-2032)
Figure 36. Asia Pacific Baby Formula Oil Ingredients Revenue (USD Million) By Product (2021-2032)
Figure 37. South America Baby Formula Oil Ingredients Revenue (USD Million) By Type (2021-2032)
Figure 38. South America Baby Formula Oil Ingredients Revenue (USD Million) By Application (2021-2032)
Figure 39. South America Baby Formula Oil Ingredients Revenue (USD Million) By Product (2021-2032)
Figure 40. Middle East and Africa Baby Formula Oil Ingredients Revenue (USD Million) By Type (2021-2032)
Figure 41. Middle East and Africa Baby Formula Oil Ingredients Revenue (USD Million) By Application (2021-2032)
Figure 42. Middle East and Africa Baby Formula Oil Ingredients Revenue (USD Million) By Product (2021-2032)
By Type
OPO Fat
Others
By Application
0 to 6 Months
6 to 12 Months
12 to 36 Months
Countries Analyzed
North America (US, Canada, Mexico)
Europe (Germany, UK, France, Spain, Italy, Russia, Rest of Europe)
Asia Pacific (China, India, Japan, South Korea, Australia, South East Asia, Rest of Asia)
South America (Brazil, Argentina, Rest of South America)
Middle East and Africa (Saudi Arabia, UAE, Rest of Middle East, South Africa, Egypt, Rest of Africa)
