
The global Bacteriocins and Protective Cultures Market Comprehensive Study analyzes and forecasts the market size across 6 regions and 24 countries for diverse segments -By Target Microorganism (Yeasts and Molds, Bacteria), By Application (Dairy and Dairy Products, Meat and Poultry Products, Seafood, Others)
In 2024, the Bacteriocins and Protective Cultures market is growing rapidly, fueled by the rising need for natural and effective food preservation methods. Bacteriocins, antimicrobial peptides produced by bacteria, and protective cultures are used to inhibit spoilage microorganisms and pathogens, extending the shelf life and safety of food products. The market is supported by increasing consumer demand for clean-label and minimally processed foods. Advances in microbiology and biotechnology are enhancing the efficacy and spectrum of bacteriocins and protective cultures. The market is also benefiting from the growing awareness of food safety and the push towards reducing chemical preservatives in food production.
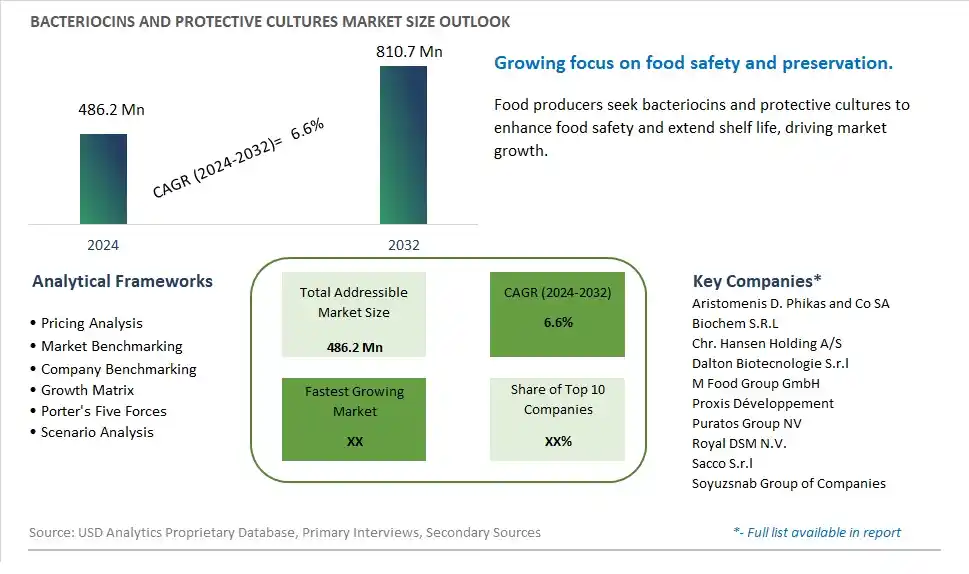
The market report analyses the leading companies in the industry including Aristomenis D. Phikas and Co SA, Biochem S.R.L, Chr. Hansen Holding A/S, Dalton Biotecnologie S.r.l, M Food Group GmbH, Proxis Développement, Puratos Group NV, Royal DSM N.V., Sacco S.r.l, Soyuzsnab Group of Companies, and Others.
The most prominent market trend for Bacteriocins and Protective Cultures is the rising demand for natural food preservation solutions. As consumers and food manufacturers prioritize clean label products and seek alternatives to synthetic preservatives, there's an increasing interest in bacteriocins and protective cultures as natural antimicrobial agents. These substances are derived from bacteria and have the ability to inhibit the growth of harmful pathogens in food, extending shelf life and enhancing food safety without the need for chemical additives. This trend reflects a broader shift towards using biologically derived solutions for food preservation, driven by consumer demand for safer, healthier, and more sustainable food options.
A key market driver for Bacteriocins and Protective Cultures is the focus on food safety and quality assurance in the food industry. With stringent regulations and increasing consumer awareness about foodborne illnesses, manufacturers are seeking effective methods to control microbial contamination and ensure product safety throughout the supply chain. Bacteriocins and protective cultures offer a natural and targeted approach to microbial control, reducing the risk of spoilage and pathogens in food products while maintaining product quality, taste, and nutritional value. The drive to meet food safety standards and consumer expectations for clean label products fuels the adoption of these natural antimicrobial solutions.
A potential opportunity within the Bacteriocins and Protective Cultures market lies in innovation in application and delivery systems to enhance efficacy and usability in food processing. Collaborating with food technologists, microbiologists, and packaging experts can lead to the development of novel formulations and delivery methods for bacteriocins and protective cultures. For example, encapsulating these antimicrobial agents in edible films or coatings can improve their stability, release profile, and effectiveness in controlling microbial growth on food surfaces. Additionally, exploring tailored solutions for specific food categories such as dairy, meat, seafood, and fresh produce can optimize antimicrobial activity while minimizing sensory impacts and ensuring compatibility with existing production processes. By leveraging advancements in technology and formulation design, there are opportunities to expand the use of bacteriocins and protective cultures in diverse food applications, improve food safety outcomes, and meet the evolving needs of the food industry and consumers.
The largest segment in the Bacteriocins and Protective Cultures Market is targeting bacteria. This segment encompasses a wide range of applications in the food and beverage industry, where bacteriocins and protective cultures play a pivotal role in ensuring food safety, extending shelf life, and enhancing product quality. Bacteriocins are antimicrobial peptides produced by certain bacteria, which inhibit the growth of pathogenic or spoilage-causing microorganisms. They are utilized as natural preservatives in various food products, including dairy, meat, poultry, seafood, and fermented foods. Protective cultures, on the other hand, consist of beneficial microorganisms that compete with harmful bacteria, preventing their proliferation and maintaining product freshness. These cultures are commonly used in fermented dairy products like yogurt, cheese, and sour cream, as well as in fermented vegetables and meats. The growing consumer demand for minimally processed, clean-label, and microbiologically safe foods has driven the adoption of bacteriocins and protective cultures by food manufacturers. With increasing concerns about foodborne illnesses and the need for sustainable food preservation solutions, the market for bacteriocins and protective cultures targeting bacteria is expected to witness substantial growth. Food companies are investing in research and development to harness the potential of these natural antimicrobial agents, thereby ensuring food safety, enhancing product quality, and meeting consumer preferences for healthier and safer food options.
The fastest-growing segment in the Bacteriocins and Protective Cultures Market is the application in dairy and dairy products. This sector is witnessing significant growth due to several factors. First and foremost, consumers are increasingly seeking healthier and safer dairy products with extended shelf life and reduced microbial risks. Bacteriocins and protective cultures play a crucial role in achieving these objectives by inhibiting the growth of harmful bacteria and spoilage microorganisms, thus ensuring the safety and quality of dairy items like yogurt, cheese, and fermented milk products. Furthermore, the growing popularity of clean-label and natural food ingredients has driven the adoption of these bio-preservatives in the dairy industry. Manufacturers are leveraging bacteriocins and protective cultures to meet consumer demands for minimally processed, preservative-free, and microbiologically safe dairy options. With ongoing research and innovation in this space, coupled with increasing consumer awareness about food safety and quality, the application of bacteriocins and protective cultures in dairy products is poised for rapid growth and market expansion by 2032.
By Target Microorganism
Yeasts and Molds
Bacteria
By Application
Dairy and Dairy Products
Meat and Poultry Products
Seafood
Others
Countries Analyzed
North America (US, Canada, Mexico)
Europe (Germany, UK, France, Spain, Italy, Russia, Rest of Europe)
Asia Pacific (China, India, Japan, South Korea, Australia, South East Asia, Rest of Asia)
South America (Brazil, Argentina, Rest of South America)
Middle East and Africa (Saudi Arabia, UAE, Rest of Middle East, South Africa, Egypt, Rest of Africa)
Aristomenis D. Phikas and Co SA
Biochem S.R.L
Chr. Hansen Holding A/S
Dalton Biotecnologie S.r.l
M Food Group GmbH
Proxis Développement
Puratos Group NV
Royal DSM N.V.
Sacco S.r.l
Soyuzsnab Group of Companies
*- List Not Exhaustive
Chapter 1. TABLE OF CONTENTS
Chapter 2. Introduction to Bacteriocins and Protective Cultures Market
2.1. Market Overview
2.2. Key Statistics and Report Highlights
2.3. Scope of the Comprehensive Study
2.3.1. Market Definition
2.3.2 Countries and Regions Covered
2.3.3 Research Objective
2.3.4 Units, Currency, and Conversions
2.3.5 Industry Value Chain
2.4. Key Market Segments
2.5. Key Companies
2.6. Study Period
Chapter 3. Strategic Analysis Review
3.1. Bacteriocins and Protective Cultures Pricing Analysis and Forecast
3.2. Porter’s Five Forces
3.3. Market Ecosystem
3.4. SWOT Analysis
3.5. Regulatory Scenario
3.3. Effects of Inflation, Russia-Ukraine War, moderating economic growth, and other macroeconomic factors
Chapter 4. Competitive Landscape
4.1. Market Share Analysis
4.1.1. Global Bacteriocins and Protective Cultures Market Share by Company, 2023
4.1.2. Product Offerings of Leading Bacteriocins and Protective Cultures Companies
4.2. Market Entropy
4.2.1. New Product Launches in the Industry
4.2.2. Mergers, Acquisitions, Joint ventures, and Partnerships
4.3. Key Strategies and Best Practices
Chapter 5. Global Market Projections: Best, Reference, and Low Case Scenarios
5.1. Growth Analysis- Case Scenario Definitions
5.2. Low Growth Case Scenario Forecasts
5.3. Reference Growth Case Scenario Forecasts
5.4. High Growth Case Scenario Forecasts
Chapter 6. Market Dynamics
6.1. Bacteriocins and Protective Cultures Market Drivers
6.2. Bacteriocins and Protective Cultures Market Challenges
6.6. Bacteriocins and Protective Cultures Market Opportunities
6.4. Bacteriocins and Protective Cultures Market Trends
Chapter 7. Global Bacteriocins and Protective Cultures Market Outlook Trends
7.1. Global Bacteriocins and Protective Cultures Revenue (USD Million) and CAGR (%) by Type (2021-2032)
7.2. Global Bacteriocins and Protective Cultures Revenue (USD Million) and CAGR (%) by Application (2021-2032)
7.3. Global Bacteriocins and Protective Cultures Revenue (USD Million) and CAGR (%) by Product (2021-2032)
By Target Microorganism
Yeasts and Molds
Bacteria
By Application
Dairy and Dairy Products
Meat and Poultry Products
Seafood
Others
Chapter 8. Global Bacteriocins and Protective Cultures Regional Analysis and Outlook
8.1. Global Bacteriocins and Protective Cultures Revenue (USD Million) By Regions (2021- 2032)
8.2. North America Bacteriocins and Protective Cultures Revenue (USD Million) by Country (2021-2032)
8.2.1. United States Bacteriocins and Protective Cultures Regional Analysis and Outlook
8.2.2. Canada Bacteriocins and Protective Cultures Regional Analysis and Outlook
8.2.3. Mexico Bacteriocins and Protective Cultures Regional Analysis and Outlook
8.3. Europe Bacteriocins and Protective Cultures Revenue (USD Million), by Country (2021-2032)
8.3.1. Germany Bacteriocins and Protective Cultures Regional Analysis and Outlook
8.3.2. France Bacteriocins and Protective Cultures Regional Analysis and Outlook
8.3.3. United Kingdom Bacteriocins and Protective Cultures Regional Analysis and Outlook
8.3.4. Spain Bacteriocins and Protective Cultures Regional Analysis and Outlook
8.3.5. Italy Bacteriocins and Protective Cultures Regional Analysis and Outlook
8.3.6. Russia Bacteriocins and Protective Cultures Regional Analysis and Outlook
8.3.7. Rest of Europe Bacteriocins and Protective Cultures Regional Analysis and Outlook
8.4. Asia Pacific Bacteriocins and Protective Cultures Revenue (USD Million) by Country (2021-2032)
8.4.1. China Bacteriocins and Protective Cultures Regional Analysis and Outlook
8.4.2. Japan Bacteriocins and Protective Cultures Regional Analysis and Outlook
8.4.3. India Bacteriocins and Protective Cultures Regional Analysis and Outlook
8.4.4. South Korea Bacteriocins and Protective Cultures Regional Analysis and Outlook
8.4.5. Australia Bacteriocins and Protective Cultures Regional Analysis and Outlook
8.4.6. South East Asia Bacteriocins and Protective Cultures Regional Analysis and Outlook
8.4.7. Rest of Asia Pacific Bacteriocins and Protective Cultures Regional Analysis and Outlook
8.5. South America Bacteriocins and Protective Cultures Revenue (USD Million), by Country (2021-2032)
8.5.1. Brazil Bacteriocins and Protective Cultures Regional Analysis and Outlook
8.5.2. Argentina Bacteriocins and Protective Cultures Regional Analysis and Outlook
8.5.3. Rest of South America Bacteriocins and Protective Cultures Regional Analysis and Outlook
8.6. Middle East and Africa Bacteriocins and Protective Cultures Revenue (USD Million) by Country (2021-2032)
8.6.1. Middle East Bacteriocins and Protective Cultures Regional Analysis and Outlook
8.6.2. Africa Bacteriocins and Protective Cultures Regional Analysis and Outlook
Chapter 9. North America Bacteriocins and Protective Cultures Analysis and Outlook
9.1. North America Bacteriocins and Protective Cultures Revenue (USD Million) by Segments (2021-2032)
9.1.1. North America Bacteriocins and Protective Cultures Revenue (USD Million) by Type (2021-2032)
9.1.2. North America Bacteriocins and Protective Cultures Revenue (USD Million) by Application (2021-2032)
9.1.3. North America Bacteriocins and Protective Cultures Revenue (USD Million) by Product (2021-2032)
By Target Microorganism
Yeasts and Molds
Bacteria
By Application
Dairy and Dairy Products
Meat and Poultry Products
Seafood
Others
Chapter 10. Europe Bacteriocins and Protective Cultures Analysis and Outlook
10.1. Europe Bacteriocins and Protective Cultures Revenue (USD Million), by Segments (USD Million) (2021-2032)
10.1.1. Europe Bacteriocins and Protective Cultures Revenue (USD Million) by Type (2021-2032)
10.1.2. Europe Bacteriocins and Protective Cultures Revenue (USD Million) by Application (2021-2032)
10.1.3. Europe Bacteriocins and Protective Cultures Revenue (USD Million) by Product (2021-2032)
By Target Microorganism
Yeasts and Molds
Bacteria
By Application
Dairy and Dairy Products
Meat and Poultry Products
Seafood
Others
Chapter 11. Asia Pacific Bacteriocins and Protective Cultures Analysis and Outlook
11.1. Asia Pacific Bacteriocins and Protective Cultures Revenue (USD Million), and Revenue (USD Million) by Segments (2021-2032)
11.1.1. Asia Pacific Bacteriocins and Protective Cultures Revenue (USD Million) by Type (2021-2032)
11.1.2. Asia Pacific Bacteriocins and Protective Cultures Revenue (USD Million) by Application (2021-2032)
11.1.3. Asia Pacific Bacteriocins and Protective Cultures Revenue (USD Million) by Product (2021-2032)
By Target Microorganism
Yeasts and Molds
Bacteria
By Application
Dairy and Dairy Products
Meat and Poultry Products
Seafood
Others
Chapter 12. South America Bacteriocins and Protective Cultures Analysis and Outlook
12.1. South America Bacteriocins and Protective Cultures Revenue (USD Million), by Segments (2021-2032)
12.1.1. South America Bacteriocins and Protective Cultures Revenue (USD Million) by Type (2021-2032)
12.1.2. South America Bacteriocins and Protective Cultures Revenue (USD Million) by Application (2021-2032)
12.1.3. South America Bacteriocins and Protective Cultures Revenue (USD Million) by Product (2021-2032)
By Target Microorganism
Yeasts and Molds
Bacteria
By Application
Dairy and Dairy Products
Meat and Poultry Products
Seafood
Others
Chapter 13. Middle East and Africa Bacteriocins and Protective Cultures Analysis and Outlook
13.1. Middle East and Africa Bacteriocins and Protective Cultures Revenue (USD Million), by Segments (2021-2032)
13.1.1. Middle East and Africa Bacteriocins and Protective Cultures Revenue (USD Million) by Type (2021-2032)
13.1.2. Middle East and Africa Bacteriocins and Protective Cultures Revenue (USD Million) by Application (2021-2032)
13.1.3. Middle East and Africa Bacteriocins and Protective Cultures Revenue (USD Million) by Product (2021-2032)
By Target Microorganism
Yeasts and Molds
Bacteria
By Application
Dairy and Dairy Products
Meat and Poultry Products
Seafood
Others
Chapter 14. Bacteriocins and Protective Cultures Company Profiles
14.1 Business Overview
14.2 Product Profiles
14.3 SWOT Profiles
14.5 Recent Developments
14.6 Financial Profile
List of Companies
Aristomenis D. Phikas and Co SA
Biochem S.R.L
Chr. Hansen Holding A/S
Dalton Biotecnologie S.r.l
M Food Group GmbH
Proxis Développement
Puratos Group NV
Royal DSM N.V.
Sacco S.r.l
Soyuzsnab Group of Companies
15. Methodology and Data Sources
15.1 Customization Offerings
15.2 Subscription Services
15.3 Related Reports
15.4 Publisher Expertise
LIST OF TABLES
Table 1 Market Segmentation Analysis
Table 2 Global Bacteriocins and Protective Cultures Market Share of Leading Companies, 2023
Table 3 Product Offerings of Leading Companies
Table 4 Low Growth Scenario Forecasts
Table 5 Reference Case Growth Scenario
Table 6 High Growth Case Scenario
Table 7 Global Bacteriocins and Protective Cultures Revenue (USD Million) And CAGR (%) By Type (2021-2032)
Table 8 Global Bacteriocins and Protective Cultures Revenue (USD Million) And CAGR (%) By Application (2021-2032)
Table 9 Global Bacteriocins and Protective Cultures Revenue (USD Million) And CAGR (%) By Product (2021-2032)
Table 10 Global Bacteriocins and Protective Cultures Market Revenue (USD Million) By Regions (2021-2032)
Table 11 Global Bacteriocins and Protective Cultures Market Share (%) By Regions (2021-2032)
Table 12 North America Bacteriocins and Protective Cultures Revenue (USD Million) By Country (2021-2032)
Table 13 Europe Bacteriocins and Protective Cultures Revenue (USD Million) By Country (2021-2032)
Table 14 Asia Pacific Bacteriocins and Protective Cultures Revenue (USD Million) By Country (2021-2032)
Table 15 South America Bacteriocins and Protective Cultures Revenue (USD Million) By Country (2021-2032)
Table 16 Middle East and Africa Bacteriocins and Protective Cultures Revenue (USD Million) By Region (2021-2032)
Table 17 North America Bacteriocins and Protective Cultures Revenue (USD Million) By Type (2021-2032)
Table 18 North America Bacteriocins and Protective Cultures Revenue (USD Million) By Application (2021-2032)
Table 19 North America Bacteriocins and Protective Cultures Revenue (USD Million) By Product (2021-2032)
Table 20 Europe Bacteriocins and Protective Cultures Revenue (USD Million) By Type (2021-2032)
Table 21 Europe Bacteriocins and Protective Cultures Revenue (USD Million) By Application (2021-2032)
Table 22 Europe Bacteriocins and Protective Cultures Revenue (USD Million) By Product (2021-2032)
Table 23 Asia Pacific Bacteriocins and Protective Cultures Revenue (USD Million) By Type (2021-2032)
Table 24 Asia Pacific Bacteriocins and Protective Cultures Revenue (USD Million) By Application (2021-2032)
Table 25 Asia Pacific Bacteriocins and Protective Cultures Revenue (USD Million) By Product (2021-2032)
Table 26 South America Bacteriocins and Protective Cultures Revenue (USD Million) By Type (2021-2032)
Table 27 South America Bacteriocins and Protective Cultures Revenue (USD Million) By Application (2021-2032)
Table 28 South America Bacteriocins and Protective Cultures Revenue (USD Million) By Product (2021-2032)
Table 29 Middle East and Africa Bacteriocins and Protective Cultures Revenue (USD Million) By Type (2021-2032)
Table 30 Middle East and Africa Bacteriocins and Protective Cultures Revenue (USD Million) By Application (2021-2032)
Table 31 Middle East and Africa Bacteriocins and Protective Cultures Revenue (USD Million) By Product (2021-2032)
LIST OF FIGURES
Figure 1. Market Scope
Figure 2. Pricing Forecasts Per Unit, 2023- 2032
Figure 3. Porter’s Five Forces
Figure 4. Global Bacteriocins and Protective Cultures Market Revenue (USD Million) By Regions (2021-2032)
Figure 5. Global Bacteriocins and Protective Cultures Market Share (%) By Regions (2023)
Figure 6. North America Bacteriocins and Protective Cultures Revenue (USD Million) By Country (2021-2032)
Figure 7. United States Bacteriocins and Protective Cultures Revenue (USD Million) By Country (2021-2032)
Figure 8. Canada Bacteriocins and Protective Cultures Revenue (USD Million) By Country (2021-2032)
Figure 9. Mexico Bacteriocins and Protective Cultures Revenue (USD Million) By Country (2021-2032)
Figure 10. Europe Bacteriocins and Protective Cultures Revenue (USD Million) By Country (2021-2032)
Figure 11. Germany Bacteriocins and Protective Cultures Revenue (USD Million) By Country (2021-2032)
Figure 12. France Bacteriocins and Protective Cultures Revenue (USD Million) By Country (2021-2032)
Figure 13. United Kingdom Bacteriocins and Protective Cultures Revenue (USD Million) By Country (2021-2032)
Figure 14. Spain Bacteriocins and Protective Cultures Revenue (USD Million) By Country (2021-2032)
Figure 15. Italy Bacteriocins and Protective Cultures Revenue (USD Million) By Country (2021-2032)
Figure 16. Russia Bacteriocins and Protective Cultures Revenue (USD Million) By Country (2021-2032)
Figure 17. Rest of Europe Bacteriocins and Protective Cultures Revenue (USD Million) By Country (2021-2032)
Figure 11. Asia Pacific Bacteriocins and Protective Cultures Revenue (USD Million) By Country (2021-2032)
Figure 12. China Bacteriocins and Protective Cultures Revenue (USD Million) By Country (2021-2032)
Figure 13. Japan Bacteriocins and Protective Cultures Revenue (USD Million) By Country (2021-2032)
Figure 14. India Bacteriocins and Protective Cultures Revenue (USD Million) By Country (2021-2032)
Figure 15. South Korea Bacteriocins and Protective Cultures Revenue (USD Million) By Country (2021-2032)
Figure 16. Australia Bacteriocins and Protective Cultures Revenue (USD Million) By Country (2021-2032)
Figure 17. South East Asia Bacteriocins and Protective Cultures Revenue (USD Million) By Country (2021-2032)
Figure 18. South America Bacteriocins and Protective Cultures Revenue (USD Million) By Country (2021-2032)
Figure 19. Brazil Bacteriocins and Protective Cultures Revenue (USD Million) By Country (2021-2032)
Figure 20. Argentina Bacteriocins and Protective Cultures Revenue (USD Million) By Country (2021-2032)
Figure 21. Rest of Asia Pacific Bacteriocins and Protective Cultures Revenue (USD Million) By Country (2021-2032)
Figure 22. Middle East and Africa Bacteriocins and Protective Cultures Revenue (USD Million) By Region (2021-2032)
Figure 23. Saudi Arabia Bacteriocins and Protective Cultures Revenue (USD Million) By Region (2021-2032)
Figure 24. The UAE Bacteriocins and Protective Cultures Revenue (USD Million) By Region (2021-2032)
Figure 25. Rest of Middle East Bacteriocins and Protective Cultures Revenue (USD Million) By Region (2021-2032)
Figure 26. South Africa Bacteriocins and Protective Cultures Revenue (USD Million) By Region (2021-2032)
Figure 27. Africa Bacteriocins and Protective Cultures Revenue (USD Million) By Region (2021-2032)
Figure 28. North America Bacteriocins and Protective Cultures Revenue (USD Million) By Type (2021-2032)
Figure 29. North America Bacteriocins and Protective Cultures Revenue (USD Million) By Application (2021-2032)
Figure 30. North America Bacteriocins and Protective Cultures Revenue (USD Million) By Product (2021-2032)
Figure 31. Europe Bacteriocins and Protective Cultures Revenue (USD Million) By Type (2021-2032)
Figure 32. Europe Bacteriocins and Protective Cultures Revenue (USD Million) By Application (2021-2032)
Figure 33. Europe Bacteriocins and Protective Cultures Revenue (USD Million) By Product (2021-2032)
Figure 34. Asia Pacific Bacteriocins and Protective Cultures Revenue (USD Million) By Type (2021-2032)
Figure 35. Asia Pacific Bacteriocins and Protective Cultures Revenue (USD Million) By Application (2021-2032)
Figure 36. Asia Pacific Bacteriocins and Protective Cultures Revenue (USD Million) By Product (2021-2032)
Figure 37. South America Bacteriocins and Protective Cultures Revenue (USD Million) By Type (2021-2032)
Figure 38. South America Bacteriocins and Protective Cultures Revenue (USD Million) By Application (2021-2032)
Figure 39. South America Bacteriocins and Protective Cultures Revenue (USD Million) By Product (2021-2032)
Figure 40. Middle East and Africa Bacteriocins and Protective Cultures Revenue (USD Million) By Type (2021-2032)
Figure 41. Middle East and Africa Bacteriocins and Protective Cultures Revenue (USD Million) By Application (2021-2032)
Figure 42. Middle East and Africa Bacteriocins and Protective Cultures Revenue (USD Million) By Product (2021-2032)
By Target Microorganism
Yeasts and Molds
Bacteria
By Application
Dairy and Dairy Products
Meat and Poultry Products
Seafood
Others
Countries Analyzed
North America (US, Canada, Mexico)
Europe (Germany, UK, France, Spain, Italy, Russia, Rest of Europe)
Asia Pacific (China, India, Japan, South Korea, Australia, South East Asia, Rest of Asia)
South America (Brazil, Argentina, Rest of South America)
Middle East and Africa (Saudi Arabia, UAE, Rest of Middle East, South Africa, Egypt, Rest of Africa)
Global Bacteriocins and Protective Cultures Market Size is valued at $486.2 Million in 2024 and is forecast to register a growth rate (CAGR) of 6.6% to reach $810.7 Million by 2032.
Emerging Markets across Asia Pacific, Europe, and Americas present robust growth prospects.
Aristomenis D. Phikas and Co SA, Biochem S.R.L, Chr. Hansen Holding A/S, Dalton Biotecnologie S.r.l, M Food Group GmbH, Proxis Développement, Puratos Group NV, Royal DSM N.V., Sacco S.r.l, Soyuzsnab Group of Companies
Base Year- 2023; Estimated Year- 2024; Historic Period- 2018-2023; Forecast period- 2024 to 2032; Currency: Revenue (USD); Volume