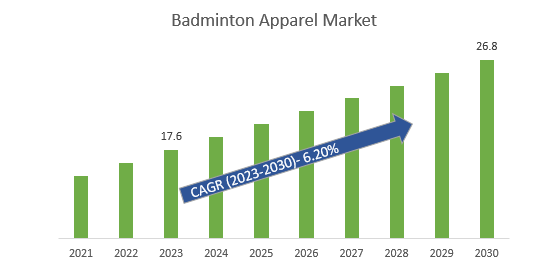
The global Badminton Apparel Market Size is estimated to be US$ 17.6 Billion in 2023 and is poised to register 6.2% growth over the forecast period from 2023 to 2030.
The market growth is driven by increased demand for badminton apparel, evolving consumer preferences toward healthier lifestyles and fitness activities, and others. Companies are launching personalized equipment, and providing data-driven insights to enhance performance. Further, products with lightweight materials to improve players' mobility and aesthetics support the market growth.
Leading key market players are investing in Innovation in Fabric Technology, Smart Apparel, Customization and Personalization, Global Sporting Events, E-Commerce Growth, Virtual Fitting Technology, Diverse Inclusivity, and others to boost market shares in the industry.
Market Overview
The increasing global participation in badminton, coupled with a growing emphasis on health and fitness, fuels the demand for specialized sportswear. Innovations in fabric technology are enhancing comfort and performance, while athleisure and streetwear influences are expanding the market beyond traditional sports contexts. The sport gains prominence through international events and localized trends, and the market's future scope in innovative, inclusive, and technologically advanced offerings that bridge functionality and style.
Market Dynamics
Market Trends: - Companies are launching Innovative Fabric Technologies to attract a consumer base:
The advanced materials and fabric technology, such as moisture-wicking, quick-drying, and lightweight fabrics, are enhancing comfort and performance in badminton apparel. Players are increasingly seeking apparel that offers both functionality and comfort. As the demand for high-performance sportswear grows, brands that continue to invest in innovative fabric technology are shaping the future of badminton apparel.
Market Driver: Health and Fitness Awareness drives market outlook
The badminton apparel market is being promoted for health and fitness manufacturers are partnering with fitness clubs and health organizations to offer discounts and promotions on badminton apparel is being featured in magazines and websites and is being used as a promotional item at events.
The emphasis on health and fitness has propelled more individuals towards active lifestyles, including engaging in badminton. As health-conscious consumers prioritize clothing that complements their physical endeavors, badminton apparel brands have shifted towards designs that prioritize functionality.
Features like moisture management, thermoregulation, and quick-drying materials enhance player comfort during intense matches and practice sessions. In addition, as health-conscious individuals continue to engage in sports activities, the demand for functional and performance-oriented apparel remains steady over time.
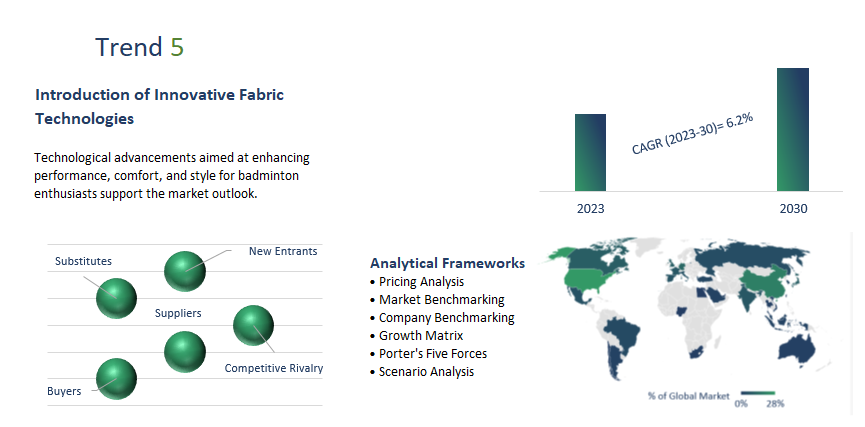
Market Opportunity- Introduction of Innovative Fabric Technologies
Technological advancements aimed at enhancing performance, comfort, and style for badminton enthusiasts support the market outlook. Materials like moisture-wicking fabrics manage sweat effectively, maintaining dryness during rigorous play, while flexible blends like elastane facilitate unrestricted movement essential for dynamic gameplay.
These technologies also address thermoregulation needs, offering heat retention in colder conditions and heat dissipation in warmer environments. Lightweight, durable, and ventilated fabrics contribute to player ease and longevity of apparel. Additionally, these innovations allow for aesthetic exploration, customization options, and sustainability initiatives, reinforcing brand differentiation and loyalty.
Market Segmentation
Top Wear Badminton Apparel:
Top wear in badminton apparel encompasses a range of clothing items designed to enhance players' performance, comfort, and style on the court. Wide range of clothing including Badminton Jerseys/Shirts, Badminton Polo Shirts, Badminton Tank Tops, Badminton Hoodies/Sweatshirts, Badminton Jackets, Badminton Compression Tops, Badminton Long-Sleeve Shirts, Badminton Rash Guards, Badminton Performance T-Shirts, Badminton Training Tops, and others.
Badminton Apparel Market Premium:
Premium badminton apparel beyond basic functionality, often incorporating advanced fabric technologies, innovative designs, and meticulous craftsmanship to provide players with the best possible experience on and off the court. These products are associated with well-known brands that prioritize quality, comfort, and style. Premium badminton apparel may include cutting-edge moisture-wicking fabrics, ergonomic designs for optimal movement, specialized ventilation systems, and attention to detail in stitching and finishing.
Natural Fabric in the Badminton Apparel Market:
Natural fabrics play a significant role in the Badminton Apparel Market, offering a range of benefits that cater to players' comfort, performance, and sustainability preferences. Wide range of natural fabric Comfort and Breathability, Moisture Absorption, Softness and Skin-Friendly, Environmental Sustainability, Breathable and Lightweight, Temperature Regulation, and others.
Business-to-Business" (B2B) segment within the Badminton Apparel Market:
The Badminton Apparel Market represents a dynamic ecosystem where companies supply sportswear to other businesses, such as retailers, teams, clubs, and event organizers. Individual consumers play a pivotal role in shaping the overall industry landscape customization and Personalization, Event Merchandising, Sponsorship, and Branding, Industry Growth, and Innovation, Streamlined Supply Chains, Market Expansion, and Global Reach, Supporting Grassroots and Youth Development, Strategic Collaborations, Economic Contribution, and others.
Segmentation
By Product Type
- Top Wear Badminton Apparel
- Bottom Wear
- Badminton Footwear
- Badminton accessories
- Others
By Price Point
By Material
- Natural Fabric
- Synthetic Fabric
- Others
By Distribution Channel
By Region
- North America (United States, Canada, Mexico)
- Europe (Germany, France, United Kingdom, Spain, Italy, Others)
- Asia Pacific (China, India, Japan, South Korea, Australia, Others)
- Latin America (Brazil, Argentina, Others)
- Middle East and Africa (Saudi Arabia, UAE, Kuwait, Other Middle East, South Africa, Nigeria, Other Africa)
Key Players
Leading companies profiled in the study include-
- Ruby Glamour Sdn Bhd
- YONEX Co., Ltd
- Li-Ning Company Ltd
- Absolute Protech Sports (M) Sdn Bhd
- Ashaway Line & Twine Mfg. Co.
- Under Armour, Inc
- Victor Rackets Industrial Corporation
- The Wilson Sporting Goods Company
- Li-Ning Co. Ltd
- FELET International Holdings Sdn Bhd
Badminton Apparel Market Outlook 2023
1 Market Overview
1.1 Introduction to Badminton Apparel Market
1.2 Scope of the Study
1.3 Research Objective
1.3.1 Key Market Scope and Segments
1.3.2 Players Covered
1.3.3 Years Considered
2 Executive Summary
2.1 2023 Badminton Apparel Industry- Market Statistics
3 Market Dynamics
3.1 Market Drivers
3.2 Market Challenges
3.3 Market Opportunities
3.4 Market Trends
4 Market Factor Analysis
4.1 Porter’s Five Forces
4.2 Market Entropy
4.2.1 Global Badminton Apparel Market Companies with Area Served
4.2.2 Products Offerings Global Badminton Apparel Market
5 COVID-19 Impact Analysis and Outlook Scenarios
5.1.1 Covid-19 Impact Analysis
5.1.2 Post-COVID-19 Scenario- Low Growth Case
5.1.3 Post-COVID-19 Scenario- Reference Growth Case
5.1.4 Post-COVID-19 Scenario- Low Growth Case
6 Global Badminton Apparel Market Trends
6.1 Global Badminton Apparel Revenue (USD Million) and CAGR (%) by Type (2018-2030)
6.2 Global Badminton Apparel Revenue (USD Million) and CAGR (%) by Applications (2018-2030)
6.3 Global Badminton Apparel Revenue (USD Million) and CAGR (%) by Regions (2018-2030)
7 Global Badminton Apparel Market Revenue (USD Million) by Type, and Applications (2018-2022)
7.1 Global Badminton Apparel Revenue (USD Million) by Type (2018-2022)
7.1.1 Global Badminton Apparel Revenue (USD Million), Market Share (%) by Type (2018-2022)
7.2 Global Badminton Apparel Revenue (USD Million) by Applications (2018-2022)
7.2.1 Global Badminton Apparel Revenue (USD Million), Market Share (%) by Applications (2018-2022)
8 Global Badminton Apparel Development Regional Status and Outlook
8.1 Global Badminton Apparel Revenue (USD Million) By Regions (2018-2022)
8.2 North America Badminton Apparel Revenue (USD Million) by Type, and Application (2018-2022)
8.2.1 North America Badminton Apparel Revenue (USD Million) by Country (2018-2022)
8.2.2 North America Badminton Apparel Revenue (USD Million) by Type (2018-2022)
8.2.3 North America Badminton Apparel Revenue (USD Million) by Applications (2018-2022)
8.3 Europe Badminton Apparel Revenue (USD Million), by Type, and Applications (USD Million) (2018-2022)
8.3.1 Europe Badminton Apparel Revenue (USD Million), by Country (2018-2022)
8.3.2 Europe Badminton Apparel Revenue (USD Million) by Type (2018-2022)
8.3.3 Europe Badminton Apparel Revenue (USD Million) by Applications (2018-2022)
8.4 Asia Pacific Badminton Apparel Revenue (USD Million), and Revenue (USD Million) by Type, and Applications (2018-2022)
8.4.1 Asia Pacific Badminton Apparel Revenue (USD Million) by Country (2018-2022)
8.4.2 Asia Pacific Badminton Apparel Revenue (USD Million) by Type (2018-2022)
8.4.3 Asia Pacific Badminton Apparel Revenue (USD Million) by Applications (2018-2022)
8.5 South America Badminton Apparel Revenue (USD Million), by Type, and Applications (2018-2022)
8.5.1 South America Badminton Apparel Revenue (USD Million), by Country (2018-2022)
8.5.2 South America Badminton Apparel Revenue (USD Million) by Type (2018-2022)
8.5.3 South America Badminton Apparel Revenue (USD Million) by Applications (2018-2022)
8.6 Middle East and Africa Badminton Apparel Revenue (USD Million), by Type, Technology, Application, Thickness (2018-2022)
8.6.1 Middle East and Africa Badminton Apparel Revenue (USD Million) by Country (2018-2022)
8.6.2 Middle East and Africa Badminton Apparel Revenue (USD Million) by Type (2018-2022)
8.6.3 Middle East and Africa Badminton Apparel Revenue (USD Million) by Applications (2018-2022)
9 Company Profiles
10 Global Badminton Apparel Market Revenue (USD Million), by Type, and Applications (2023-2030)
10.1 Global Badminton Apparel Revenue (USD Million) and Market Share (%) by Type (2023-2030)
10.1.1 Global Badminton Apparel Revenue (USD Million), and Market Share (%) by Type (2023-2030)
10.2 Global Badminton Apparel Revenue (USD Million) and Market Share (%) by Applications (2023-2030)
10.2.1 Global Badminton Apparel Revenue (USD Million), and Market Share (%) by Applications (2023-2030)
11 Global Badminton Apparel Development Regional Status and Outlook Forecast
11.1 Global Badminton Apparel Revenue (USD Million) By Regions (2023-2030)
11.2 North America Badminton Apparel Revenue (USD Million) by Type, and Applications (2023-2030)
11.2.1 North America Badminton Apparel Revenue (USD) Million by Country (2023-2030)
11.2.2 North America Badminton Apparel Revenue (USD Million), by Type (2023-2030)
11.2.3 North America Badminton Apparel Revenue (USD Million), Market Share (%) by Applications (2023-2030)
11.3 Europe Badminton Apparel Revenue (USD Million), by Type, and Applications (2023-2030)
11.3.1 Europe Badminton Apparel Revenue (USD Million), by Country (2023-2030)
11.3.2 Europe Badminton Apparel Revenue (USD Million), by Type (2023-2030)
11.3.3 Europe Badminton Apparel Revenue (USD Million), by Applications (2023-2030)
11.4 Asia Pacific Badminton Apparel Revenue (USD Million) by Type, and Applications (2023-2030)
11.4.1 Asia Pacific Badminton Apparel Revenue (USD Million), by Country (2023-2030)
11.4.2 Asia Pacific Badminton Apparel Revenue (USD Million), by Type (2023-2030)
11.4.3 Asia Pacific Badminton Apparel Revenue (USD Million), by Applications (2023-2030)
11.5 South America Badminton Apparel Revenue (USD Million), by Type, and Applications (2023-2030)
11.5.1 South America Badminton Apparel Revenue (USD Million), by Country (2023-2030)
11.5.2 South America Badminton Apparel Revenue (USD Million), by Type (2023-2030)
11.5.3 South America Badminton Apparel Revenue (USD Million), by Applications (2023-2030)
11.6 Middle East and Africa Badminton Apparel Revenue (USD Million), by Type, and Applications (2023-2030)
11.6.1 Middle East and Africa Badminton Apparel Revenue (USD Million), by Region (2023-2030)
11.6.2 Middle East and Africa Badminton Apparel Revenue (USD Million), by Type (2023-2030)
11.6.3 Middle East and Africa Badminton Apparel Revenue (USD Million), by Applications (2023-2030)
12 Methodology and Data Sources
12.1 Methodology/Research Approach
12.1.1 Research Programs/Design
12.1.2 Market Size Estimation
12.1.3 Market Breakdown and Data Triangulation
12.2 Data Sources
12.2.1 Secondary Sources
12.2.2 Primary Sources
12.3 Disclaimer
List Of Tables
Table 1 Market Segmentation Analysis
Table 2 Global Badminton Apparel Market Companies with Areas Served
Table 3 Products Offerings Global Badminton Apparel Market
Table 4 Low Growth Scenario Forecasts
Table 5 Reference Case Growth Scenario
Table 6 High Growth Case Scenario
Table 7 Global Badminton Apparel Revenue (USD Million) And CAGR (%) By Type (2018-2030)
Table 8 Global Badminton Apparel Revenue (USD Million) And CAGR (%) By Applications (2018-2030)
Table 9 Global Badminton Apparel Revenue (USD Million) And CAGR (%) By Regions (2018-2030)
Table 10 Global Badminton Apparel Revenue (USD Million) By Type (2018-2022)
Table 11 Global Badminton Apparel Revenue Market Share (%) By Type (2018-2022)
Table 12 Global Badminton Apparel Revenue (USD Million) By Applications (2018-2022)
Table 13 Global Badminton Apparel Revenue Market Share (%) By Applications (2018-2022)
Table 14 Global Badminton Apparel Market Revenue (USD Million) By Regions (2018-2022)
Table 15 Global Badminton Apparel Market Share (%) By Regions (2018-2022)
Table 16 North America Badminton Apparel Revenue (USD Million) By Country (2018-2022)
Table 17 North America Badminton Apparel Revenue (USD Million) By Type (2018-2022)
Table 18 North America Badminton Apparel Revenue (USD Million) By Applications (2018-2022)
Table 19 Europe Badminton Apparel Revenue (USD Million) By Country (2018-2022)
Table 20 Europe Badminton Apparel Revenue (USD Million) By Type (2018-2022)
Table 21 Europe Badminton Apparel Revenue (USD Million) By Applications (2018-2022)
Table 22 Asia Pacific Badminton Apparel Revenue (USD Million) By Country (2018-2022)
Table 23 Asia Pacific Badminton Apparel Revenue (USD Million) By Type (2018-2022)
Table 24 Asia Pacific Badminton Apparel Revenue (USD Million) By Applications (2018-2022)
Table 25 South America Badminton Apparel Revenue (USD Million) By Country (2018-2022)
Table 26 South America Badminton Apparel Revenue (USD Million) By Type (2018-2022)
Table 27 South America Badminton Apparel Revenue (USD Million) By Applications (2018-2022)
Table 28 Middle East and Africa Badminton Apparel Revenue (USD Million) By Region (2018-2022)
Table 29 Middle East and Africa Badminton Apparel Revenue (USD Million) By Type (2018-2022)
Table 30 Middle East and Africa Badminton Apparel Revenue (USD Million) By Applications (2018-2022)
Table 31 Financial Analysis
Table 32 Global Badminton Apparel Revenue (USD Million) By Type (2023-2030)
Table 33 Global Badminton Apparel Revenue Market Share (%) By Type (2023-2030)
Table 34 Global Badminton Apparel Revenue (USD Million) By Applications (2023-2030)
Table 35 Global Badminton Apparel Revenue Market Share (%) By Applications (2023-2030)
Table 36 Global Badminton Apparel Market Revenue (USD Million), And Revenue (USD Million) By Regions (2023-2030)
Table 37 North America Badminton Apparel Revenue (USD)By Country (2023-2030)
Table 38 North America Badminton Apparel Revenue (USD Million) By Type (2023-2030)
Table 39 North America Badminton Apparel Revenue (USD Million) By Applications (2023-2030)
Table 40 Europe Badminton Apparel Revenue (USD Million) By Country (2023-2030)
Table 41 Europe Badminton Apparel Revenue (USD Million) By Type (2023-2030)
Table 42 Europe Badminton Apparel Revenue (USD Million) By Applications (2023-2030)
Table 43 Asia Pacific Badminton Apparel Revenue (USD Million) By Country (2023-2030)
Table 44 Asia Pacific Badminton Apparel Revenue (USD Million) By Type (2023-2030)
Table 45 Asia Pacific Badminton Apparel Revenue (USD Million) By Applications (2023-2030)
Table 46 South America Badminton Apparel Revenue (USD Million) By Country (2023-2030)
Table 47 South America Badminton Apparel Revenue (USD Million) By Type (2023-2030)
Table 48 South America Badminton Apparel Revenue (USD Million) By Applications (2023-2030)
Table 49 Middle East and Africa Badminton Apparel Revenue (USD Million) By Region (2023-2030)
Table 50 Middle East and Africa Badminton Apparel Revenue (USD Million) By Region (2023-2030)
Table 51 Middle East and Africa Badminton Apparel Revenue (USD Million) By Type (2023-2030)
Table 52 Middle East and Africa Badminton Apparel Revenue (USD Million) By Applications (2023-2030)
Table 53 Research Programs/Design for This Report
Table 54 Key Data Information from Secondary Sources
Table 55 Key Data Information from Primary Sources
List Of Figures
Figure 1 Market Scope
Figure 2 Porter’s Five Forces
Figure 3 Global Badminton Apparel Revenue (USD Million) By Type (2018-2022)
Figure 4 Global Badminton Apparel Revenue Market Share (%) By Type (2022)
Figure 5 Global Badminton Apparel Revenue (USD Million) By Applications (2018-2022)
Figure 6 Global Badminton Apparel Revenue Market Share (%) By Applications (2022)
Figure 7 Global Badminton Apparel Market Revenue (USD Million) By Regions (2018-2022)
Figure 8 Global Badminton Apparel Market Share (%) By Regions (2022)
Figure 9 North America Badminton Apparel Revenue (USD Million) By Country (2018-2022)
Figure 10 North America Badminton Apparel Revenue (USD Million) By Type (2018-2022)
Figure 11 North America Badminton Apparel Revenue (USD Million) By Applications (2018-2022)
Figure 12 Europe Badminton Apparel Revenue (USD Million) By Country (2018-2022)
Figure 13 Europe Badminton Apparel Revenue (USD Million) By Type (2018-2022)
Figure 14 Europe Badminton Apparel Revenue (USD Million) By Applications (2018-2022)
Figure 15 Asia Pacific Badminton Apparel Revenue (USD Million) By Country (2018-2022)
Figure 16 Asia Pacific Badminton Apparel Revenue (USD Million) By Type (2018-2022)
Figure 17 Asia Pacific Badminton Apparel Revenue (USD Million) By Applications (2018-2022)
Figure 18 South America Badminton Apparel Revenue (USD Million) By Country (2018-2022)
Figure 19 South America Badminton Apparel Revenue (USD Million) By Type (2018-2022)
Figure 20 South America Badminton Apparel Revenue (USD Million) By Applications (2018-2022)
Figure 21 Middle East and Africa Badminton Apparel Revenue (USD Million) By Region (2018-2022)
Figure 22 Middle East and Africa Badminton Apparel Revenue (USD Million) By Type (2018-2022)
Figure 23 Middle East and Africa Badminton Apparel Revenue (USD Million) By Applications (2018-2022)
Figure 24 Global Badminton Apparel Revenue (USD Million) By Type (2023-2030)
Figure 25 Global Badminton Apparel Revenue Market Share (%) By Type (2030)
Figure 26 Global Badminton Apparel Revenue (USD Million) By Applications (2023-2030)
Figure 27 Global Badminton Apparel Revenue Market Share (%) By Applications (2030)
Figure 28 Global Badminton Apparel Market Revenue (USD Million) By Regions (2023-2030)
Figure 29 North America Badminton Apparel Revenue (USD Million) By Country (2023-2030)
Figure 30 North America Badminton Apparel Revenue (USD Million) By Type (2023-2030)
Figure 31 North America Badminton Apparel Revenue (USD Million) By Applications (2023-2030)
Figure 32 Europe Badminton Apparel Revenue (USD Million) By Country (2023-2030)
Figure 33 Europe Badminton Apparel Revenue (USD Million) By Type (2023-2030)
Figure 34 Europe Badminton Apparel Revenue (USD Million) By Applications (2023-2030)
Figure 35 Asia Pacific Badminton Apparel Revenue (USD Million) By Country (2023-2030)
Figure 36 Asia Pacific Badminton Apparel Revenue (USD Million) By Type (2023-2030)
Figure 37 Asia Pacific Badminton Apparel Revenue (USD Million) By Applications (2023-2030)
Figure 38 South America Badminton Apparel Revenue (USD Million) By Country (2023-2030)
Figure 39 South America Badminton Apparel Revenue (USD Million) By Type (2023-2030)
Figure 40 South America Badminton Apparel Revenue (USD Million) By Applications (2023-2030)
Figure 41 Middle East and Africa Badminton Apparel Revenue (USD Million) By Region (2023-2030)
Figure 42 Middle East and Africa Badminton Apparel Revenue (USD Million) By Region (2023-2030)
Figure 43 Middle East and Africa Badminton Apparel Revenue (USD Million) By Type (2023-2030)
Figure 44 Middle East and Africa Badminton Apparel Revenue (USD Million) By Applications (2023-2030)
Figure 45 Bottom-Up and Top-Down Approaches For This Report
Figure 46 Data Triangulation
