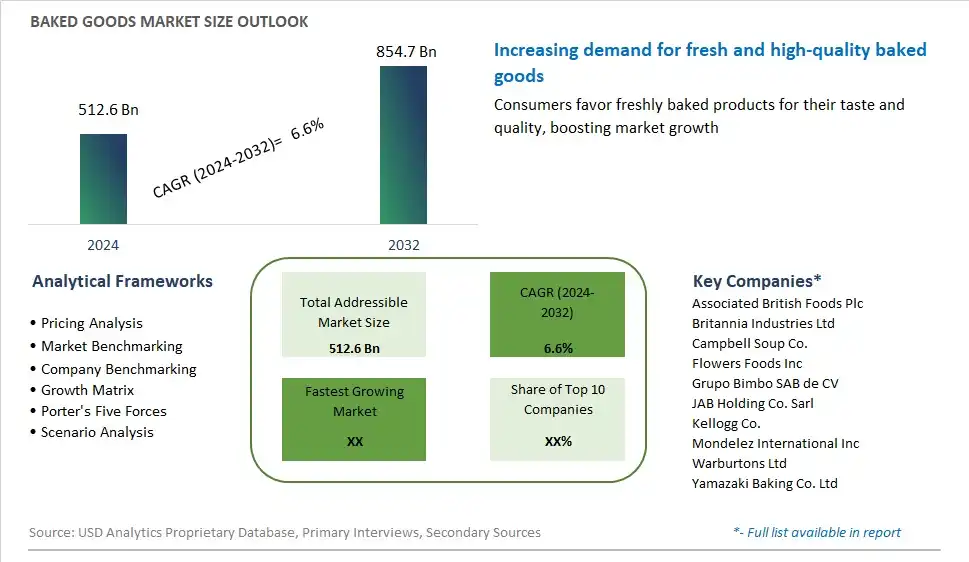
Global Baked Goods Market Size is valued at $512.6 Billion in 2024 and is forecast to register a growth rate (CAGR) of 6.6% to reach $854.7 Billion by 2032.
The global Baked Goods Market Comprehensive Study analyzes and forecasts the market size across 6 regions and 24 countries for diverse segments -By Product (Bread and Rolls, Cakes and Pastries, Cookies, Others)
An Introduction to Baked Goods Market
In 2024, the baked goods market continues to thrive, fueled by consumer demand for indulgent treats, convenience, and artisanal quality. From bread and pastries to cookies and cakes, baked goods play a central role in people's diets, offering comfort, satisfaction, and versatility in a wide range of occasions. Consumers are increasingly seeking baked goods made from high-quality ingredients, free from artificial preservatives, flavors, and additives, reflecting a growing preference for clean-label products that prioritize taste and health. Artisanal bakeries and specialty shops are gaining popularity for their handcrafted creations, unique flavors, and commitment to traditional baking techniques. Moreover, the rise of online bakeries and delivery services has made it easier than ever for consumers to access a diverse array of baked goods, including gluten-free, vegan, and allergy-friendly options to cater to dietary preferences and restrictions. With an increasing focus on premiumization and innovation, the baked goods market is poised for continued growth and diversification, offering consumers a delectable array of options to satisfy their cravings and culinary preferences.
Baked Goods Competitive Landscape
The market report analyses the leading companies in the industry including Associated British Foods Plc, Britannia Industries Ltd, Campbell Soup Co., Flowers Foods Inc, Grupo Bimbo SAB de CV, JAB Holding Co. Sarl, Kellogg Co., Mondelez International Inc, Warburtons Ltd, Yamazaki Baking Co. Ltd, and Others.
Baked Goods Market Dynamics
Baked Goods Market Trend: Health and Wellness Conscious Consumer Preferences
A prominent trend in the baked goods market is the increasing demand for healthier options driven by health and wellness-conscious consumer preferences. Consumers are seeking baked goods that offer nutritional benefits, such as whole grains, fiber, and reduced sugar and fat content. This trend is fueled by a growing awareness of the link between diet and health outcomes, leading consumers to make more mindful choices when it comes to their food consumption. As a result, there is a rising demand for baked goods that align with health-conscious lifestyles, including products labeled as "low-fat," "low-sugar," "gluten-free," and "organic," catering to the preferences of individuals seeking healthier alternatives without compromising on taste or quality.
Market Driver: Convenience and On-the-go Snacking
A key driver shaping the baked goods market is the demand for convenient and on-the-go snacking options. With busy lifestyles and increasingly hectic schedules, consumers are seeking convenient and portable snack solutions that offer quick and satisfying energy boosts throughout the day. Baked goods such as granola bars, muffins, and cookies are popular choices for on-the-go snacking, offering convenience, portability, and portion control. This driver is further amplified by the rise of snacking occasions outside of traditional meal times and the growing popularity of snacking as a way to fuel busy lifestyles. Manufacturers can capitalize on this driver by offering a diverse range of baked goods designed for convenient snacking, including single-serve packaging, resealable pouches, and snack-sized portions tailored to meet the needs of on-the-go consumers.
Market Opportunity: Expansion into Health-focused Baked Goods
An opportunity for growth in the baked goods market lies in the expansion into health-focused product offerings. With increasing consumer demand for healthier options, there is a growing opportunity for manufacturers to innovate and develop baked goods that prioritize health and wellness attributes. This includes incorporating functional ingredients such as ancient grains, nuts, seeds, and superfoods known for their nutritional benefits. Additionally, there is potential for developing baked goods targeted towards specific dietary preferences and requirements, such as gluten-free, vegan, keto, and paleo-friendly options. By tapping into this opportunity and offering a diverse range of health-focused baked goods, manufacturers can attract health-conscious consumers, differentiate themselves in the market, and capitalize on the growing demand for nutritious and wholesome snack options.
Baked Goods Market Share Analysis: Bread and Rolls held the dominant market share in 2024
In the diverse landscape of the baked goods market, bread and rolls emerge as the largest segment, primarily due to their ubiquity and versatility. Bread, a dietary staple in many cultures, is a fundamental component of daily meals and snacks, enjoyed by consumers across all age groups. Its widespread popularity is further bolstered by its role as a convenient and satisfying option for breakfast, lunch, and dinner. Further, the versatility of bread and rolls allows for a multitude of variations, from hearty whole grain loaves to soft dinner rolls, catering to diverse tastes and preferences. Additionally, the long shelf life and ease of storage make bread and rolls a practical choice for households, contributing to their consistent demand and dominance in the baked goods market. With their essential role in culinary traditions and everyday meals, bread and rolls solidify their position as the largest segment in the market.
Baked Goods Market Segmentation
By Product
Bread and Rolls
Cakes and Pastries
Cookies
Others
Countries Analyzed
North America (US, Canada, Mexico)
Europe (Germany, UK, France, Spain, Italy, Russia, Rest of Europe)
Asia Pacific (China, India, Japan, South Korea, Australia, South East Asia, Rest of Asia)
South America (Brazil, Argentina, Rest of South America)
Middle East and Africa (Saudi Arabia, UAE, Rest of Middle East, South Africa, Egypt, Rest of Africa)
Baked Goods Companies Profiled in the Study
Associated British Foods Plc
Britannia Industries Ltd
Campbell Soup Co.
Flowers Foods Inc
Grupo Bimbo SAB de CV
JAB Holding Co. Sarl
Kellogg Co.
Mondelez International Inc
Warburtons Ltd
Yamazaki Baking Co. Ltd
*- List Not Exhaustive
Chapter 1. TABLE OF CONTENTS
Chapter 2. Introduction to Baked Goods Market
2.1. Market Overview
2.2. Key Statistics and Report Highlights
2.3. Scope of the Comprehensive Study
2.3.1. Market Definition
2.3.2 Countries and Regions Covered
2.3.3 Research Objective
2.3.4 Units, Currency, and Conversions
2.3.5 Industry Value Chain
2.4. Key Market Segments
2.5. Key Companies
2.6. Study Period
Chapter 3. Strategic Analysis Review
3.1. Baked Goods Pricing Analysis and Forecast
3.2. Porter’s Five Forces
3.3. Market Ecosystem
3.4. SWOT Analysis
3.5. Regulatory Scenario
3.3. Effects of Inflation, Russia-Ukraine War, moderating economic growth, and other macroeconomic factors
Chapter 4. Competitive Landscape
4.1. Market Share Analysis
4.1.1. Global Baked Goods Market Share by Company, 2023
4.1.2. Product Offerings of Leading Baked Goods Companies
4.2. Market Entropy
4.2.1. New Product Launches in the Industry
4.2.2. Mergers, Acquisitions, Joint ventures, and Partnerships
4.3. Key Strategies and Best Practices
Chapter 5. Global Market Projections: Best, Reference, and Low Case Scenarios
5.1. Growth Analysis- Case Scenario Definitions
5.2. Low Growth Case Scenario Forecasts
5.3. Reference Growth Case Scenario Forecasts
5.4. High Growth Case Scenario Forecasts
Chapter 6. Market Dynamics
6.1. Baked Goods Market Drivers
6.2. Baked Goods Market Challenges
6.6. Baked Goods Market Opportunities
6.4. Baked Goods Market Trends
Chapter 7. Global Baked Goods Market Outlook Trends
7.1. Global Baked Goods Revenue (USD Million) and CAGR (%) by Type (2021-2032)
7.2. Global Baked Goods Revenue (USD Million) and CAGR (%) by Application (2021-2032)
7.3. Global Baked Goods Revenue (USD Million) and CAGR (%) by Product (2021-2032)
By Product
Bread and Rolls
Cakes and Pastries
Cookies
Others
Chapter 8. Global Baked Goods Regional Analysis and Outlook
8.1. Global Baked Goods Revenue (USD Million) By Regions (2021- 2032)
8.2. North America Baked Goods Revenue (USD Million) by Country (2021-2032)
8.2.1. United States Baked Goods Regional Analysis and Outlook
8.2.2. Canada Baked Goods Regional Analysis and Outlook
8.2.3. Mexico Baked Goods Regional Analysis and Outlook
8.3. Europe Baked Goods Revenue (USD Million), by Country (2021-2032)
8.3.1. Germany Baked Goods Regional Analysis and Outlook
8.3.2. France Baked Goods Regional Analysis and Outlook
8.3.3. United Kingdom Baked Goods Regional Analysis and Outlook
8.3.4. Spain Baked Goods Regional Analysis and Outlook
8.3.5. Italy Baked Goods Regional Analysis and Outlook
8.3.6. Russia Baked Goods Regional Analysis and Outlook
8.3.7. Rest of Europe Baked Goods Regional Analysis and Outlook
8.4. Asia Pacific Baked Goods Revenue (USD Million) by Country (2021-2032)
8.4.1. China Baked Goods Regional Analysis and Outlook
8.4.2. Japan Baked Goods Regional Analysis and Outlook
8.4.3. India Baked Goods Regional Analysis and Outlook
8.4.4. South Korea Baked Goods Regional Analysis and Outlook
8.4.5. Australia Baked Goods Regional Analysis and Outlook
8.4.6. South East Asia Baked Goods Regional Analysis and Outlook
8.4.7. Rest of Asia Pacific Baked Goods Regional Analysis and Outlook
8.5. South America Baked Goods Revenue (USD Million), by Country (2021-2032)
8.5.1. Brazil Baked Goods Regional Analysis and Outlook
8.5.2. Argentina Baked Goods Regional Analysis and Outlook
8.5.3. Rest of South America Baked Goods Regional Analysis and Outlook
8.6. Middle East and Africa Baked Goods Revenue (USD Million) by Country (2021-2032)
8.6.1. Middle East Baked Goods Regional Analysis and Outlook
8.6.2. Africa Baked Goods Regional Analysis and Outlook
Chapter 9. North America Baked Goods Analysis and Outlook
9.1. North America Baked Goods Revenue (USD Million) by Segments (2021-2032)
9.1.1. North America Baked Goods Revenue (USD Million) by Type (2021-2032)
9.1.2. North America Baked Goods Revenue (USD Million) by Application (2021-2032)
9.1.3. North America Baked Goods Revenue (USD Million) by Product (2021-2032)
By Product
Bread and Rolls
Cakes and Pastries
Cookies
Others
Chapter 10. Europe Baked Goods Analysis and Outlook
10.1. Europe Baked Goods Revenue (USD Million), by Segments (USD Million) (2021-2032)
10.1.1. Europe Baked Goods Revenue (USD Million) by Type (2021-2032)
10.1.2. Europe Baked Goods Revenue (USD Million) by Application (2021-2032)
10.1.3. Europe Baked Goods Revenue (USD Million) by Product (2021-2032)
By Product
Bread and Rolls
Cakes and Pastries
Cookies
Others
Chapter 11. Asia Pacific Baked Goods Analysis and Outlook
11.1. Asia Pacific Baked Goods Revenue (USD Million), and Revenue (USD Million) by Segments (2021-2032)
11.1.1. Asia Pacific Baked Goods Revenue (USD Million) by Type (2021-2032)
11.1.2. Asia Pacific Baked Goods Revenue (USD Million) by Application (2021-2032)
11.1.3. Asia Pacific Baked Goods Revenue (USD Million) by Product (2021-2032)
By Product
Bread and Rolls
Cakes and Pastries
Cookies
Others
Chapter 12. South America Baked Goods Analysis and Outlook
12.1. South America Baked Goods Revenue (USD Million), by Segments (2021-2032)
12.1.1. South America Baked Goods Revenue (USD Million) by Type (2021-2032)
12.1.2. South America Baked Goods Revenue (USD Million) by Application (2021-2032)
12.1.3. South America Baked Goods Revenue (USD Million) by Product (2021-2032)
By Product
Bread and Rolls
Cakes and Pastries
Cookies
Others
Chapter 13. Middle East and Africa Baked Goods Analysis and Outlook
13.1. Middle East and Africa Baked Goods Revenue (USD Million), by Segments (2021-2032)
13.1.1. Middle East and Africa Baked Goods Revenue (USD Million) by Type (2021-2032)
13.1.2. Middle East and Africa Baked Goods Revenue (USD Million) by Application (2021-2032)
13.1.3. Middle East and Africa Baked Goods Revenue (USD Million) by Product (2021-2032)
By Product
Bread and Rolls
Cakes and Pastries
Cookies
Others
Chapter 14. Baked Goods Company Profiles
14.1 Business Overview
14.2 Product Profiles
14.3 SWOT Profiles
14.5 Recent Developments
14.6 Financial Profile
List of Companies
Associated British Foods Plc
Britannia Industries Ltd
Campbell Soup Co.
Flowers Foods Inc
Grupo Bimbo SAB de CV
JAB Holding Co. Sarl
Kellogg Co.
Mondelez International Inc
Warburtons Ltd
Yamazaki Baking Co. Ltd
15. Methodology and Data Sources
15.1 Customization Offerings
15.2 Subscription Services
15.3 Related Reports
15.4 Publisher Expertise
LIST OF TABLES
Table 1 Market Segmentation Analysis
Table 2 Global Baked Goods Market Share of Leading Companies, 2023
Table 3 Product Offerings of Leading Companies
Table 4 Low Growth Scenario Forecasts
Table 5 Reference Case Growth Scenario
Table 6 High Growth Case Scenario
Table 7 Global Baked Goods Revenue (USD Million) And CAGR (%) By Type (2021-2032)
Table 8 Global Baked Goods Revenue (USD Million) And CAGR (%) By Application (2021-2032)
Table 9 Global Baked Goods Revenue (USD Million) And CAGR (%) By Product (2021-2032)
Table 10 Global Baked Goods Market Revenue (USD Million) By Regions (2021-2032)
Table 11 Global Baked Goods Market Share (%) By Regions (2021-2032)
Table 12 North America Baked Goods Revenue (USD Million) By Country (2021-2032)
Table 13 Europe Baked Goods Revenue (USD Million) By Country (2021-2032)
Table 14 Asia Pacific Baked Goods Revenue (USD Million) By Country (2021-2032)
Table 15 South America Baked Goods Revenue (USD Million) By Country (2021-2032)
Table 16 Middle East and Africa Baked Goods Revenue (USD Million) By Region (2021-2032)
Table 17 North America Baked Goods Revenue (USD Million) By Type (2021-2032)
Table 18 North America Baked Goods Revenue (USD Million) By Application (2021-2032)
Table 19 North America Baked Goods Revenue (USD Million) By Product (2021-2032)
Table 20 Europe Baked Goods Revenue (USD Million) By Type (2021-2032)
Table 21 Europe Baked Goods Revenue (USD Million) By Application (2021-2032)
Table 22 Europe Baked Goods Revenue (USD Million) By Product (2021-2032)
Table 23 Asia Pacific Baked Goods Revenue (USD Million) By Type (2021-2032)
Table 24 Asia Pacific Baked Goods Revenue (USD Million) By Application (2021-2032)
Table 25 Asia Pacific Baked Goods Revenue (USD Million) By Product (2021-2032)
Table 26 South America Baked Goods Revenue (USD Million) By Type (2021-2032)
Table 27 South America Baked Goods Revenue (USD Million) By Application (2021-2032)
Table 28 South America Baked Goods Revenue (USD Million) By Product (2021-2032)
Table 29 Middle East and Africa Baked Goods Revenue (USD Million) By Type (2021-2032)
Table 30 Middle East and Africa Baked Goods Revenue (USD Million) By Application (2021-2032)
Table 31 Middle East and Africa Baked Goods Revenue (USD Million) By Product (2021-2032)
LIST OF FIGURES
Figure 1. Market Scope
Figure 2. Pricing Forecasts Per Unit, 2023- 2032
Figure 3. Porter’s Five Forces
Figure 4. Global Baked Goods Market Revenue (USD Million) By Regions (2021-2032)
Figure 5. Global Baked Goods Market Share (%) By Regions (2023)
Figure 6. North America Baked Goods Revenue (USD Million) By Country (2021-2032)
Figure 7. United States Baked Goods Revenue (USD Million) By Country (2021-2032)
Figure 8. Canada Baked Goods Revenue (USD Million) By Country (2021-2032)
Figure 9. Mexico Baked Goods Revenue (USD Million) By Country (2021-2032)
Figure 10. Europe Baked Goods Revenue (USD Million) By Country (2021-2032)
Figure 11. Germany Baked Goods Revenue (USD Million) By Country (2021-2032)
Figure 12. France Baked Goods Revenue (USD Million) By Country (2021-2032)
Figure 13. United Kingdom Baked Goods Revenue (USD Million) By Country (2021-2032)
Figure 14. Spain Baked Goods Revenue (USD Million) By Country (2021-2032)
Figure 15. Italy Baked Goods Revenue (USD Million) By Country (2021-2032)
Figure 16. Russia Baked Goods Revenue (USD Million) By Country (2021-2032)
Figure 17. Rest of Europe Baked Goods Revenue (USD Million) By Country (2021-2032)
Figure 11. Asia Pacific Baked Goods Revenue (USD Million) By Country (2021-2032)
Figure 12. China Baked Goods Revenue (USD Million) By Country (2021-2032)
Figure 13. Japan Baked Goods Revenue (USD Million) By Country (2021-2032)
Figure 14. India Baked Goods Revenue (USD Million) By Country (2021-2032)
Figure 15. South Korea Baked Goods Revenue (USD Million) By Country (2021-2032)
Figure 16. Australia Baked Goods Revenue (USD Million) By Country (2021-2032)
Figure 17. South East Asia Baked Goods Revenue (USD Million) By Country (2021-2032)
Figure 18. South America Baked Goods Revenue (USD Million) By Country (2021-2032)
Figure 19. Brazil Baked Goods Revenue (USD Million) By Country (2021-2032)
Figure 20. Argentina Baked Goods Revenue (USD Million) By Country (2021-2032)
Figure 21. Rest of Asia Pacific Baked Goods Revenue (USD Million) By Country (2021-2032)
Figure 22. Middle East and Africa Baked Goods Revenue (USD Million) By Region (2021-2032)
Figure 23. Saudi Arabia Baked Goods Revenue (USD Million) By Region (2021-2032)
Figure 24. The UAE Baked Goods Revenue (USD Million) By Region (2021-2032)
Figure 25. Rest of Middle East Baked Goods Revenue (USD Million) By Region (2021-2032)
Figure 26. South Africa Baked Goods Revenue (USD Million) By Region (2021-2032)
Figure 27. Africa Baked Goods Revenue (USD Million) By Region (2021-2032)
Figure 28. North America Baked Goods Revenue (USD Million) By Type (2021-2032)
Figure 29. North America Baked Goods Revenue (USD Million) By Application (2021-2032)
Figure 30. North America Baked Goods Revenue (USD Million) By Product (2021-2032)
Figure 31. Europe Baked Goods Revenue (USD Million) By Type (2021-2032)
Figure 32. Europe Baked Goods Revenue (USD Million) By Application (2021-2032)
Figure 33. Europe Baked Goods Revenue (USD Million) By Product (2021-2032)
Figure 34. Asia Pacific Baked Goods Revenue (USD Million) By Type (2021-2032)
Figure 35. Asia Pacific Baked Goods Revenue (USD Million) By Application (2021-2032)
Figure 36. Asia Pacific Baked Goods Revenue (USD Million) By Product (2021-2032)
Figure 37. South America Baked Goods Revenue (USD Million) By Type (2021-2032)
Figure 38. South America Baked Goods Revenue (USD Million) By Application (2021-2032)
Figure 39. South America Baked Goods Revenue (USD Million) By Product (2021-2032)
Figure 40. Middle East and Africa Baked Goods Revenue (USD Million) By Type (2021-2032)
Figure 41. Middle East and Africa Baked Goods Revenue (USD Million) By Application (2021-2032)
Figure 42. Middle East and Africa Baked Goods Revenue (USD Million) By Product (2021-2032)
By Product
Bread and Rolls
Cakes and Pastries
Cookies
Others
Countries Analyzed
North America (US, Canada, Mexico)
Europe (Germany, UK, France, Spain, Italy, Russia, Rest of Europe)
Asia Pacific (China, India, Japan, South Korea, Australia, South East Asia, Rest of Asia)
South America (Brazil, Argentina, Rest of South America)
Middle East and Africa (Saudi Arabia, UAE, Rest of Middle East, South Africa, Egypt, Rest of Africa)
