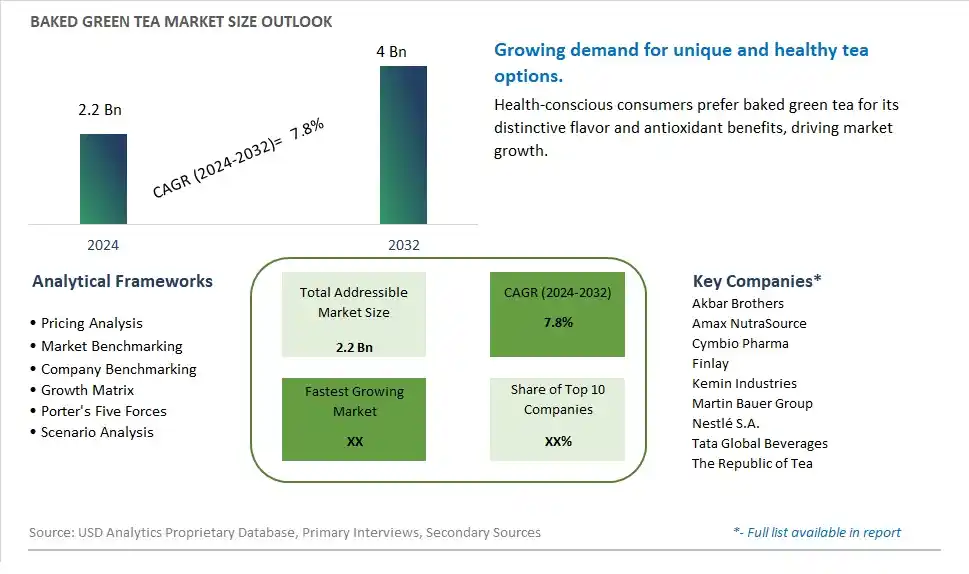
Global Baked Green Tea Market Size is valued at $2.2 Billion in 2024 and is forecast to register a growth rate (CAGR) of 7.8% to reach $4 Billion by 2032.
The global Baked Green Tea Market Comprehensive Study analyzes and forecasts the market size across 6 regions and 24 countries for diverse segments -By Type (Ordinary Baking, Tender and Green, Others), By Application (Beverages, Cosmetics, Functional Foods, Beauty Supplements)
An Introduction to Baked Green Tea Market
In 2024, the Baked Green Tea market is witnessing significant growth, driven by the increasing awareness of the health benefits associated with green tea and the rising popularity of unique and premium tea products. Baked green tea, known for its distinctive roasted flavor and high antioxidant content, is gaining traction among health-conscious consumers and tea enthusiasts. The market is supported by innovations in tea processing and packaging that preserve the quality and enhance the flavor of baked green tea. Additionally, the trend towards natural and functional beverages is driving market expansion, as consumers seek out teas that offer both health benefits and a unique sensory experience.
Baked Green Tea Competitive Landscape
The market report analyses the leading companies in the industry including Akbar Brothers, Amax NutraSource, Cymbio Pharma, Finlay, Kemin Industries, Martin Bauer Group, Nestlé S.A., Tata Global Beverages, The Republic of Tea, and Others.
Baked Green Tea Market Dynamics
Baked Green Tea Market Trend: Surge in Demand for Functional and Health-Focused Beverages
The most prominent market trend for Baked Green Tea is the surge in demand for functional and health-focused beverages. Consumers are increasingly seeking beverages that offer additional health benefits beyond hydration, such as antioxidant properties, metabolism support, and stress reduction. Baked green tea, also known as matcha, has gained popularity due to its rich antioxidant content, potential health benefits, and unique flavor profile. This trend reflects a broader shift towards functional and wellness-oriented products, driven by consumer interest in holistic health and preventive nutrition.
Baked Green Tea Market Driver: Consumer Awareness and Interest in Traditional and Exotic Beverages
A key market driver for Baked Green Tea is the growing consumer awareness and interest in traditional and exotic beverages. As consumers seek new taste experiences and cultural exploration through food and beverages, baked green tea stands out as a unique and intriguing option. Its association with Japanese tea ceremonies, health benefits, and vibrant green color make it appealing to consumers looking for premium and authentic beverage choices. The driver of consumer curiosity and exploration of diverse flavors and beverages fuels the demand and consumption of baked green tea products.
Baked Green Tea Market Opportunity: Innovation in Flavor Varieties and Functional Formulations
A potential opportunity within the Baked Green Tea market lies in innovation in flavor varieties and functional formulations. Collaborating with tea experts, flavor scientists, and nutritionists can lead to the development of new and exciting baked green tea flavors, such as matcha latte, matcha-infused snacks, and matcha-based desserts. Additionally, exploring functional formulations with added ingredients like vitamins, adaptogens, and natural sweeteners can enhance the health benefits and appeal of baked green tea products. Introducing convenient and ready-to-drink options, as well as eco-friendly packaging solutions, can further capitalize on consumer demand for convenient and sustainable beverage choices. By leveraging innovation and consumer trends, there are opportunities to expand the market reach, attract new consumers, and drive growth in the competitive baked green tea segment.
Baked Green Tea Market Share Analysis: Ordinary Baking segment generated the highest revenue share in the industry
The largest segment in the Baked Green Tea Market is "Ordinary Baking." This segment encompasses traditional methods of baking green tea-infused products, including bread, pastries, and cakes, infused with green tea powder or extract. Ordinary baking techniques are well-established and widely adopted in the food industry, catering to a broad consumer base familiar with green tea flavors and seeking healthier alternatives in baked goods. Green tea's antioxidant properties and perceived health benefits drive the popularity of products in this segment, attracting health-conscious consumers looking for functional foods. Additionally, the versatility of green tea as an ingredient allows for various flavor profiles and product innovations within the Ordinary Baking segment, contributing to its dominance in the market. As consumer awareness regarding the health benefits of green tea continues to grow, the Ordinary Baking segment is expected to maintain its leading position and witness steady growth in the coming years.
Baked Green Tea Market Share Analysis: Functional Foods is the fastest growing segment over the forecast period to 2032
The fastest-growing segment in the Baked Green Tea Market is "Functional Foods." This segment includes a range of green tea-infused products specifically designed to offer health benefits beyond basic nutrition. Functional foods such as green tea-infused snacks, bars, and supplements are gaining popularity due to the increasing consumer interest in holistic wellness and preventive healthcare. Green tea is rich in antioxidants and bioactive compounds known for their potential to promote health and well-being, including improved metabolism, enhanced immunity, and anti-inflammatory properties. As a result, functional foods infused with green tea are becoming sought-after by health-conscious consumers seeking convenient and effective ways to incorporate beneficial ingredients into their diets. The versatility of green tea allows for innovative product formulations in the Functional Foods segment, driving its rapid growth and market expansion. With a growing emphasis on preventive health and wellness trends, the Functional Foods segment is poised to experience significant growth and demand until 2032.
Baked Green Tea Market Segmentation
By Type
Ordinary Baking
Tender and Green
Others
By Application
Beverages
Cosmetics
Functional Foods
Beauty Supplements
Countries Analyzed
North America (US, Canada, Mexico)
Europe (Germany, UK, France, Spain, Italy, Russia, Rest of Europe)
Asia Pacific (China, India, Japan, South Korea, Australia, South East Asia, Rest of Asia)
South America (Brazil, Argentina, Rest of South America)
Middle East and Africa (Saudi Arabia, UAE, Rest of Middle East, South Africa, Egypt, Rest of Africa)
Baked Green Tea Companies Profiled in the Study
Akbar Brothers
Amax NutraSource
Cymbio Pharma
Finlay
Kemin Industries
Martin Bauer Group
Nestlé S.A.
Tata Global Beverages
The Republic of Tea
*- List Not Exhaustive
Chapter 1. TABLE OF CONTENTS
Chapter 2. Introduction to Baked Green Tea Market
2.1. Market Overview
2.2. Key Statistics and Report Highlights
2.3. Scope of the Comprehensive Study
2.3.1. Market Definition
2.3.2 Countries and Regions Covered
2.3.3 Research Objective
2.3.4 Units, Currency, and Conversions
2.3.5 Industry Value Chain
2.4. Key Market Segments
2.5. Key Companies
2.6. Study Period
Chapter 3. Strategic Analysis Review
3.1. Baked Green Tea Pricing Analysis and Forecast
3.2. Porter’s Five Forces
3.3. Market Ecosystem
3.4. SWOT Analysis
3.5. Regulatory Scenario
3.3. Effects of Inflation, Russia-Ukraine War, moderating economic growth, and other macroeconomic factors
Chapter 4. Competitive Landscape
4.1. Market Share Analysis
4.1.1. Global Baked Green Tea Market Share by Company, 2023
4.1.2. Product Offerings of Leading Baked Green Tea Companies
4.2. Market Entropy
4.2.1. New Product Launches in the Industry
4.2.2. Mergers, Acquisitions, Joint ventures, and Partnerships
4.3. Key Strategies and Best Practices
Chapter 5. Global Market Projections: Best, Reference, and Low Case Scenarios
5.1. Growth Analysis- Case Scenario Definitions
5.2. Low Growth Case Scenario Forecasts
5.3. Reference Growth Case Scenario Forecasts
5.4. High Growth Case Scenario Forecasts
Chapter 6. Market Dynamics
6.1. Baked Green Tea Market Drivers
6.2. Baked Green Tea Market Challenges
6.6. Baked Green Tea Market Opportunities
6.4. Baked Green Tea Market Trends
Chapter 7. Global Baked Green Tea Market Outlook Trends
7.1. Global Baked Green Tea Revenue (USD Million) and CAGR (%) by Type (2021-2032)
7.2. Global Baked Green Tea Revenue (USD Million) and CAGR (%) by Application (2021-2032)
7.3. Global Baked Green Tea Revenue (USD Million) and CAGR (%) by Product (2021-2032)
By Type
Ordinary Baking
Tender and Green
Others
By Application
Beverages
Cosmetics
Functional Foods
Beauty Supplements
Chapter 8. Global Baked Green Tea Regional Analysis and Outlook
8.1. Global Baked Green Tea Revenue (USD Million) By Regions (2021- 2032)
8.2. North America Baked Green Tea Revenue (USD Million) by Country (2021-2032)
8.2.1. United States Baked Green Tea Regional Analysis and Outlook
8.2.2. Canada Baked Green Tea Regional Analysis and Outlook
8.2.3. Mexico Baked Green Tea Regional Analysis and Outlook
8.3. Europe Baked Green Tea Revenue (USD Million), by Country (2021-2032)
8.3.1. Germany Baked Green Tea Regional Analysis and Outlook
8.3.2. France Baked Green Tea Regional Analysis and Outlook
8.3.3. United Kingdom Baked Green Tea Regional Analysis and Outlook
8.3.4. Spain Baked Green Tea Regional Analysis and Outlook
8.3.5. Italy Baked Green Tea Regional Analysis and Outlook
8.3.6. Russia Baked Green Tea Regional Analysis and Outlook
8.3.7. Rest of Europe Baked Green Tea Regional Analysis and Outlook
8.4. Asia Pacific Baked Green Tea Revenue (USD Million) by Country (2021-2032)
8.4.1. China Baked Green Tea Regional Analysis and Outlook
8.4.2. Japan Baked Green Tea Regional Analysis and Outlook
8.4.3. India Baked Green Tea Regional Analysis and Outlook
8.4.4. South Korea Baked Green Tea Regional Analysis and Outlook
8.4.5. Australia Baked Green Tea Regional Analysis and Outlook
8.4.6. South East Asia Baked Green Tea Regional Analysis and Outlook
8.4.7. Rest of Asia Pacific Baked Green Tea Regional Analysis and Outlook
8.5. South America Baked Green Tea Revenue (USD Million), by Country (2021-2032)
8.5.1. Brazil Baked Green Tea Regional Analysis and Outlook
8.5.2. Argentina Baked Green Tea Regional Analysis and Outlook
8.5.3. Rest of South America Baked Green Tea Regional Analysis and Outlook
8.6. Middle East and Africa Baked Green Tea Revenue (USD Million) by Country (2021-2032)
8.6.1. Middle East Baked Green Tea Regional Analysis and Outlook
8.6.2. Africa Baked Green Tea Regional Analysis and Outlook
Chapter 9. North America Baked Green Tea Analysis and Outlook
9.1. North America Baked Green Tea Revenue (USD Million) by Segments (2021-2032)
9.1.1. North America Baked Green Tea Revenue (USD Million) by Type (2021-2032)
9.1.2. North America Baked Green Tea Revenue (USD Million) by Application (2021-2032)
9.1.3. North America Baked Green Tea Revenue (USD Million) by Product (2021-2032)
By Type
Ordinary Baking
Tender and Green
Others
By Application
Beverages
Cosmetics
Functional Foods
Beauty Supplements
Chapter 10. Europe Baked Green Tea Analysis and Outlook
10.1. Europe Baked Green Tea Revenue (USD Million), by Segments (USD Million) (2021-2032)
10.1.1. Europe Baked Green Tea Revenue (USD Million) by Type (2021-2032)
10.1.2. Europe Baked Green Tea Revenue (USD Million) by Application (2021-2032)
10.1.3. Europe Baked Green Tea Revenue (USD Million) by Product (2021-2032)
By Type
Ordinary Baking
Tender and Green
Others
By Application
Beverages
Cosmetics
Functional Foods
Beauty Supplements
Chapter 11. Asia Pacific Baked Green Tea Analysis and Outlook
11.1. Asia Pacific Baked Green Tea Revenue (USD Million), and Revenue (USD Million) by Segments (2021-2032)
11.1.1. Asia Pacific Baked Green Tea Revenue (USD Million) by Type (2021-2032)
11.1.2. Asia Pacific Baked Green Tea Revenue (USD Million) by Application (2021-2032)
11.1.3. Asia Pacific Baked Green Tea Revenue (USD Million) by Product (2021-2032)
By Type
Ordinary Baking
Tender and Green
Others
By Application
Beverages
Cosmetics
Functional Foods
Beauty Supplements
Chapter 12. South America Baked Green Tea Analysis and Outlook
12.1. South America Baked Green Tea Revenue (USD Million), by Segments (2021-2032)
12.1.1. South America Baked Green Tea Revenue (USD Million) by Type (2021-2032)
12.1.2. South America Baked Green Tea Revenue (USD Million) by Application (2021-2032)
12.1.3. South America Baked Green Tea Revenue (USD Million) by Product (2021-2032)
By Type
Ordinary Baking
Tender and Green
Others
By Application
Beverages
Cosmetics
Functional Foods
Beauty Supplements
Chapter 13. Middle East and Africa Baked Green Tea Analysis and Outlook
13.1. Middle East and Africa Baked Green Tea Revenue (USD Million), by Segments (2021-2032)
13.1.1. Middle East and Africa Baked Green Tea Revenue (USD Million) by Type (2021-2032)
13.1.2. Middle East and Africa Baked Green Tea Revenue (USD Million) by Application (2021-2032)
13.1.3. Middle East and Africa Baked Green Tea Revenue (USD Million) by Product (2021-2032)
By Type
Ordinary Baking
Tender and Green
Others
By Application
Beverages
Cosmetics
Functional Foods
Beauty Supplements
Chapter 14. Baked Green Tea Company Profiles
14.1 Business Overview
14.2 Product Profiles
14.3 SWOT Profiles
14.5 Recent Developments
14.6 Financial Profile
List of Companies
Akbar Brothers
Amax NutraSource
Cymbio Pharma
Finlay
Kemin Industries
Martin Bauer Group
Nestlé S.A.
Tata Global Beverages
The Republic of Tea
15. Methodology and Data Sources
15.1 Customization Offerings
15.2 Subscription Services
15.3 Related Reports
15.4 Publisher Expertise
LIST OF TABLES
Table 1 Market Segmentation Analysis
Table 2 Global Baked Green Tea Market Share of Leading Companies, 2023
Table 3 Product Offerings of Leading Companies
Table 4 Low Growth Scenario Forecasts
Table 5 Reference Case Growth Scenario
Table 6 High Growth Case Scenario
Table 7 Global Baked Green Tea Revenue (USD Million) And CAGR (%) By Type (2021-2032)
Table 8 Global Baked Green Tea Revenue (USD Million) And CAGR (%) By Application (2021-2032)
Table 9 Global Baked Green Tea Revenue (USD Million) And CAGR (%) By Product (2021-2032)
Table 10 Global Baked Green Tea Market Revenue (USD Million) By Regions (2021-2032)
Table 11 Global Baked Green Tea Market Share (%) By Regions (2021-2032)
Table 12 North America Baked Green Tea Revenue (USD Million) By Country (2021-2032)
Table 13 Europe Baked Green Tea Revenue (USD Million) By Country (2021-2032)
Table 14 Asia Pacific Baked Green Tea Revenue (USD Million) By Country (2021-2032)
Table 15 South America Baked Green Tea Revenue (USD Million) By Country (2021-2032)
Table 16 Middle East and Africa Baked Green Tea Revenue (USD Million) By Region (2021-2032)
Table 17 North America Baked Green Tea Revenue (USD Million) By Type (2021-2032)
Table 18 North America Baked Green Tea Revenue (USD Million) By Application (2021-2032)
Table 19 North America Baked Green Tea Revenue (USD Million) By Product (2021-2032)
Table 20 Europe Baked Green Tea Revenue (USD Million) By Type (2021-2032)
Table 21 Europe Baked Green Tea Revenue (USD Million) By Application (2021-2032)
Table 22 Europe Baked Green Tea Revenue (USD Million) By Product (2021-2032)
Table 23 Asia Pacific Baked Green Tea Revenue (USD Million) By Type (2021-2032)
Table 24 Asia Pacific Baked Green Tea Revenue (USD Million) By Application (2021-2032)
Table 25 Asia Pacific Baked Green Tea Revenue (USD Million) By Product (2021-2032)
Table 26 South America Baked Green Tea Revenue (USD Million) By Type (2021-2032)
Table 27 South America Baked Green Tea Revenue (USD Million) By Application (2021-2032)
Table 28 South America Baked Green Tea Revenue (USD Million) By Product (2021-2032)
Table 29 Middle East and Africa Baked Green Tea Revenue (USD Million) By Type (2021-2032)
Table 30 Middle East and Africa Baked Green Tea Revenue (USD Million) By Application (2021-2032)
Table 31 Middle East and Africa Baked Green Tea Revenue (USD Million) By Product (2021-2032)
LIST OF FIGURES
Figure 1. Market Scope
Figure 2. Pricing Forecasts Per Unit, 2023- 2032
Figure 3. Porter’s Five Forces
Figure 4. Global Baked Green Tea Market Revenue (USD Million) By Regions (2021-2032)
Figure 5. Global Baked Green Tea Market Share (%) By Regions (2023)
Figure 6. North America Baked Green Tea Revenue (USD Million) By Country (2021-2032)
Figure 7. United States Baked Green Tea Revenue (USD Million) By Country (2021-2032)
Figure 8. Canada Baked Green Tea Revenue (USD Million) By Country (2021-2032)
Figure 9. Mexico Baked Green Tea Revenue (USD Million) By Country (2021-2032)
Figure 10. Europe Baked Green Tea Revenue (USD Million) By Country (2021-2032)
Figure 11. Germany Baked Green Tea Revenue (USD Million) By Country (2021-2032)
Figure 12. France Baked Green Tea Revenue (USD Million) By Country (2021-2032)
Figure 13. United Kingdom Baked Green Tea Revenue (USD Million) By Country (2021-2032)
Figure 14. Spain Baked Green Tea Revenue (USD Million) By Country (2021-2032)
Figure 15. Italy Baked Green Tea Revenue (USD Million) By Country (2021-2032)
Figure 16. Russia Baked Green Tea Revenue (USD Million) By Country (2021-2032)
Figure 17. Rest of Europe Baked Green Tea Revenue (USD Million) By Country (2021-2032)
Figure 11. Asia Pacific Baked Green Tea Revenue (USD Million) By Country (2021-2032)
Figure 12. China Baked Green Tea Revenue (USD Million) By Country (2021-2032)
Figure 13. Japan Baked Green Tea Revenue (USD Million) By Country (2021-2032)
Figure 14. India Baked Green Tea Revenue (USD Million) By Country (2021-2032)
Figure 15. South Korea Baked Green Tea Revenue (USD Million) By Country (2021-2032)
Figure 16. Australia Baked Green Tea Revenue (USD Million) By Country (2021-2032)
Figure 17. South East Asia Baked Green Tea Revenue (USD Million) By Country (2021-2032)
Figure 18. South America Baked Green Tea Revenue (USD Million) By Country (2021-2032)
Figure 19. Brazil Baked Green Tea Revenue (USD Million) By Country (2021-2032)
Figure 20. Argentina Baked Green Tea Revenue (USD Million) By Country (2021-2032)
Figure 21. Rest of Asia Pacific Baked Green Tea Revenue (USD Million) By Country (2021-2032)
Figure 22. Middle East and Africa Baked Green Tea Revenue (USD Million) By Region (2021-2032)
Figure 23. Saudi Arabia Baked Green Tea Revenue (USD Million) By Region (2021-2032)
Figure 24. The UAE Baked Green Tea Revenue (USD Million) By Region (2021-2032)
Figure 25. Rest of Middle East Baked Green Tea Revenue (USD Million) By Region (2021-2032)
Figure 26. South Africa Baked Green Tea Revenue (USD Million) By Region (2021-2032)
Figure 27. Africa Baked Green Tea Revenue (USD Million) By Region (2021-2032)
Figure 28. North America Baked Green Tea Revenue (USD Million) By Type (2021-2032)
Figure 29. North America Baked Green Tea Revenue (USD Million) By Application (2021-2032)
Figure 30. North America Baked Green Tea Revenue (USD Million) By Product (2021-2032)
Figure 31. Europe Baked Green Tea Revenue (USD Million) By Type (2021-2032)
Figure 32. Europe Baked Green Tea Revenue (USD Million) By Application (2021-2032)
Figure 33. Europe Baked Green Tea Revenue (USD Million) By Product (2021-2032)
Figure 34. Asia Pacific Baked Green Tea Revenue (USD Million) By Type (2021-2032)
Figure 35. Asia Pacific Baked Green Tea Revenue (USD Million) By Application (2021-2032)
Figure 36. Asia Pacific Baked Green Tea Revenue (USD Million) By Product (2021-2032)
Figure 37. South America Baked Green Tea Revenue (USD Million) By Type (2021-2032)
Figure 38. South America Baked Green Tea Revenue (USD Million) By Application (2021-2032)
Figure 39. South America Baked Green Tea Revenue (USD Million) By Product (2021-2032)
Figure 40. Middle East and Africa Baked Green Tea Revenue (USD Million) By Type (2021-2032)
Figure 41. Middle East and Africa Baked Green Tea Revenue (USD Million) By Application (2021-2032)
Figure 42. Middle East and Africa Baked Green Tea Revenue (USD Million) By Product (2021-2032)
By Type
Ordinary Baking
Tender and Green
Others
By Application
Beverages
Cosmetics
Functional Foods
Beauty Supplements
Countries Analyzed
North America (US, Canada, Mexico)
Europe (Germany, UK, France, Spain, Italy, Russia, Rest of Europe)
Asia Pacific (China, India, Japan, South Korea, Australia, South East Asia, Rest of Asia)
South America (Brazil, Argentina, Rest of South America)
Middle East and Africa (Saudi Arabia, UAE, Rest of Middle East, South Africa, Egypt, Rest of Africa)
