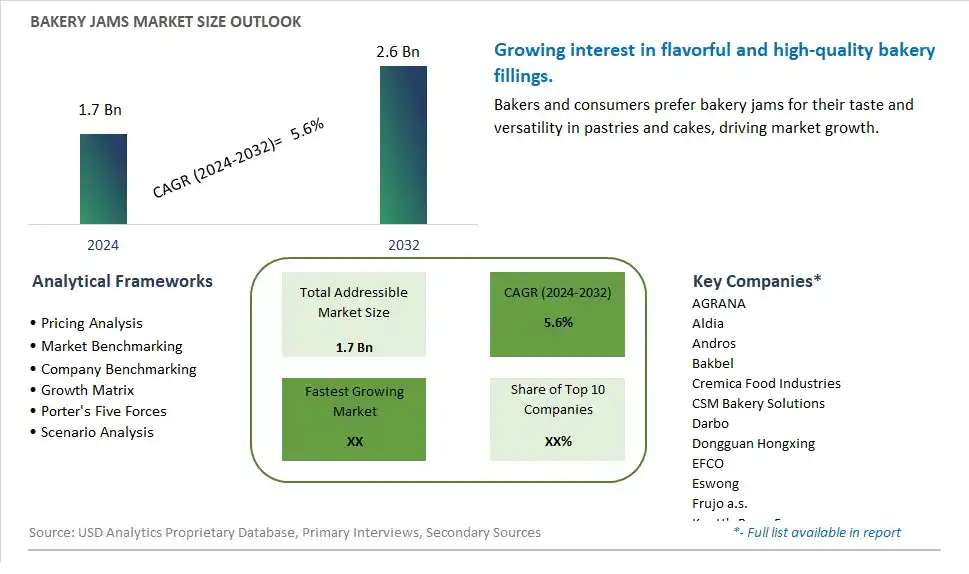
Global Bakery Jams Market Size is valued at $1.7 Billion in 2024 and is forecast to register a growth rate (CAGR) of 5.6% to reach $2.6 Billion by 2032.
The global Bakery Jams Market Comprehensive Study analyzes and forecasts the market size across 6 regions and 24 countries for diverse segments -By Type (Strawberry Jam, Mango Jam, Apple Jam, Blueberry Jam, Others), By Application (Residential, Commercial)
An Introduction to Bakery Jams Market
In 2024, the Bakery Jams market is expanding rapidly, fueled by the demand for high-quality, flavorful fillings in a variety of baked goods. Bakery jams, made from fruits and sweeteners, are used in products such as pastries, cookies, cakes, and tarts. The market is supported by the growing popularity of artisanal and premium bakery items that emphasize natural and rich flavors. Advances in jam processing and preservation technologies are enhancing the taste, texture, and shelf life of bakery jams. The market is also benefiting from the trend towards clean-label and organic products, appealing to health-conscious consumers seeking natural ingredients.
Bakery Jams Competitive Landscape
The market report analyses the leading companies in the industry including AGRANA, Aldia, Andros, Bakbel, Cremica Food Industries, CSM Bakery Solutions, Darbo, Dongguan Hongxing, EFCO, Eswong, Frujo a.s., Knott's Berry Farm, Kraft, lihaoshipin, MALATYA EKMEK KATKI, Puratos Group NV, Schwartau, SHANDONG DONGLAODA, Shen Yang Wen Shan, Smucker's, Tiptree, and Others.
Bakery Jams Market Dynamics
Bakery Jams Market Trend: Demand for Artisanal and Unique Bakery Jams
The most prominent market trend for Bakery Jams is the increasing demand for artisanal and unique varieties. Consumers are seeking jams that offer distinctive flavors, textures, and ingredients, such as exotic fruits, herbs, and spices, to elevate their bakery creations. There's a growing interest in gourmet and homemade-style jams that showcase natural sweetness, vibrant colors, and innovative flavor combinations, driving the demand for jams that add a touch of creativity and indulgence to baked goods. This trend reflects a broader consumer desire for premium, handmade, and authentic food experiences in the bakery industry.
Bakery Jams Market Driver: Consumer Preference for Natural and Preservative-Free Ingredients
A key market driver for Bakery Jams is the consumer preference for natural and preservative-free ingredients. Jams play a crucial role in adding sweetness, flavor, and moisture to bakery products such as tarts, thumbprint cookies, and filled pastries. Consumers value jams made from real fruits, without artificial colors, flavors, or additives, as they perceive them to be healthier, tastier, and more authentic. The driver of natural ingredient preferences propels the adoption and consumption of bakery jams that align with clean label and transparency expectations.
Bakery Jams Market Opportunity: Innovation in Functional and Health-Enhancing Jams
A potential opportunity within the Bakery Jams market lies in innovation in functional and health-enhancing jam formulations. Collaborating with nutritionists and food scientists can lead to the development of jams with added functional benefits, such as reduced sugar content, enhanced fiber content, or fortification with vitamins and antioxidants. Offering jam options that cater to specific dietary preferences, such as low glycemic index, diabetic-friendly, or organic certifications, can broaden market appeal and meet the diverse needs of health-conscious consumers. Additionally, exploring innovative jam varieties with superfood ingredients, natural sweeteners, or unique textures can create differentiation and value in the competitive bakery jams segment. By focusing on functional and health-enhancing innovations, there are opportunities to drive growth, capture market share, and create differentiated offerings in the bakery jams market.
Bakery Jams Market Share Analysis: Strawberry Jam segment generated the highest revenue share in the industry
The Strawberry Jam segment emerges as the largest and fastest-growing segment within the Bakery Jams Market. Strawberry jam, a classic and versatile fruit spread, holds widespread appeal among consumers for its vibrant color, sweet-tart flavor profile, and nostalgic associations with homemade preserves. The dominance of the Strawberry Jam segment is driven by several factors, including the enduring popularity of strawberry-flavored bakery products such as tarts, pastries, cakes, and sandwiches, the perception of strawberries as a healthy and natural ingredient, and the preference for familiar and comforting flavors in baked goods. Additionally, the versatility of strawberry jam allows for various applications in bakery settings, from filling and layering to glazing and topping, adding a burst of flavor and enhancing the overall sensory experience of bakery products. With ongoing innovations in jam production, including reduced-sugar options, organic varieties, and innovative flavor combinations, the Strawberry Jam segment continues to capture a significant market share and drive growth in the Bakery Jams Market, catering to evolving consumer tastes and culinary trends.
Bakery Jams Market Share Analysis: Commercial Application is the fastest growing segment over the forecast period to 2032
The Commercial Application segment is anticipated to experience rapid expansion and promising growth in the Bakery Jams Market leading up to 2032. This segment focuses on the use of jams in commercial settings such as bakeries, cafes, restaurants, hotels, and catering services. The fast growth of this segment is attributed to several factors, including the increasing demand for flavored bakery products in the foodservice industry, the rise of specialty bakeries offering customized jam-filled pastries and desserts, and the growing trend of incorporating jams into gourmet and artisanal bakery creations. Jams play a vital role in enhancing the flavor profile, texture, and visual appeal of baked goods, attracting customers and driving sales. Further, the versatility of jams allows for creativity in recipe development, offering endless possibilities for unique flavor combinations and product differentiation. With bakeries and food establishments focusing on innovation, quality, and customer satisfaction, the Commercial Application segment is poised to be a key driver of market growth and innovation in the Bakery Jams Market, catering to the evolving needs and preferences of commercial clients.
Bakery Jams Market Segmentation
By Type
Strawberry Jam
Mango Jam
Apple Jam
Blueberry Jam
Others
By Application
Residential
Commercial
Countries Analyzed
North America (US, Canada, Mexico)
Europe (Germany, UK, France, Spain, Italy, Russia, Rest of Europe)
Asia Pacific (China, India, Japan, South Korea, Australia, South East Asia, Rest of Asia)
South America (Brazil, Argentina, Rest of South America)
Middle East and Africa (Saudi Arabia, UAE, Rest of Middle East, South Africa, Egypt, Rest of Africa)
Bakery Jams Companies Profiled in the Study
AGRANA
Aldia
Andros
Bakbel
Cremica Food Industries
CSM Bakery Solutions
Darbo
Dongguan Hongxing
EFCO
Eswong
Frujo a.s.
Knott's Berry Farm
Kraft
lihaoshipin
MALATYA EKMEK KATKI
Puratos Group NV
Schwartau
SHANDONG DONGLAODA
Shen Yang Wen Shan
Smucker's
Tiptree
*- List Not Exhaustive
Chapter 1. TABLE OF CONTENTS
Chapter 2. Introduction to Bakery Jams Market
2.1. Market Overview
2.2. Key Statistics and Report Highlights
2.3. Scope of the Comprehensive Study
2.3.1. Market Definition
2.3.2 Countries and Regions Covered
2.3.3 Research Objective
2.3.4 Units, Currency, and Conversions
2.3.5 Industry Value Chain
2.4. Key Market Segments
2.5. Key Companies
2.6. Study Period
Chapter 3. Strategic Analysis Review
3.1. Bakery Jams Pricing Analysis and Forecast
3.2. Porter’s Five Forces
3.3. Market Ecosystem
3.4. SWOT Analysis
3.5. Regulatory Scenario
3.3. Effects of Inflation, Russia-Ukraine War, moderating economic growth, and other macroeconomic factors
Chapter 4. Competitive Landscape
4.1. Market Share Analysis
4.1.1. Global Bakery Jams Market Share by Company, 2023
4.1.2. Product Offerings of Leading Bakery Jams Companies
4.2. Market Entropy
4.2.1. New Product Launches in the Industry
4.2.2. Mergers, Acquisitions, Joint ventures, and Partnerships
4.3. Key Strategies and Best Practices
Chapter 5. Global Market Projections: Best, Reference, and Low Case Scenarios
5.1. Growth Analysis- Case Scenario Definitions
5.2. Low Growth Case Scenario Forecasts
5.3. Reference Growth Case Scenario Forecasts
5.4. High Growth Case Scenario Forecasts
Chapter 6. Market Dynamics
6.1. Bakery Jams Market Drivers
6.2. Bakery Jams Market Challenges
6.6. Bakery Jams Market Opportunities
6.4. Bakery Jams Market Trends
Chapter 7. Global Bakery Jams Market Outlook Trends
7.1. Global Bakery Jams Revenue (USD Million) and CAGR (%) by Type (2021-2032)
7.2. Global Bakery Jams Revenue (USD Million) and CAGR (%) by Application (2021-2032)
7.3. Global Bakery Jams Revenue (USD Million) and CAGR (%) by Product (2021-2032)
By Type
Strawberry Jam
Mango Jam
Apple Jam
Blueberry Jam
Others
By Application
Residential
Commercial
Chapter 8. Global Bakery Jams Regional Analysis and Outlook
8.1. Global Bakery Jams Revenue (USD Million) By Regions (2021- 2032)
8.2. North America Bakery Jams Revenue (USD Million) by Country (2021-2032)
8.2.1. United States Bakery Jams Regional Analysis and Outlook
8.2.2. Canada Bakery Jams Regional Analysis and Outlook
8.2.3. Mexico Bakery Jams Regional Analysis and Outlook
8.3. Europe Bakery Jams Revenue (USD Million), by Country (2021-2032)
8.3.1. Germany Bakery Jams Regional Analysis and Outlook
8.3.2. France Bakery Jams Regional Analysis and Outlook
8.3.3. United Kingdom Bakery Jams Regional Analysis and Outlook
8.3.4. Spain Bakery Jams Regional Analysis and Outlook
8.3.5. Italy Bakery Jams Regional Analysis and Outlook
8.3.6. Russia Bakery Jams Regional Analysis and Outlook
8.3.7. Rest of Europe Bakery Jams Regional Analysis and Outlook
8.4. Asia Pacific Bakery Jams Revenue (USD Million) by Country (2021-2032)
8.4.1. China Bakery Jams Regional Analysis and Outlook
8.4.2. Japan Bakery Jams Regional Analysis and Outlook
8.4.3. India Bakery Jams Regional Analysis and Outlook
8.4.4. South Korea Bakery Jams Regional Analysis and Outlook
8.4.5. Australia Bakery Jams Regional Analysis and Outlook
8.4.6. South East Asia Bakery Jams Regional Analysis and Outlook
8.4.7. Rest of Asia Pacific Bakery Jams Regional Analysis and Outlook
8.5. South America Bakery Jams Revenue (USD Million), by Country (2021-2032)
8.5.1. Brazil Bakery Jams Regional Analysis and Outlook
8.5.2. Argentina Bakery Jams Regional Analysis and Outlook
8.5.3. Rest of South America Bakery Jams Regional Analysis and Outlook
8.6. Middle East and Africa Bakery Jams Revenue (USD Million) by Country (2021-2032)
8.6.1. Middle East Bakery Jams Regional Analysis and Outlook
8.6.2. Africa Bakery Jams Regional Analysis and Outlook
Chapter 9. North America Bakery Jams Analysis and Outlook
9.1. North America Bakery Jams Revenue (USD Million) by Segments (2021-2032)
9.1.1. North America Bakery Jams Revenue (USD Million) by Type (2021-2032)
9.1.2. North America Bakery Jams Revenue (USD Million) by Application (2021-2032)
9.1.3. North America Bakery Jams Revenue (USD Million) by Product (2021-2032)
By Type
Strawberry Jam
Mango Jam
Apple Jam
Blueberry Jam
Others
By Application
Residential
Commercial
Chapter 10. Europe Bakery Jams Analysis and Outlook
10.1. Europe Bakery Jams Revenue (USD Million), by Segments (USD Million) (2021-2032)
10.1.1. Europe Bakery Jams Revenue (USD Million) by Type (2021-2032)
10.1.2. Europe Bakery Jams Revenue (USD Million) by Application (2021-2032)
10.1.3. Europe Bakery Jams Revenue (USD Million) by Product (2021-2032)
By Type
Strawberry Jam
Mango Jam
Apple Jam
Blueberry Jam
Others
By Application
Residential
Commercial
Chapter 11. Asia Pacific Bakery Jams Analysis and Outlook
11.1. Asia Pacific Bakery Jams Revenue (USD Million), and Revenue (USD Million) by Segments (2021-2032)
11.1.1. Asia Pacific Bakery Jams Revenue (USD Million) by Type (2021-2032)
11.1.2. Asia Pacific Bakery Jams Revenue (USD Million) by Application (2021-2032)
11.1.3. Asia Pacific Bakery Jams Revenue (USD Million) by Product (2021-2032)
By Type
Strawberry Jam
Mango Jam
Apple Jam
Blueberry Jam
Others
By Application
Residential
Commercial
Chapter 12. South America Bakery Jams Analysis and Outlook
12.1. South America Bakery Jams Revenue (USD Million), by Segments (2021-2032)
12.1.1. South America Bakery Jams Revenue (USD Million) by Type (2021-2032)
12.1.2. South America Bakery Jams Revenue (USD Million) by Application (2021-2032)
12.1.3. South America Bakery Jams Revenue (USD Million) by Product (2021-2032)
By Type
Strawberry Jam
Mango Jam
Apple Jam
Blueberry Jam
Others
By Application
Residential
Commercial
Chapter 13. Middle East and Africa Bakery Jams Analysis and Outlook
13.1. Middle East and Africa Bakery Jams Revenue (USD Million), by Segments (2021-2032)
13.1.1. Middle East and Africa Bakery Jams Revenue (USD Million) by Type (2021-2032)
13.1.2. Middle East and Africa Bakery Jams Revenue (USD Million) by Application (2021-2032)
13.1.3. Middle East and Africa Bakery Jams Revenue (USD Million) by Product (2021-2032)
By Type
Strawberry Jam
Mango Jam
Apple Jam
Blueberry Jam
Others
By Application
Residential
Commercial
Chapter 14. Bakery Jams Company Profiles
14.1 Business Overview
14.2 Product Profiles
14.3 SWOT Profiles
14.5 Recent Developments
14.6 Financial Profile
List of Companies
AGRANA
Aldia
Andros
Bakbel
Cremica Food Industries
CSM Bakery Solutions
Darbo
Dongguan Hongxing
EFCO
Eswong
Frujo a.s.
Knott's Berry Farm
Kraft
lihaoshipin
MALATYA EKMEK KATKI
Puratos Group NV
Schwartau
SHANDONG DONGLAODA
Shen Yang Wen Shan
Smucker's
Tiptree
15. Methodology and Data Sources
15.1 Customization Offerings
15.2 Subscription Services
15.3 Related Reports
15.4 Publisher Expertise
LIST OF TABLES
Table 1 Market Segmentation Analysis
Table 2 Global Bakery Jams Market Share of Leading Companies, 2023
Table 3 Product Offerings of Leading Companies
Table 4 Low Growth Scenario Forecasts
Table 5 Reference Case Growth Scenario
Table 6 High Growth Case Scenario
Table 7 Global Bakery Jams Revenue (USD Million) And CAGR (%) By Type (2021-2032)
Table 8 Global Bakery Jams Revenue (USD Million) And CAGR (%) By Application (2021-2032)
Table 9 Global Bakery Jams Revenue (USD Million) And CAGR (%) By Product (2021-2032)
Table 10 Global Bakery Jams Market Revenue (USD Million) By Regions (2021-2032)
Table 11 Global Bakery Jams Market Share (%) By Regions (2021-2032)
Table 12 North America Bakery Jams Revenue (USD Million) By Country (2021-2032)
Table 13 Europe Bakery Jams Revenue (USD Million) By Country (2021-2032)
Table 14 Asia Pacific Bakery Jams Revenue (USD Million) By Country (2021-2032)
Table 15 South America Bakery Jams Revenue (USD Million) By Country (2021-2032)
Table 16 Middle East and Africa Bakery Jams Revenue (USD Million) By Region (2021-2032)
Table 17 North America Bakery Jams Revenue (USD Million) By Type (2021-2032)
Table 18 North America Bakery Jams Revenue (USD Million) By Application (2021-2032)
Table 19 North America Bakery Jams Revenue (USD Million) By Product (2021-2032)
Table 20 Europe Bakery Jams Revenue (USD Million) By Type (2021-2032)
Table 21 Europe Bakery Jams Revenue (USD Million) By Application (2021-2032)
Table 22 Europe Bakery Jams Revenue (USD Million) By Product (2021-2032)
Table 23 Asia Pacific Bakery Jams Revenue (USD Million) By Type (2021-2032)
Table 24 Asia Pacific Bakery Jams Revenue (USD Million) By Application (2021-2032)
Table 25 Asia Pacific Bakery Jams Revenue (USD Million) By Product (2021-2032)
Table 26 South America Bakery Jams Revenue (USD Million) By Type (2021-2032)
Table 27 South America Bakery Jams Revenue (USD Million) By Application (2021-2032)
Table 28 South America Bakery Jams Revenue (USD Million) By Product (2021-2032)
Table 29 Middle East and Africa Bakery Jams Revenue (USD Million) By Type (2021-2032)
Table 30 Middle East and Africa Bakery Jams Revenue (USD Million) By Application (2021-2032)
Table 31 Middle East and Africa Bakery Jams Revenue (USD Million) By Product (2021-2032)
LIST OF FIGURES
Figure 1. Market Scope
Figure 2. Pricing Forecasts Per Unit, 2023- 2032
Figure 3. Porter’s Five Forces
Figure 4. Global Bakery Jams Market Revenue (USD Million) By Regions (2021-2032)
Figure 5. Global Bakery Jams Market Share (%) By Regions (2023)
Figure 6. North America Bakery Jams Revenue (USD Million) By Country (2021-2032)
Figure 7. United States Bakery Jams Revenue (USD Million) By Country (2021-2032)
Figure 8. Canada Bakery Jams Revenue (USD Million) By Country (2021-2032)
Figure 9. Mexico Bakery Jams Revenue (USD Million) By Country (2021-2032)
Figure 10. Europe Bakery Jams Revenue (USD Million) By Country (2021-2032)
Figure 11. Germany Bakery Jams Revenue (USD Million) By Country (2021-2032)
Figure 12. France Bakery Jams Revenue (USD Million) By Country (2021-2032)
Figure 13. United Kingdom Bakery Jams Revenue (USD Million) By Country (2021-2032)
Figure 14. Spain Bakery Jams Revenue (USD Million) By Country (2021-2032)
Figure 15. Italy Bakery Jams Revenue (USD Million) By Country (2021-2032)
Figure 16. Russia Bakery Jams Revenue (USD Million) By Country (2021-2032)
Figure 17. Rest of Europe Bakery Jams Revenue (USD Million) By Country (2021-2032)
Figure 11. Asia Pacific Bakery Jams Revenue (USD Million) By Country (2021-2032)
Figure 12. China Bakery Jams Revenue (USD Million) By Country (2021-2032)
Figure 13. Japan Bakery Jams Revenue (USD Million) By Country (2021-2032)
Figure 14. India Bakery Jams Revenue (USD Million) By Country (2021-2032)
Figure 15. South Korea Bakery Jams Revenue (USD Million) By Country (2021-2032)
Figure 16. Australia Bakery Jams Revenue (USD Million) By Country (2021-2032)
Figure 17. South East Asia Bakery Jams Revenue (USD Million) By Country (2021-2032)
Figure 18. South America Bakery Jams Revenue (USD Million) By Country (2021-2032)
Figure 19. Brazil Bakery Jams Revenue (USD Million) By Country (2021-2032)
Figure 20. Argentina Bakery Jams Revenue (USD Million) By Country (2021-2032)
Figure 21. Rest of Asia Pacific Bakery Jams Revenue (USD Million) By Country (2021-2032)
Figure 22. Middle East and Africa Bakery Jams Revenue (USD Million) By Region (2021-2032)
Figure 23. Saudi Arabia Bakery Jams Revenue (USD Million) By Region (2021-2032)
Figure 24. The UAE Bakery Jams Revenue (USD Million) By Region (2021-2032)
Figure 25. Rest of Middle East Bakery Jams Revenue (USD Million) By Region (2021-2032)
Figure 26. South Africa Bakery Jams Revenue (USD Million) By Region (2021-2032)
Figure 27. Africa Bakery Jams Revenue (USD Million) By Region (2021-2032)
Figure 28. North America Bakery Jams Revenue (USD Million) By Type (2021-2032)
Figure 29. North America Bakery Jams Revenue (USD Million) By Application (2021-2032)
Figure 30. North America Bakery Jams Revenue (USD Million) By Product (2021-2032)
Figure 31. Europe Bakery Jams Revenue (USD Million) By Type (2021-2032)
Figure 32. Europe Bakery Jams Revenue (USD Million) By Application (2021-2032)
Figure 33. Europe Bakery Jams Revenue (USD Million) By Product (2021-2032)
Figure 34. Asia Pacific Bakery Jams Revenue (USD Million) By Type (2021-2032)
Figure 35. Asia Pacific Bakery Jams Revenue (USD Million) By Application (2021-2032)
Figure 36. Asia Pacific Bakery Jams Revenue (USD Million) By Product (2021-2032)
Figure 37. South America Bakery Jams Revenue (USD Million) By Type (2021-2032)
Figure 38. South America Bakery Jams Revenue (USD Million) By Application (2021-2032)
Figure 39. South America Bakery Jams Revenue (USD Million) By Product (2021-2032)
Figure 40. Middle East and Africa Bakery Jams Revenue (USD Million) By Type (2021-2032)
Figure 41. Middle East and Africa Bakery Jams Revenue (USD Million) By Application (2021-2032)
Figure 42. Middle East and Africa Bakery Jams Revenue (USD Million) By Product (2021-2032)
By Type
Strawberry Jam
Mango Jam
Apple Jam
Blueberry Jam
Others
By Application
Residential
Commercial
Countries Analyzed
North America (US, Canada, Mexico)
Europe (Germany, UK, France, Spain, Italy, Russia, Rest of Europe)
Asia Pacific (China, India, Japan, South Korea, Australia, South East Asia, Rest of Asia)
South America (Brazil, Argentina, Rest of South America)
Middle East and Africa (Saudi Arabia, UAE, Rest of Middle East, South Africa, Egypt, Rest of Africa)
