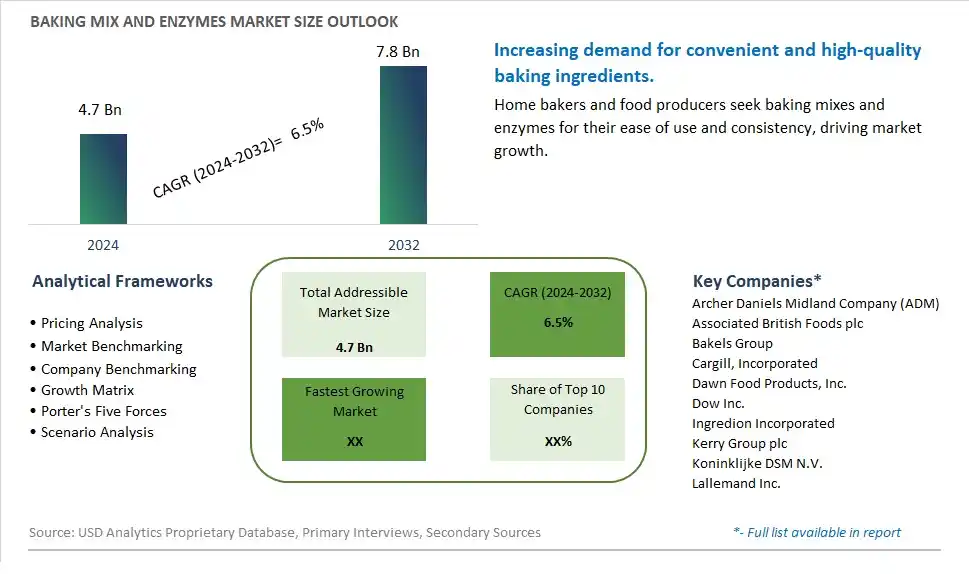
Global Baking Mix and Enzymes Market Size is valued at $4.7 Billion in 2024 and is forecast to register a growth rate (CAGR) of 6.5% to reach $7.8 Billion by 2032.
The global Baking Mix and Enzymes Market Comprehensive Study analyzes and forecasts the market size across 6 regions and 24 countries for diverse segments -By Type (Enzymes, Baking Mix), By Application (Bread, Cookies & Biscuits, Rolls & Pies, Cakes & Pastries, Others)
An Introduction to Baking Mix and Enzymes Market
The Baking Mix and Enzymes market in 2024 is expanding rapidly, fueled by the increasing demand for convenient and high-quality baking solutions. Baking mixes, which include pre-measured ingredients for various baked goods, and enzymes, which enhance dough properties and product quality, are popular among both home bakers and commercial bakers. The market is supported by the growing trend towards home baking and the demand for consistent and easy-to-use products. Innovations in mix formulations and enzyme technology are enhancing the performance, taste, and nutritional profile of baked goods. The market is also benefiting from the rise of specialty mixes and enzymes, catering to diverse dietary needs and preferences.
Baking Mix and Enzymes Competitive Landscape
The market report analyses the leading companies in the industry including Archer Daniels Midland Company (ADM), Associated British Foods plc, Bakels Group, Cargill, Incorporated, Dawn Food Products, Inc., Dow Inc., Ingredion Incorporated, Kerry Group plc, Koninklijke DSM N.V., Lallemand Inc., and Others.
Baking Mix and Enzymes Market Dynamics
Baking Mix and Enzymes Market Trend: Demand for Convenience and Improved Baking Performance
The most prominent market trend for Baking Mix and Enzymes is the increasing demand for convenience and improved baking performance. Consumers and bakery professionals are seeking baking mixes and enzyme solutions that streamline the baking process, reduce preparation time, and enhance product quality. Baking mixes offer pre-measured ingredients for various recipes, while enzymes improve dough handling, texture, and shelf-life of baked goods. There's a growing interest in solutions that simplify baking tasks and deliver consistent, high-quality results, reflecting a broader consumer need for convenience and efficiency in baking.
Baking Mix and Enzymes Market Driver: Focus on Product Innovation and Differentiation
A key market driver for Baking Mix and Enzymes is the focus on product innovation and differentiation. Manufacturers are developing new baking mix formulations with unique flavors, textures, and dietary preferences, catering to diverse consumer needs. Enzyme solutions are also evolving to offer improved functionality, such as gluten enhancement, crumb softening, or natural preservation, driving product differentiation and versatility in bakery applications. The driver of product innovation and differentiation propels the adoption of baking mixes and enzymes by bakery professionals looking to create distinctive offerings and meet evolving consumer demands.
Baking Mix and Enzymes Market Opportunity: Collaboration for Customized Solutions and Application Support
A potential opportunity within the Baking Mix and Enzymes market lies in collaboration for customized solutions and application support. Partnering with bakery experts, food scientists, and culinary professionals can lead to the development of tailored baking mix formulations and enzyme solutions optimized for specific baking processes, recipes, and equipment. Offering comprehensive application support, such as recipe development, troubleshooting guides, and technical assistance, can help bakeries maximize the benefits of baking mixes and enzymes, improve product consistency, and achieve desired results. Additionally, providing training programs, workshops, and educational resources on baking techniques and ingredient usage can enhance customer engagement, loyalty, and long-term relationships. By focusing on collaboration and customized solutions, there are opportunities to build strategic partnerships, drive product adoption, and create value-added services in the competitive baking mix and enzymes market.
Baking Mix and Enzymes Market Share Analysis: Baking Mix segment generated the highest revenue share in the industry
The Baking Mix segment emerges as the largest and steadily growing segment within the Baking Mix and Enzymes Market. Baking mixes refer to pre-packaged combinations of dry ingredients such as flour, sugar, baking powder, and flavorings, designed to simplify the baking process for consumers. Their dominance is driven by several factors, including convenience, time-saving benefits, and the increasing popularity of home baking among consumers. Baking mixes offer a convenient solution for consumers to create homemade baked goods with consistent results, making them a preferred choice for busy households and novice bakers. Further, with the trend of premium and specialty baking mixes featuring natural ingredients, organic options, and innovative flavors, the Baking Mix segment is expected to maintain its market leadership and witness steady growth as consumers continue to explore baking as a hobby and seek convenient solutions for their baking needs.
Baking Mix and Enzymes Market Share Analysis: Cakes & Pastries Application is the fastest growing segment over the forecast period to 2032
The Cakes & Pastries Application segment is anticipated to experience rapid expansion and promising growth in the Baking Mix and Enzymes Market leading up to 2032. This segment focuses on the use of baking mixes and enzymes in the production of cakes, pastries, and similar baked goods. The fast growth of this segment is attributed to several factors, including the growing demand for indulgent and specialty desserts, the rise of bakery cafes and patisseries offering a wide range of cakes and pastries, and the increasing consumer preference for convenient baking solutions without compromising on taste and quality. Baking mixes and enzymes play a crucial role in simplifying the baking process, ensuring consistent results, and enhancing the texture and flavor of cakes and pastries. Further, with advancements in ingredient technology, clean label solutions, and the availability of premium baking mixes with natural ingredients and unique flavors, the Cakes & Pastries Application segment is poised to be a key driver of market growth and innovation in the Baking Mix and Enzymes Market, catering to the evolving tastes and preferences of dessert enthusiasts and bakery professionals.
Baking Mix and Enzymes Market Segmentation
By Type
Enzymes
Baking Mix
By Application
Bread
Cookies & Biscuits
Rolls & Pies
Cakes & Pastries
Others
Countries Analyzed
North America (US, Canada, Mexico)
Europe (Germany, UK, France, Spain, Italy, Russia, Rest of Europe)
Asia Pacific (China, India, Japan, South Korea, Australia, South East Asia, Rest of Asia)
South America (Brazil, Argentina, Rest of South America)
Middle East and Africa (Saudi Arabia, UAE, Rest of Middle East, South Africa, Egypt, Rest of Africa)
Baking Mix and Enzymes Companies Profiled in the Study
Archer Daniels Midland Company (ADM)
Associated British Foods plc
Bakels Group
Cargill, Incorporated
Dawn Food Products, Inc.
Dow Inc.
Ingredion Incorporated
Kerry Group plc
Koninklijke DSM N.V.
Lallemand Inc.
*- List Not Exhaustive
Chapter 1. TABLE OF CONTENTS
Chapter 2. Introduction to Baking Mix and Enzymes Market
2.1. Market Overview
2.2. Key Statistics and Report Highlights
2.3. Scope of the Comprehensive Study
2.3.1. Market Definition
2.3.2 Countries and Regions Covered
2.3.3 Research Objective
2.3.4 Units, Currency, and Conversions
2.3.5 Industry Value Chain
2.4. Key Market Segments
2.5. Key Companies
2.6. Study Period
Chapter 3. Strategic Analysis Review
3.1. Baking Mix and Enzymes Pricing Analysis and Forecast
3.2. Porter’s Five Forces
3.3. Market Ecosystem
3.4. SWOT Analysis
3.5. Regulatory Scenario
3.3. Effects of Inflation, Russia-Ukraine War, moderating economic growth, and other macroeconomic factors
Chapter 4. Competitive Landscape
4.1. Market Share Analysis
4.1.1. Global Baking Mix and Enzymes Market Share by Company, 2023
4.1.2. Product Offerings of Leading Baking Mix and Enzymes Companies
4.2. Market Entropy
4.2.1. New Product Launches in the Industry
4.2.2. Mergers, Acquisitions, Joint ventures, and Partnerships
4.3. Key Strategies and Best Practices
Chapter 5. Global Market Projections: Best, Reference, and Low Case Scenarios
5.1. Growth Analysis- Case Scenario Definitions
5.2. Low Growth Case Scenario Forecasts
5.3. Reference Growth Case Scenario Forecasts
5.4. High Growth Case Scenario Forecasts
Chapter 6. Market Dynamics
6.1. Baking Mix and Enzymes Market Drivers
6.2. Baking Mix and Enzymes Market Challenges
6.6. Baking Mix and Enzymes Market Opportunities
6.4. Baking Mix and Enzymes Market Trends
Chapter 7. Global Baking Mix and Enzymes Market Outlook Trends
7.1. Global Baking Mix and Enzymes Revenue (USD Million) and CAGR (%) by Type (2021-2032)
7.2. Global Baking Mix and Enzymes Revenue (USD Million) and CAGR (%) by Application (2021-2032)
7.3. Global Baking Mix and Enzymes Revenue (USD Million) and CAGR (%) by Product (2021-2032)
By Type
Enzymes
Baking Mix
By Application
Bread
Cookies & Biscuits
Rolls & Pies
Cakes & Pastries
Others
Chapter 8. Global Baking Mix and Enzymes Regional Analysis and Outlook
8.1. Global Baking Mix and Enzymes Revenue (USD Million) By Regions (2021- 2032)
8.2. North America Baking Mix and Enzymes Revenue (USD Million) by Country (2021-2032)
8.2.1. United States Baking Mix and Enzymes Regional Analysis and Outlook
8.2.2. Canada Baking Mix and Enzymes Regional Analysis and Outlook
8.2.3. Mexico Baking Mix and Enzymes Regional Analysis and Outlook
8.3. Europe Baking Mix and Enzymes Revenue (USD Million), by Country (2021-2032)
8.3.1. Germany Baking Mix and Enzymes Regional Analysis and Outlook
8.3.2. France Baking Mix and Enzymes Regional Analysis and Outlook
8.3.3. United Kingdom Baking Mix and Enzymes Regional Analysis and Outlook
8.3.4. Spain Baking Mix and Enzymes Regional Analysis and Outlook
8.3.5. Italy Baking Mix and Enzymes Regional Analysis and Outlook
8.3.6. Russia Baking Mix and Enzymes Regional Analysis and Outlook
8.3.7. Rest of Europe Baking Mix and Enzymes Regional Analysis and Outlook
8.4. Asia Pacific Baking Mix and Enzymes Revenue (USD Million) by Country (2021-2032)
8.4.1. China Baking Mix and Enzymes Regional Analysis and Outlook
8.4.2. Japan Baking Mix and Enzymes Regional Analysis and Outlook
8.4.3. India Baking Mix and Enzymes Regional Analysis and Outlook
8.4.4. South Korea Baking Mix and Enzymes Regional Analysis and Outlook
8.4.5. Australia Baking Mix and Enzymes Regional Analysis and Outlook
8.4.6. South East Asia Baking Mix and Enzymes Regional Analysis and Outlook
8.4.7. Rest of Asia Pacific Baking Mix and Enzymes Regional Analysis and Outlook
8.5. South America Baking Mix and Enzymes Revenue (USD Million), by Country (2021-2032)
8.5.1. Brazil Baking Mix and Enzymes Regional Analysis and Outlook
8.5.2. Argentina Baking Mix and Enzymes Regional Analysis and Outlook
8.5.3. Rest of South America Baking Mix and Enzymes Regional Analysis and Outlook
8.6. Middle East and Africa Baking Mix and Enzymes Revenue (USD Million) by Country (2021-2032)
8.6.1. Middle East Baking Mix and Enzymes Regional Analysis and Outlook
8.6.2. Africa Baking Mix and Enzymes Regional Analysis and Outlook
Chapter 9. North America Baking Mix and Enzymes Analysis and Outlook
9.1. North America Baking Mix and Enzymes Revenue (USD Million) by Segments (2021-2032)
9.1.1. North America Baking Mix and Enzymes Revenue (USD Million) by Type (2021-2032)
9.1.2. North America Baking Mix and Enzymes Revenue (USD Million) by Application (2021-2032)
9.1.3. North America Baking Mix and Enzymes Revenue (USD Million) by Product (2021-2032)
By Type
Enzymes
Baking Mix
By Application
Bread
Cookies & Biscuits
Rolls & Pies
Cakes & Pastries
Others
Chapter 10. Europe Baking Mix and Enzymes Analysis and Outlook
10.1. Europe Baking Mix and Enzymes Revenue (USD Million), by Segments (USD Million) (2021-2032)
10.1.1. Europe Baking Mix and Enzymes Revenue (USD Million) by Type (2021-2032)
10.1.2. Europe Baking Mix and Enzymes Revenue (USD Million) by Application (2021-2032)
10.1.3. Europe Baking Mix and Enzymes Revenue (USD Million) by Product (2021-2032)
By Type
Enzymes
Baking Mix
By Application
Bread
Cookies & Biscuits
Rolls & Pies
Cakes & Pastries
Others
Chapter 11. Asia Pacific Baking Mix and Enzymes Analysis and Outlook
11.1. Asia Pacific Baking Mix and Enzymes Revenue (USD Million), and Revenue (USD Million) by Segments (2021-2032)
11.1.1. Asia Pacific Baking Mix and Enzymes Revenue (USD Million) by Type (2021-2032)
11.1.2. Asia Pacific Baking Mix and Enzymes Revenue (USD Million) by Application (2021-2032)
11.1.3. Asia Pacific Baking Mix and Enzymes Revenue (USD Million) by Product (2021-2032)
By Type
Enzymes
Baking Mix
By Application
Bread
Cookies & Biscuits
Rolls & Pies
Cakes & Pastries
Others
Chapter 12. South America Baking Mix and Enzymes Analysis and Outlook
12.1. South America Baking Mix and Enzymes Revenue (USD Million), by Segments (2021-2032)
12.1.1. South America Baking Mix and Enzymes Revenue (USD Million) by Type (2021-2032)
12.1.2. South America Baking Mix and Enzymes Revenue (USD Million) by Application (2021-2032)
12.1.3. South America Baking Mix and Enzymes Revenue (USD Million) by Product (2021-2032)
By Type
Enzymes
Baking Mix
By Application
Bread
Cookies & Biscuits
Rolls & Pies
Cakes & Pastries
Others
Chapter 13. Middle East and Africa Baking Mix and Enzymes Analysis and Outlook
13.1. Middle East and Africa Baking Mix and Enzymes Revenue (USD Million), by Segments (2021-2032)
13.1.1. Middle East and Africa Baking Mix and Enzymes Revenue (USD Million) by Type (2021-2032)
13.1.2. Middle East and Africa Baking Mix and Enzymes Revenue (USD Million) by Application (2021-2032)
13.1.3. Middle East and Africa Baking Mix and Enzymes Revenue (USD Million) by Product (2021-2032)
By Type
Enzymes
Baking Mix
By Application
Bread
Cookies & Biscuits
Rolls & Pies
Cakes & Pastries
Others
Chapter 14. Baking Mix and Enzymes Company Profiles
14.1 Business Overview
14.2 Product Profiles
14.3 SWOT Profiles
14.5 Recent Developments
14.6 Financial Profile
List of Companies
Archer Daniels Midland Company (ADM)
Associated British Foods plc
Bakels Group
Cargill, Incorporated
Dawn Food Products, Inc.
Dow Inc.
Ingredion Incorporated
Kerry Group plc
Koninklijke DSM N.V.
Lallemand Inc.
15. Methodology and Data Sources
15.1 Customization Offerings
15.2 Subscription Services
15.3 Related Reports
15.4 Publisher Expertise
LIST OF TABLES
Table 1 Market Segmentation Analysis
Table 2 Global Baking Mix and Enzymes Market Share of Leading Companies, 2023
Table 3 Product Offerings of Leading Companies
Table 4 Low Growth Scenario Forecasts
Table 5 Reference Case Growth Scenario
Table 6 High Growth Case Scenario
Table 7 Global Baking Mix and Enzymes Revenue (USD Million) And CAGR (%) By Type (2021-2032)
Table 8 Global Baking Mix and Enzymes Revenue (USD Million) And CAGR (%) By Application (2021-2032)
Table 9 Global Baking Mix and Enzymes Revenue (USD Million) And CAGR (%) By Product (2021-2032)
Table 10 Global Baking Mix and Enzymes Market Revenue (USD Million) By Regions (2021-2032)
Table 11 Global Baking Mix and Enzymes Market Share (%) By Regions (2021-2032)
Table 12 North America Baking Mix and Enzymes Revenue (USD Million) By Country (2021-2032)
Table 13 Europe Baking Mix and Enzymes Revenue (USD Million) By Country (2021-2032)
Table 14 Asia Pacific Baking Mix and Enzymes Revenue (USD Million) By Country (2021-2032)
Table 15 South America Baking Mix and Enzymes Revenue (USD Million) By Country (2021-2032)
Table 16 Middle East and Africa Baking Mix and Enzymes Revenue (USD Million) By Region (2021-2032)
Table 17 North America Baking Mix and Enzymes Revenue (USD Million) By Type (2021-2032)
Table 18 North America Baking Mix and Enzymes Revenue (USD Million) By Application (2021-2032)
Table 19 North America Baking Mix and Enzymes Revenue (USD Million) By Product (2021-2032)
Table 20 Europe Baking Mix and Enzymes Revenue (USD Million) By Type (2021-2032)
Table 21 Europe Baking Mix and Enzymes Revenue (USD Million) By Application (2021-2032)
Table 22 Europe Baking Mix and Enzymes Revenue (USD Million) By Product (2021-2032)
Table 23 Asia Pacific Baking Mix and Enzymes Revenue (USD Million) By Type (2021-2032)
Table 24 Asia Pacific Baking Mix and Enzymes Revenue (USD Million) By Application (2021-2032)
Table 25 Asia Pacific Baking Mix and Enzymes Revenue (USD Million) By Product (2021-2032)
Table 26 South America Baking Mix and Enzymes Revenue (USD Million) By Type (2021-2032)
Table 27 South America Baking Mix and Enzymes Revenue (USD Million) By Application (2021-2032)
Table 28 South America Baking Mix and Enzymes Revenue (USD Million) By Product (2021-2032)
Table 29 Middle East and Africa Baking Mix and Enzymes Revenue (USD Million) By Type (2021-2032)
Table 30 Middle East and Africa Baking Mix and Enzymes Revenue (USD Million) By Application (2021-2032)
Table 31 Middle East and Africa Baking Mix and Enzymes Revenue (USD Million) By Product (2021-2032)
LIST OF FIGURES
Figure 1. Market Scope
Figure 2. Pricing Forecasts Per Unit, 2023- 2032
Figure 3. Porter’s Five Forces
Figure 4. Global Baking Mix and Enzymes Market Revenue (USD Million) By Regions (2021-2032)
Figure 5. Global Baking Mix and Enzymes Market Share (%) By Regions (2023)
Figure 6. North America Baking Mix and Enzymes Revenue (USD Million) By Country (2021-2032)
Figure 7. United States Baking Mix and Enzymes Revenue (USD Million) By Country (2021-2032)
Figure 8. Canada Baking Mix and Enzymes Revenue (USD Million) By Country (2021-2032)
Figure 9. Mexico Baking Mix and Enzymes Revenue (USD Million) By Country (2021-2032)
Figure 10. Europe Baking Mix and Enzymes Revenue (USD Million) By Country (2021-2032)
Figure 11. Germany Baking Mix and Enzymes Revenue (USD Million) By Country (2021-2032)
Figure 12. France Baking Mix and Enzymes Revenue (USD Million) By Country (2021-2032)
Figure 13. United Kingdom Baking Mix and Enzymes Revenue (USD Million) By Country (2021-2032)
Figure 14. Spain Baking Mix and Enzymes Revenue (USD Million) By Country (2021-2032)
Figure 15. Italy Baking Mix and Enzymes Revenue (USD Million) By Country (2021-2032)
Figure 16. Russia Baking Mix and Enzymes Revenue (USD Million) By Country (2021-2032)
Figure 17. Rest of Europe Baking Mix and Enzymes Revenue (USD Million) By Country (2021-2032)
Figure 11. Asia Pacific Baking Mix and Enzymes Revenue (USD Million) By Country (2021-2032)
Figure 12. China Baking Mix and Enzymes Revenue (USD Million) By Country (2021-2032)
Figure 13. Japan Baking Mix and Enzymes Revenue (USD Million) By Country (2021-2032)
Figure 14. India Baking Mix and Enzymes Revenue (USD Million) By Country (2021-2032)
Figure 15. South Korea Baking Mix and Enzymes Revenue (USD Million) By Country (2021-2032)
Figure 16. Australia Baking Mix and Enzymes Revenue (USD Million) By Country (2021-2032)
Figure 17. South East Asia Baking Mix and Enzymes Revenue (USD Million) By Country (2021-2032)
Figure 18. South America Baking Mix and Enzymes Revenue (USD Million) By Country (2021-2032)
Figure 19. Brazil Baking Mix and Enzymes Revenue (USD Million) By Country (2021-2032)
Figure 20. Argentina Baking Mix and Enzymes Revenue (USD Million) By Country (2021-2032)
Figure 21. Rest of Asia Pacific Baking Mix and Enzymes Revenue (USD Million) By Country (2021-2032)
Figure 22. Middle East and Africa Baking Mix and Enzymes Revenue (USD Million) By Region (2021-2032)
Figure 23. Saudi Arabia Baking Mix and Enzymes Revenue (USD Million) By Region (2021-2032)
Figure 24. The UAE Baking Mix and Enzymes Revenue (USD Million) By Region (2021-2032)
Figure 25. Rest of Middle East Baking Mix and Enzymes Revenue (USD Million) By Region (2021-2032)
Figure 26. South Africa Baking Mix and Enzymes Revenue (USD Million) By Region (2021-2032)
Figure 27. Africa Baking Mix and Enzymes Revenue (USD Million) By Region (2021-2032)
Figure 28. North America Baking Mix and Enzymes Revenue (USD Million) By Type (2021-2032)
Figure 29. North America Baking Mix and Enzymes Revenue (USD Million) By Application (2021-2032)
Figure 30. North America Baking Mix and Enzymes Revenue (USD Million) By Product (2021-2032)
Figure 31. Europe Baking Mix and Enzymes Revenue (USD Million) By Type (2021-2032)
Figure 32. Europe Baking Mix and Enzymes Revenue (USD Million) By Application (2021-2032)
Figure 33. Europe Baking Mix and Enzymes Revenue (USD Million) By Product (2021-2032)
Figure 34. Asia Pacific Baking Mix and Enzymes Revenue (USD Million) By Type (2021-2032)
Figure 35. Asia Pacific Baking Mix and Enzymes Revenue (USD Million) By Application (2021-2032)
Figure 36. Asia Pacific Baking Mix and Enzymes Revenue (USD Million) By Product (2021-2032)
Figure 37. South America Baking Mix and Enzymes Revenue (USD Million) By Type (2021-2032)
Figure 38. South America Baking Mix and Enzymes Revenue (USD Million) By Application (2021-2032)
Figure 39. South America Baking Mix and Enzymes Revenue (USD Million) By Product (2021-2032)
Figure 40. Middle East and Africa Baking Mix and Enzymes Revenue (USD Million) By Type (2021-2032)
Figure 41. Middle East and Africa Baking Mix and Enzymes Revenue (USD Million) By Application (2021-2032)
Figure 42. Middle East and Africa Baking Mix and Enzymes Revenue (USD Million) By Product (2021-2032)
By Type
Enzymes
Baking Mix
By Application
Bread
Cookies & Biscuits
Rolls & Pies
Cakes & Pastries
Others
Countries Analyzed
North America (US, Canada, Mexico)
Europe (Germany, UK, France, Spain, Italy, Russia, Rest of Europe)
Asia Pacific (China, India, Japan, South Korea, Australia, South East Asia, Rest of Asia)
South America (Brazil, Argentina, Rest of South America)
Middle East and Africa (Saudi Arabia, UAE, Rest of Middle East, South Africa, Egypt, Rest of Africa)
