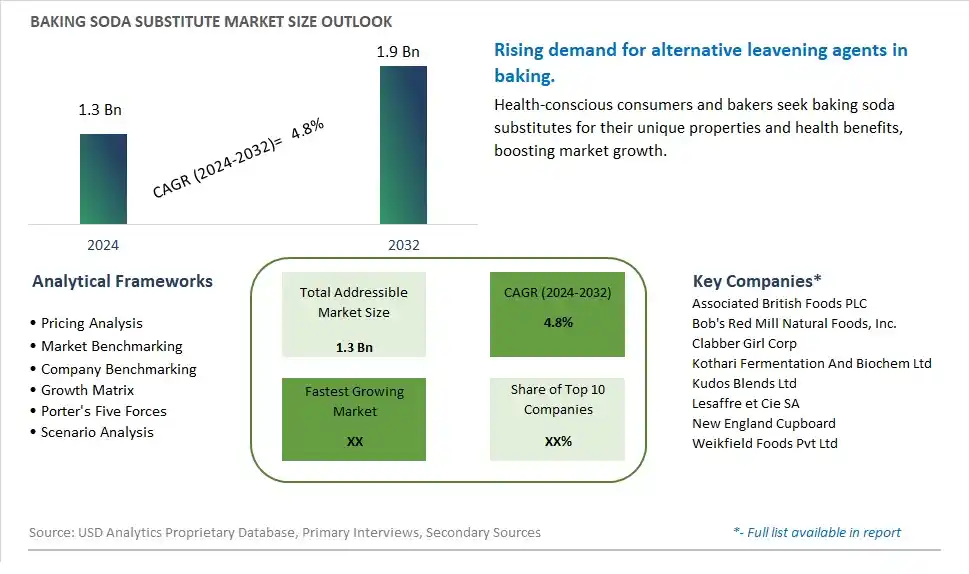
Global Baking Soda Substitute Market Size is valued at $1.3 Billion in 2024 and is forecast to register a growth rate (CAGR) of 4.8% to reach $1.9 Billion by 2032.
The global Baking Soda Substitute Market Comprehensive Study analyzes and forecasts the market size across 6 regions and 24 countries for diverse segments -By Product (Baking powder, Potassium Bicarbonate, Yeast, Others), By Distribution Channel (On-Trade, Off-Trade, -Supermarkets/Hypermarkets, -Convenience Stores, -Online Retailers, -Others)
An Introduction to Baking Soda Substitute Market
In 2024, the Baking Soda Substitute market is witnessing significant growth, driven by the increasing demand for alternative leavening agents in baking. Baking soda substitutes, which include products such as potassium bicarbonate and baking powder blends, are used by consumers seeking low-sodium or allergy-friendly options. The market is supported by the growing awareness of health and dietary concerns, including sodium reduction and gluten-free diets. Advances in food science and formulation are improving the effectiveness and versatility of baking soda substitutes. The market is also benefiting from the trend towards clean-label and natural baking ingredients, appealing to health-conscious and environmentally aware consumers.
Baking Soda Substitute Competitive Landscape
The market report analyses the leading companies in the industry including Associated British Foods PLC, Bob's Red Mill Natural Foods, Inc., Clabber Girl Corp, Kothari Fermentation And Biochem Ltd, Kudos Blends Ltd, Lesaffre et Cie SA, New England Cupboard, Weikfield Foods Pvt Ltd, and Others.
Baking Soda Substitute Market Dynamics
Baking Soda Substitute Market Trend: Growing Demand for Healthier Baking Alternatives
The most prominent market trend for Baking Soda Substitute is the growing demand for healthier baking alternatives. Consumers are increasingly seeking substitutes for traditional baking soda that offer reduced sodium content, natural ingredients, and additional health benefits. There's a rising interest in alternatives such as potassium bicarbonate, cream of tartar, or baking powder blends formulated with healthier ingredients, aligning with consumer preferences for clean label products and healthier lifestyle choices. This trend reflects a broader shift towards health-conscious baking practices and ingredient transparency in baked goods.
Baking Soda Substitute Market Driver: Health and Wellness Focus in Baking Industry
A key market driver for Baking Soda Substitute is the health and wellness focus in the baking industry. As consumers become more aware of the impact of ingredients on their health, there's a heightened demand for baking substitutes that offer nutritional advantages, such as lower sodium intake, improved digestion, or allergen-free formulations. Manufacturers are responding to this driver by developing innovative baking soda alternatives that address specific health concerns and dietary restrictions, driving product innovation and market growth in the baking soda substitute segment.
Baking Soda Substitute Market Opportunity: Development of Functional and Flavor-Enhancing Substitutes
A potential opportunity within the Baking Soda Substitute market lies in the development of functional and flavor-enhancing substitutes. Collaborating with food scientists and nutrition experts can lead to the creation of substitutes enriched with functional ingredients, such as fiber, vitamins, or probiotics, offering additional health benefits beyond traditional baking soda. Additionally, exploring flavor-enhancing substitutes that add unique taste profiles, such as citrus zest, herbal infusions, or natural extracts, can create differentiation and appeal to consumers seeking novel baking experiences. By focusing on functional and flavor-enhancing innovations, there are opportunities to capture market share, meet diverse consumer needs, and drive value in the baking soda substitute market.
Baking Soda Substitute Market Share Analysis: Baking Powder segment generated the highest revenue share in the industry
The Baking Powder segment emerges as the largest and steadily growing segment within the Baking Soda Substitute Market. Baking powder, a leavening agent used in baking, serves as a substitute for baking soda in recipes that require a rising agent without the need for acidic ingredients. Its dominance is driven by several factors, including its versatility in various baking applications, its convenience as a ready-to-use substitute, and its ability to produce light and fluffy baked goods. Baking powder is preferred by bakers and home cooks for its consistent performance and reliable results, making it a staple ingredient in kitchens worldwide. Further, with the growing trend of homemade baking and the demand for convenient baking solutions, the Baking Powder segment is expected to maintain its market leadership and witness steady growth as consumers continue to explore baking as a hobby and seek high-quality ingredients for their culinary creations.
Baking Soda Substitute Market Share Analysis: Online Retailers is the fastest growing segment over the forecast period to 2032
The Online Retailers distribution channel is anticipated to experience rapid expansion and promising growth in the Baking Soda Substitute Market leading up to 2032. This segment focuses on the sale and distribution of baking soda substitutes through online platforms and e-commerce channels. The fast growth of this channel is attributed to several factors, including the increasing preference for online shopping, the convenience of doorstep delivery, and the wide availability of baking soda substitutes from various brands and suppliers. Online retailers offer consumers a convenient and hassle-free way to purchase baking essentials, including substitutes like baking powder, potassium bicarbonate, and yeast, catering to the needs of home bakers and cooking enthusiasts. Further, with advancements in digital technology, secure payment options, and the growing trust in online shopping, the Online Retailers distribution channel is poised to be a key driver of market growth and innovation in the Baking Soda Substitute Market, meeting the evolving preferences and shopping habits of consumers in the digital age.
Baking Soda Substitute Market Segmentation
By Product
Baking powder
Potassium Bicarbonate
Yeast
Others
By Distribution Channel
On-Trade
Off-Trade
-Supermarkets/Hypermarkets
-Convenience Stores
-Online Retailers
-Others
Countries Analyzed
North America (US, Canada, Mexico)
Europe (Germany, UK, France, Spain, Italy, Russia, Rest of Europe)
Asia Pacific (China, India, Japan, South Korea, Australia, South East Asia, Rest of Asia)
South America (Brazil, Argentina, Rest of South America)
Middle East and Africa (Saudi Arabia, UAE, Rest of Middle East, South Africa, Egypt, Rest of Africa)
Baking Soda Substitute Companies Profiled in the Study
Associated British Foods PLC
Bob's Red Mill Natural Foods, Inc.
Clabber Girl Corp
Kothari Fermentation And Biochem Ltd
Kudos Blends Ltd
Lesaffre et Cie SA
New England Cupboard
Weikfield Foods Pvt Ltd
*- List Not Exhaustive
Chapter 1. TABLE OF CONTENTS
Chapter 2. Introduction to Baking Soda Substitute Market
2.1. Market Overview
2.2. Key Statistics and Report Highlights
2.3. Scope of the Comprehensive Study
2.3.1. Market Definition
2.3.2 Countries and Regions Covered
2.3.3 Research Objective
2.3.4 Units, Currency, and Conversions
2.3.5 Industry Value Chain
2.4. Key Market Segments
2.5. Key Companies
2.6. Study Period
Chapter 3. Strategic Analysis Review
3.1. Baking Soda Substitute Pricing Analysis and Forecast
3.2. Porter’s Five Forces
3.3. Market Ecosystem
3.4. SWOT Analysis
3.5. Regulatory Scenario
3.3. Effects of Inflation, Russia-Ukraine War, moderating economic growth, and other macroeconomic factors
Chapter 4. Competitive Landscape
4.1. Market Share Analysis
4.1.1. Global Baking Soda Substitute Market Share by Company, 2023
4.1.2. Product Offerings of Leading Baking Soda Substitute Companies
4.2. Market Entropy
4.2.1. New Product Launches in the Industry
4.2.2. Mergers, Acquisitions, Joint ventures, and Partnerships
4.3. Key Strategies and Best Practices
Chapter 5. Global Market Projections: Best, Reference, and Low Case Scenarios
5.1. Growth Analysis- Case Scenario Definitions
5.2. Low Growth Case Scenario Forecasts
5.3. Reference Growth Case Scenario Forecasts
5.4. High Growth Case Scenario Forecasts
Chapter 6. Market Dynamics
6.1. Baking Soda Substitute Market Drivers
6.2. Baking Soda Substitute Market Challenges
6.6. Baking Soda Substitute Market Opportunities
6.4. Baking Soda Substitute Market Trends
Chapter 7. Global Baking Soda Substitute Market Outlook Trends
7.1. Global Baking Soda Substitute Revenue (USD Million) and CAGR (%) by Type (2021-2032)
7.2. Global Baking Soda Substitute Revenue (USD Million) and CAGR (%) by Application (2021-2032)
7.3. Global Baking Soda Substitute Revenue (USD Million) and CAGR (%) by Product (2021-2032)
By Product
Baking powder
Potassium Bicarbonate
Yeast
Others
By Distribution Channel
On-Trade
Off-Trade
-Supermarkets/Hypermarkets
-Convenience Stores
-Online Retailers
-Others
Chapter 8. Global Baking Soda Substitute Regional Analysis and Outlook
8.1. Global Baking Soda Substitute Revenue (USD Million) By Regions (2021- 2032)
8.2. North America Baking Soda Substitute Revenue (USD Million) by Country (2021-2032)
8.2.1. United States Baking Soda Substitute Regional Analysis and Outlook
8.2.2. Canada Baking Soda Substitute Regional Analysis and Outlook
8.2.3. Mexico Baking Soda Substitute Regional Analysis and Outlook
8.3. Europe Baking Soda Substitute Revenue (USD Million), by Country (2021-2032)
8.3.1. Germany Baking Soda Substitute Regional Analysis and Outlook
8.3.2. France Baking Soda Substitute Regional Analysis and Outlook
8.3.3. United Kingdom Baking Soda Substitute Regional Analysis and Outlook
8.3.4. Spain Baking Soda Substitute Regional Analysis and Outlook
8.3.5. Italy Baking Soda Substitute Regional Analysis and Outlook
8.3.6. Russia Baking Soda Substitute Regional Analysis and Outlook
8.3.7. Rest of Europe Baking Soda Substitute Regional Analysis and Outlook
8.4. Asia Pacific Baking Soda Substitute Revenue (USD Million) by Country (2021-2032)
8.4.1. China Baking Soda Substitute Regional Analysis and Outlook
8.4.2. Japan Baking Soda Substitute Regional Analysis and Outlook
8.4.3. India Baking Soda Substitute Regional Analysis and Outlook
8.4.4. South Korea Baking Soda Substitute Regional Analysis and Outlook
8.4.5. Australia Baking Soda Substitute Regional Analysis and Outlook
8.4.6. South East Asia Baking Soda Substitute Regional Analysis and Outlook
8.4.7. Rest of Asia Pacific Baking Soda Substitute Regional Analysis and Outlook
8.5. South America Baking Soda Substitute Revenue (USD Million), by Country (2021-2032)
8.5.1. Brazil Baking Soda Substitute Regional Analysis and Outlook
8.5.2. Argentina Baking Soda Substitute Regional Analysis and Outlook
8.5.3. Rest of South America Baking Soda Substitute Regional Analysis and Outlook
8.6. Middle East and Africa Baking Soda Substitute Revenue (USD Million) by Country (2021-2032)
8.6.1. Middle East Baking Soda Substitute Regional Analysis and Outlook
8.6.2. Africa Baking Soda Substitute Regional Analysis and Outlook
Chapter 9. North America Baking Soda Substitute Analysis and Outlook
9.1. North America Baking Soda Substitute Revenue (USD Million) by Segments (2021-2032)
9.1.1. North America Baking Soda Substitute Revenue (USD Million) by Type (2021-2032)
9.1.2. North America Baking Soda Substitute Revenue (USD Million) by Application (2021-2032)
9.1.3. North America Baking Soda Substitute Revenue (USD Million) by Product (2021-2032)
By Product
Baking powder
Potassium Bicarbonate
Yeast
Others
By Distribution Channel
On-Trade
Off-Trade
-Supermarkets/Hypermarkets
-Convenience Stores
-Online Retailers
-Others
Chapter 10. Europe Baking Soda Substitute Analysis and Outlook
10.1. Europe Baking Soda Substitute Revenue (USD Million), by Segments (USD Million) (2021-2032)
10.1.1. Europe Baking Soda Substitute Revenue (USD Million) by Type (2021-2032)
10.1.2. Europe Baking Soda Substitute Revenue (USD Million) by Application (2021-2032)
10.1.3. Europe Baking Soda Substitute Revenue (USD Million) by Product (2021-2032)
By Product
Baking powder
Potassium Bicarbonate
Yeast
Others
By Distribution Channel
On-Trade
Off-Trade
-Supermarkets/Hypermarkets
-Convenience Stores
-Online Retailers
-Others
Chapter 11. Asia Pacific Baking Soda Substitute Analysis and Outlook
11.1. Asia Pacific Baking Soda Substitute Revenue (USD Million), and Revenue (USD Million) by Segments (2021-2032)
11.1.1. Asia Pacific Baking Soda Substitute Revenue (USD Million) by Type (2021-2032)
11.1.2. Asia Pacific Baking Soda Substitute Revenue (USD Million) by Application (2021-2032)
11.1.3. Asia Pacific Baking Soda Substitute Revenue (USD Million) by Product (2021-2032)
By Product
Baking powder
Potassium Bicarbonate
Yeast
Others
By Distribution Channel
On-Trade
Off-Trade
-Supermarkets/Hypermarkets
-Convenience Stores
-Online Retailers
-Others
Chapter 12. South America Baking Soda Substitute Analysis and Outlook
12.1. South America Baking Soda Substitute Revenue (USD Million), by Segments (2021-2032)
12.1.1. South America Baking Soda Substitute Revenue (USD Million) by Type (2021-2032)
12.1.2. South America Baking Soda Substitute Revenue (USD Million) by Application (2021-2032)
12.1.3. South America Baking Soda Substitute Revenue (USD Million) by Product (2021-2032)
By Product
Baking powder
Potassium Bicarbonate
Yeast
Others
By Distribution Channel
On-Trade
Off-Trade
-Supermarkets/Hypermarkets
-Convenience Stores
-Online Retailers
-Others
Chapter 13. Middle East and Africa Baking Soda Substitute Analysis and Outlook
13.1. Middle East and Africa Baking Soda Substitute Revenue (USD Million), by Segments (2021-2032)
13.1.1. Middle East and Africa Baking Soda Substitute Revenue (USD Million) by Type (2021-2032)
13.1.2. Middle East and Africa Baking Soda Substitute Revenue (USD Million) by Application (2021-2032)
13.1.3. Middle East and Africa Baking Soda Substitute Revenue (USD Million) by Product (2021-2032)
By Product
Baking powder
Potassium Bicarbonate
Yeast
Others
By Distribution Channel
On-Trade
Off-Trade
-Supermarkets/Hypermarkets
-Convenience Stores
-Online Retailers
-Others
Chapter 14. Baking Soda Substitute Company Profiles
14.1 Business Overview
14.2 Product Profiles
14.3 SWOT Profiles
14.5 Recent Developments
14.6 Financial Profile
List of Companies
Associated British Foods PLC
Bob's Red Mill Natural Foods, Inc.
Clabber Girl Corp
Kothari Fermentation And Biochem Ltd
Kudos Blends Ltd
Lesaffre et Cie SA
New England Cupboard
Weikfield Foods Pvt Ltd
15. Methodology and Data Sources
15.1 Customization Offerings
15.2 Subscription Services
15.3 Related Reports
15.4 Publisher Expertise
LIST OF TABLES
Table 1 Market Segmentation Analysis
Table 2 Global Baking Soda Substitute Market Share of Leading Companies, 2023
Table 3 Product Offerings of Leading Companies
Table 4 Low Growth Scenario Forecasts
Table 5 Reference Case Growth Scenario
Table 6 High Growth Case Scenario
Table 7 Global Baking Soda Substitute Revenue (USD Million) And CAGR (%) By Type (2021-2032)
Table 8 Global Baking Soda Substitute Revenue (USD Million) And CAGR (%) By Application (2021-2032)
Table 9 Global Baking Soda Substitute Revenue (USD Million) And CAGR (%) By Product (2021-2032)
Table 10 Global Baking Soda Substitute Market Revenue (USD Million) By Regions (2021-2032)
Table 11 Global Baking Soda Substitute Market Share (%) By Regions (2021-2032)
Table 12 North America Baking Soda Substitute Revenue (USD Million) By Country (2021-2032)
Table 13 Europe Baking Soda Substitute Revenue (USD Million) By Country (2021-2032)
Table 14 Asia Pacific Baking Soda Substitute Revenue (USD Million) By Country (2021-2032)
Table 15 South America Baking Soda Substitute Revenue (USD Million) By Country (2021-2032)
Table 16 Middle East and Africa Baking Soda Substitute Revenue (USD Million) By Region (2021-2032)
Table 17 North America Baking Soda Substitute Revenue (USD Million) By Type (2021-2032)
Table 18 North America Baking Soda Substitute Revenue (USD Million) By Application (2021-2032)
Table 19 North America Baking Soda Substitute Revenue (USD Million) By Product (2021-2032)
Table 20 Europe Baking Soda Substitute Revenue (USD Million) By Type (2021-2032)
Table 21 Europe Baking Soda Substitute Revenue (USD Million) By Application (2021-2032)
Table 22 Europe Baking Soda Substitute Revenue (USD Million) By Product (2021-2032)
Table 23 Asia Pacific Baking Soda Substitute Revenue (USD Million) By Type (2021-2032)
Table 24 Asia Pacific Baking Soda Substitute Revenue (USD Million) By Application (2021-2032)
Table 25 Asia Pacific Baking Soda Substitute Revenue (USD Million) By Product (2021-2032)
Table 26 South America Baking Soda Substitute Revenue (USD Million) By Type (2021-2032)
Table 27 South America Baking Soda Substitute Revenue (USD Million) By Application (2021-2032)
Table 28 South America Baking Soda Substitute Revenue (USD Million) By Product (2021-2032)
Table 29 Middle East and Africa Baking Soda Substitute Revenue (USD Million) By Type (2021-2032)
Table 30 Middle East and Africa Baking Soda Substitute Revenue (USD Million) By Application (2021-2032)
Table 31 Middle East and Africa Baking Soda Substitute Revenue (USD Million) By Product (2021-2032)
LIST OF FIGURES
Figure 1. Market Scope
Figure 2. Pricing Forecasts Per Unit, 2023- 2032
Figure 3. Porter’s Five Forces
Figure 4. Global Baking Soda Substitute Market Revenue (USD Million) By Regions (2021-2032)
Figure 5. Global Baking Soda Substitute Market Share (%) By Regions (2023)
Figure 6. North America Baking Soda Substitute Revenue (USD Million) By Country (2021-2032)
Figure 7. United States Baking Soda Substitute Revenue (USD Million) By Country (2021-2032)
Figure 8. Canada Baking Soda Substitute Revenue (USD Million) By Country (2021-2032)
Figure 9. Mexico Baking Soda Substitute Revenue (USD Million) By Country (2021-2032)
Figure 10. Europe Baking Soda Substitute Revenue (USD Million) By Country (2021-2032)
Figure 11. Germany Baking Soda Substitute Revenue (USD Million) By Country (2021-2032)
Figure 12. France Baking Soda Substitute Revenue (USD Million) By Country (2021-2032)
Figure 13. United Kingdom Baking Soda Substitute Revenue (USD Million) By Country (2021-2032)
Figure 14. Spain Baking Soda Substitute Revenue (USD Million) By Country (2021-2032)
Figure 15. Italy Baking Soda Substitute Revenue (USD Million) By Country (2021-2032)
Figure 16. Russia Baking Soda Substitute Revenue (USD Million) By Country (2021-2032)
Figure 17. Rest of Europe Baking Soda Substitute Revenue (USD Million) By Country (2021-2032)
Figure 11. Asia Pacific Baking Soda Substitute Revenue (USD Million) By Country (2021-2032)
Figure 12. China Baking Soda Substitute Revenue (USD Million) By Country (2021-2032)
Figure 13. Japan Baking Soda Substitute Revenue (USD Million) By Country (2021-2032)
Figure 14. India Baking Soda Substitute Revenue (USD Million) By Country (2021-2032)
Figure 15. South Korea Baking Soda Substitute Revenue (USD Million) By Country (2021-2032)
Figure 16. Australia Baking Soda Substitute Revenue (USD Million) By Country (2021-2032)
Figure 17. South East Asia Baking Soda Substitute Revenue (USD Million) By Country (2021-2032)
Figure 18. South America Baking Soda Substitute Revenue (USD Million) By Country (2021-2032)
Figure 19. Brazil Baking Soda Substitute Revenue (USD Million) By Country (2021-2032)
Figure 20. Argentina Baking Soda Substitute Revenue (USD Million) By Country (2021-2032)
Figure 21. Rest of Asia Pacific Baking Soda Substitute Revenue (USD Million) By Country (2021-2032)
Figure 22. Middle East and Africa Baking Soda Substitute Revenue (USD Million) By Region (2021-2032)
Figure 23. Saudi Arabia Baking Soda Substitute Revenue (USD Million) By Region (2021-2032)
Figure 24. The UAE Baking Soda Substitute Revenue (USD Million) By Region (2021-2032)
Figure 25. Rest of Middle East Baking Soda Substitute Revenue (USD Million) By Region (2021-2032)
Figure 26. South Africa Baking Soda Substitute Revenue (USD Million) By Region (2021-2032)
Figure 27. Africa Baking Soda Substitute Revenue (USD Million) By Region (2021-2032)
Figure 28. North America Baking Soda Substitute Revenue (USD Million) By Type (2021-2032)
Figure 29. North America Baking Soda Substitute Revenue (USD Million) By Application (2021-2032)
Figure 30. North America Baking Soda Substitute Revenue (USD Million) By Product (2021-2032)
Figure 31. Europe Baking Soda Substitute Revenue (USD Million) By Type (2021-2032)
Figure 32. Europe Baking Soda Substitute Revenue (USD Million) By Application (2021-2032)
Figure 33. Europe Baking Soda Substitute Revenue (USD Million) By Product (2021-2032)
Figure 34. Asia Pacific Baking Soda Substitute Revenue (USD Million) By Type (2021-2032)
Figure 35. Asia Pacific Baking Soda Substitute Revenue (USD Million) By Application (2021-2032)
Figure 36. Asia Pacific Baking Soda Substitute Revenue (USD Million) By Product (2021-2032)
Figure 37. South America Baking Soda Substitute Revenue (USD Million) By Type (2021-2032)
Figure 38. South America Baking Soda Substitute Revenue (USD Million) By Application (2021-2032)
Figure 39. South America Baking Soda Substitute Revenue (USD Million) By Product (2021-2032)
Figure 40. Middle East and Africa Baking Soda Substitute Revenue (USD Million) By Type (2021-2032)
Figure 41. Middle East and Africa Baking Soda Substitute Revenue (USD Million) By Application (2021-2032)
Figure 42. Middle East and Africa Baking Soda Substitute Revenue (USD Million) By Product (2021-2032)
By Product
Baking powder
Potassium Bicarbonate
Yeast
Others
By Distribution Channel
On-Trade
Off-Trade
-Supermarkets/Hypermarkets
-Convenience Stores
-Online Retailers
-Others
Countries Analyzed
North America (US, Canada, Mexico)
Europe (Germany, UK, France, Spain, Italy, Russia, Rest of Europe)
Asia Pacific (China, India, Japan, South Korea, Australia, South East Asia, Rest of Asia)
South America (Brazil, Argentina, Rest of South America)
Middle East and Africa (Saudi Arabia, UAE, Rest of Middle East, South Africa, Egypt, Rest of Africa)
