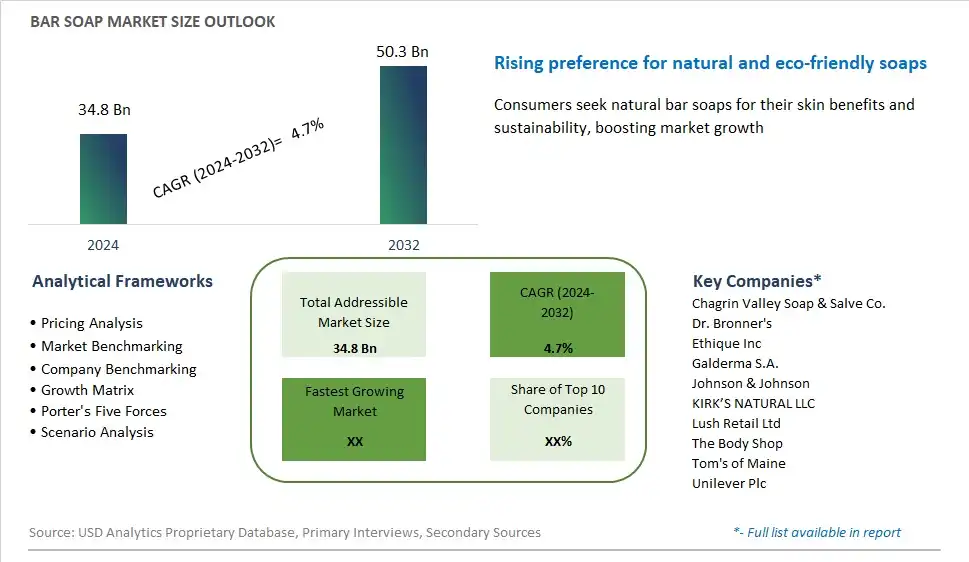
Global Bar Soap Market Size is valued at $34.8 Billion in 2024 and is forecast to register a growth rate (CAGR) of 4.7% to reach $50.3 Billion by 2032.
The global Bar Soap Market Comprehensive Study analyzes and forecasts the market size across 6 regions and 24 countries for diverse segments -By Type (Organic, Synthetic), By Application (Hair Care, Skin/Body Care, Facial Care, Specialized), By Distribution Channel (Supermarkets/Hypermarkets, Convenience Stores, Specialty Stores, Online Retailers, Others)
An Introduction to Bar Soap Market
In 2024, the bar soap market remains a staple of personal care routines, offering consumers a classic, effective, and environmentally friendly option for cleansing and moisturizing the skin. Bar soap continues to appeal to consumers for its convenience, affordability, and long-lasting nature compared to liquid alternatives. Moreover, bar soaps are valued for their versatility, with formulations available to suit various skin types and concerns, from sensitive and dry to oily and acne-prone. Brands are responding to consumer preferences for natural and sustainable ingredients, incorporating botanical extracts, essential oils, and nourishing oils into their formulations. Furthermore, there is a growing demand for bar soaps that are free from harsh chemicals, synthetic fragrances, and artificial additives, aligning with consumer values of health and wellness. Sustainable packaging initiatives, such as plastic-free options and compostable wrappers, are gaining traction, reflecting increasing awareness of environmental sustainability among consumers. With its enduring appeal and adaptability, the bar soap market continues to evolve to meet the changing needs and preferences of consumers seeking effective, eco-friendly, and skin-friendly cleansing solutions.
Bar Soap Competitive Landscape
The market report analyses the leading companies in the industry including Chagrin Valley Soap & Salve Co., Dr. Bronner's, Ethique Inc, Galderma S.A., Johnson & Johnson, KIRK’S NATURAL LLC, Lush Retail Ltd, The Body Shop, Tom's of Maine, Unilever Plc, and Others.
Bar Soap Market Dynamics
Bar Soap Market Trend: Shifting Consumer Preferences towards Natural and Sustainable Products
Consumers are increasingly gravitating towards natural and sustainable products, and this trend is significantly impacting the bar soap market. As awareness of environmental issues and health concerns rises, there is a growing preference for bar soaps made from natural ingredients, free from harsh chemicals and additives. Manufacturers are responding by introducing organic, plant-based, and cruelty-free formulations to meet the demand for clean and eco-friendly skincare solutions. This trend is driving innovation in packaging, production processes, and ingredient sourcing to align with consumer values and preferences for sustainable living.
Market Driver: Rising Awareness of Personal Hygiene and Health
A key driver for the bar soap market is the rising awareness of personal hygiene and health. The global emphasis on cleanliness and sanitation, particularly in light of recent health crises, has underscored the importance of proper handwashing and skincare routines. Bar soaps are recognized for their effectiveness in cleansing and moisturizing the skin, making them essential products for daily hygiene rituals. Additionally, consumers are seeking products that offer antimicrobial properties and gentle formulations suitable for all skin types, further driving the demand for high-quality bar soaps.
Market Opportunity: Diversification and Innovation in Product Offerings
An opportunity for growth in the bar soap market lies in diversification and innovation in product offerings. Manufacturers can explore various avenues to differentiate their products and capture new market segments. This includes developing specialty bar soaps tailored to specific skin concerns, such as acne-prone, sensitive, or aging skin. Furthermore, there is potential for expanding into niche markets by introducing artisanal or handmade bar soaps crafted with unique ingredients and formulations. Additionally, leveraging technological advancements, such as incorporating natural fragrances, essential oils, and botanical extracts, can enhance the sensory experience and appeal of bar soaps to discerning consumers. By embracing innovation and addressing evolving consumer preferences, companies can unlock new opportunities for growth and success in the competitive bar soap market.
Bar Soap Market Share Analysis: Synthetic Bar Soap held the dominant market share in 2024
In the bar soap market, synthetic bar soap is the largest segment, primarily due to its widespread availability, affordability, and long-standing consumer trust. Synthetic bar soaps are formulated using traditional ingredients and manufacturing methods, making them accessible to a broad spectrum of consumers across various demographics and regions. Their popularity is further bolstered by their consistent quality, familiar scents, and effectiveness in cleansing and moisturizing the skin. Additionally, the lower production costs associated with synthetic formulations contribute to their affordability, making them a preferred choice for consumers seeking economical personal care products. Further, the established supply chain networks for synthetic bar soaps ensure their widespread distribution and availability in supermarkets, grocery stores, and online platforms. With their accessibility, affordability, and reliability, synthetic bar soaps maintain their stronghold as the largest segment in the bar soap market, meeting the diverse needs and preferences of consumers worldwide.
Bar Soap Market Share Analysis: Facial Care market is poised to register the fastest growth rae over the forecast period to 2032
Among the diverse applications in the bar soap market, facial care is the fastest-growing segment, driven by several key factors. Firstly, there is a growing consumer trend towards skincare routines focused on natural ingredients and simplicity, prompting an increased demand for gentle yet effective facial cleansing products like bar soaps. Facial bar soaps offer a convenient and fuss-free solution for daily skincare regimens, catering to consumers seeking products that are both effective and gentle on the skin. Secondly, the rise of social media and beauty influencers has heightened consumer awareness of skincare practices, leading to a greater emphasis on facial cleansing as a crucial step in achieving healthy and radiant skin. Thirdly, the versatility of facial bar soaps makes them suitable for various skin types and concerns, including sensitive, acne-prone, and aging skin, further driving their popularity among consumers seeking personalized skincare solutions. Further, the convenience and affordability of facial bar soaps compared to specialized skincare products contribute to their widespread adoption and growth in this segment. As a result, the facial care application segment is poised to continue its rapid expansion, capitalizing on the growing consumer demand for effective yet gentle facial cleansing products.
Bar Soap Market Share Analysis: Supermarkets/Hypermarkets held the dominant market share in 2024
In the bar soap market, supermarkets and hypermarkets emerge as the largest segment, primarily due to their extensive reach, diverse product offerings, and convenience for consumers. These retail giants serve as one-stop destinations for household essentials, including personal care products like bar soaps, catering to the needs of consumers across various demographics and regions. The dominance of supermarkets and hypermarkets is further reinforced by their strategic placement in high-traffic areas, ensuring maximum visibility and accessibility for consumers. Additionally, the wide aisles and organized displays in these stores facilitate easy navigation and comparison of products, enhancing the overall shopping experience for consumers. Further, the availability of promotional offers, discounts, and loyalty programs in supermarkets and hypermarkets incentivizes consumer purchases and drives sales in this segment. With their widespread presence, comprehensive product selection, and consumer-friendly shopping environment, supermarkets and hypermarkets maintain their stronghold as the largest distribution channel in the bar soap market, meeting the diverse needs and preferences of consumers.
Bar Soap Market Segmentation
By Type
Organic
Synthetic
By Application
Hair Care
Skin/Body Care
Facial Care
Specialized
By Distribution Channel
Supermarkets/Hypermarkets
Convenience Stores
Specialty Stores
Online Retailers
Others
Countries Analyzed
North America (US, Canada, Mexico)
Europe (Germany, UK, France, Spain, Italy, Russia, Rest of Europe)
Asia Pacific (China, India, Japan, South Korea, Australia, South East Asia, Rest of Asia)
South America (Brazil, Argentina, Rest of South America)
Middle East and Africa (Saudi Arabia, UAE, Rest of Middle East, South Africa, Egypt, Rest of Africa)
Bar Soap Companies Profiled in the Study
Chagrin Valley Soap & Salve Co.
Dr. Bronner's
Ethique Inc
Galderma S.A.
Johnson & Johnson
KIRK’S NATURAL LLC
Lush Retail Ltd
The Body Shop
Tom's of Maine
Unilever Plc
*- List Not Exhaustive
Chapter 1. TABLE OF CONTENTS
Chapter 2. Introduction to Bar Soap Market
2.1. Market Overview
2.2. Key Statistics and Report Highlights
2.3. Scope of the Comprehensive Study
2.3.1. Market Definition
2.3.2 Countries and Regions Covered
2.3.3 Research Objective
2.3.4 Units, Currency, and Conversions
2.3.5 Industry Value Chain
2.4. Key Market Segments
2.5. Key Companies
2.6. Study Period
Chapter 3. Strategic Analysis Review
3.1. Bar Soap Pricing Analysis and Forecast
3.2. Porter’s Five Forces
3.3. Market Ecosystem
3.4. SWOT Analysis
3.5. Regulatory Scenario
3.3. Effects of Inflation, Russia-Ukraine War, moderating economic growth, and other macroeconomic factors
Chapter 4. Competitive Landscape
4.1. Market Share Analysis
4.1.1. Global Bar Soap Market Share by Company, 2023
4.1.2. Product Offerings of Leading Bar Soap Companies
4.2. Market Entropy
4.2.1. New Product Launches in the Industry
4.2.2. Mergers, Acquisitions, Joint ventures, and Partnerships
4.3. Key Strategies and Best Practices
Chapter 5. Global Market Projections: Best, Reference, and Low Case Scenarios
5.1. Growth Analysis- Case Scenario Definitions
5.2. Low Growth Case Scenario Forecasts
5.3. Reference Growth Case Scenario Forecasts
5.4. High Growth Case Scenario Forecasts
Chapter 6. Market Dynamics
6.1. Bar Soap Market Drivers
6.2. Bar Soap Market Challenges
6.6. Bar Soap Market Opportunities
6.4. Bar Soap Market Trends
Chapter 7. Global Bar Soap Market Outlook Trends
7.1. Global Bar Soap Revenue (USD Million) and CAGR (%) by Type (2021-2032)
7.2. Global Bar Soap Revenue (USD Million) and CAGR (%) by Application (2021-2032)
7.3. Global Bar Soap Revenue (USD Million) and CAGR (%) by Product (2021-2032)
By Type
Organic
Synthetic
By Application
Hair Care
Skin/Body Care
Facial Care
Specialized
By Distribution Channel
Supermarkets/Hypermarkets
Convenience Stores
Specialty Stores
Online Retailers
Others
Chapter 8. Global Bar Soap Regional Analysis and Outlook
8.1. Global Bar Soap Revenue (USD Million) By Regions (2021- 2032)
8.2. North America Bar Soap Revenue (USD Million) by Country (2021-2032)
8.2.1. United States Bar Soap Regional Analysis and Outlook
8.2.2. Canada Bar Soap Regional Analysis and Outlook
8.2.3. Mexico Bar Soap Regional Analysis and Outlook
8.3. Europe Bar Soap Revenue (USD Million), by Country (2021-2032)
8.3.1. Germany Bar Soap Regional Analysis and Outlook
8.3.2. France Bar Soap Regional Analysis and Outlook
8.3.3. United Kingdom Bar Soap Regional Analysis and Outlook
8.3.4. Spain Bar Soap Regional Analysis and Outlook
8.3.5. Italy Bar Soap Regional Analysis and Outlook
8.3.6. Russia Bar Soap Regional Analysis and Outlook
8.3.7. Rest of Europe Bar Soap Regional Analysis and Outlook
8.4. Asia Pacific Bar Soap Revenue (USD Million) by Country (2021-2032)
8.4.1. China Bar Soap Regional Analysis and Outlook
8.4.2. Japan Bar Soap Regional Analysis and Outlook
8.4.3. India Bar Soap Regional Analysis and Outlook
8.4.4. South Korea Bar Soap Regional Analysis and Outlook
8.4.5. Australia Bar Soap Regional Analysis and Outlook
8.4.6. South East Asia Bar Soap Regional Analysis and Outlook
8.4.7. Rest of Asia Pacific Bar Soap Regional Analysis and Outlook
8.5. South America Bar Soap Revenue (USD Million), by Country (2021-2032)
8.5.1. Brazil Bar Soap Regional Analysis and Outlook
8.5.2. Argentina Bar Soap Regional Analysis and Outlook
8.5.3. Rest of South America Bar Soap Regional Analysis and Outlook
8.6. Middle East and Africa Bar Soap Revenue (USD Million) by Country (2021-2032)
8.6.1. Middle East Bar Soap Regional Analysis and Outlook
8.6.2. Africa Bar Soap Regional Analysis and Outlook
Chapter 9. North America Bar Soap Analysis and Outlook
9.1. North America Bar Soap Revenue (USD Million) by Segments (2021-2032)
9.1.1. North America Bar Soap Revenue (USD Million) by Type (2021-2032)
9.1.2. North America Bar Soap Revenue (USD Million) by Application (2021-2032)
9.1.3. North America Bar Soap Revenue (USD Million) by Product (2021-2032)
By Type
Organic
Synthetic
By Application
Hair Care
Skin/Body Care
Facial Care
Specialized
By Distribution Channel
Supermarkets/Hypermarkets
Convenience Stores
Specialty Stores
Online Retailers
Others
Chapter 10. Europe Bar Soap Analysis and Outlook
10.1. Europe Bar Soap Revenue (USD Million), by Segments (USD Million) (2021-2032)
10.1.1. Europe Bar Soap Revenue (USD Million) by Type (2021-2032)
10.1.2. Europe Bar Soap Revenue (USD Million) by Application (2021-2032)
10.1.3. Europe Bar Soap Revenue (USD Million) by Product (2021-2032)
By Type
Organic
Synthetic
By Application
Hair Care
Skin/Body Care
Facial Care
Specialized
By Distribution Channel
Supermarkets/Hypermarkets
Convenience Stores
Specialty Stores
Online Retailers
Others
Chapter 11. Asia Pacific Bar Soap Analysis and Outlook
11.1. Asia Pacific Bar Soap Revenue (USD Million), and Revenue (USD Million) by Segments (2021-2032)
11.1.1. Asia Pacific Bar Soap Revenue (USD Million) by Type (2021-2032)
11.1.2. Asia Pacific Bar Soap Revenue (USD Million) by Application (2021-2032)
11.1.3. Asia Pacific Bar Soap Revenue (USD Million) by Product (2021-2032)
By Type
Organic
Synthetic
By Application
Hair Care
Skin/Body Care
Facial Care
Specialized
By Distribution Channel
Supermarkets/Hypermarkets
Convenience Stores
Specialty Stores
Online Retailers
Others
Chapter 12. South America Bar Soap Analysis and Outlook
12.1. South America Bar Soap Revenue (USD Million), by Segments (2021-2032)
12.1.1. South America Bar Soap Revenue (USD Million) by Type (2021-2032)
12.1.2. South America Bar Soap Revenue (USD Million) by Application (2021-2032)
12.1.3. South America Bar Soap Revenue (USD Million) by Product (2021-2032)
By Type
Organic
Synthetic
By Application
Hair Care
Skin/Body Care
Facial Care
Specialized
By Distribution Channel
Supermarkets/Hypermarkets
Convenience Stores
Specialty Stores
Online Retailers
Others
Chapter 13. Middle East and Africa Bar Soap Analysis and Outlook
13.1. Middle East and Africa Bar Soap Revenue (USD Million), by Segments (2021-2032)
13.1.1. Middle East and Africa Bar Soap Revenue (USD Million) by Type (2021-2032)
13.1.2. Middle East and Africa Bar Soap Revenue (USD Million) by Application (2021-2032)
13.1.3. Middle East and Africa Bar Soap Revenue (USD Million) by Product (2021-2032)
By Type
Organic
Synthetic
By Application
Hair Care
Skin/Body Care
Facial Care
Specialized
By Distribution Channel
Supermarkets/Hypermarkets
Convenience Stores
Specialty Stores
Online Retailers
Others
Chapter 14. Bar Soap Company Profiles
14.1 Business Overview
14.2 Product Profiles
14.3 SWOT Profiles
14.5 Recent Developments
14.6 Financial Profile
List of Companies
Chagrin Valley Soap & Salve Co.
Dr. Bronner's
Ethique Inc
Galderma S.A.
Johnson & Johnson
KIRK’S NATURAL LLC
Lush Retail Ltd
The Body Shop
Tom's of Maine
Unilever Plc
15. Methodology and Data Sources
15.1 Customization Offerings
15.2 Subscription Services
15.3 Related Reports
15.4 Publisher Expertise
LIST OF TABLES
Table 1 Market Segmentation Analysis
Table 2 Global Bar Soap Market Share of Leading Companies, 2023
Table 3 Product Offerings of Leading Companies
Table 4 Low Growth Scenario Forecasts
Table 5 Reference Case Growth Scenario
Table 6 High Growth Case Scenario
Table 7 Global Bar Soap Revenue (USD Million) And CAGR (%) By Type (2021-2032)
Table 8 Global Bar Soap Revenue (USD Million) And CAGR (%) By Application (2021-2032)
Table 9 Global Bar Soap Revenue (USD Million) And CAGR (%) By Product (2021-2032)
Table 10 Global Bar Soap Market Revenue (USD Million) By Regions (2021-2032)
Table 11 Global Bar Soap Market Share (%) By Regions (2021-2032)
Table 12 North America Bar Soap Revenue (USD Million) By Country (2021-2032)
Table 13 Europe Bar Soap Revenue (USD Million) By Country (2021-2032)
Table 14 Asia Pacific Bar Soap Revenue (USD Million) By Country (2021-2032)
Table 15 South America Bar Soap Revenue (USD Million) By Country (2021-2032)
Table 16 Middle East and Africa Bar Soap Revenue (USD Million) By Region (2021-2032)
Table 17 North America Bar Soap Revenue (USD Million) By Type (2021-2032)
Table 18 North America Bar Soap Revenue (USD Million) By Application (2021-2032)
Table 19 North America Bar Soap Revenue (USD Million) By Product (2021-2032)
Table 20 Europe Bar Soap Revenue (USD Million) By Type (2021-2032)
Table 21 Europe Bar Soap Revenue (USD Million) By Application (2021-2032)
Table 22 Europe Bar Soap Revenue (USD Million) By Product (2021-2032)
Table 23 Asia Pacific Bar Soap Revenue (USD Million) By Type (2021-2032)
Table 24 Asia Pacific Bar Soap Revenue (USD Million) By Application (2021-2032)
Table 25 Asia Pacific Bar Soap Revenue (USD Million) By Product (2021-2032)
Table 26 South America Bar Soap Revenue (USD Million) By Type (2021-2032)
Table 27 South America Bar Soap Revenue (USD Million) By Application (2021-2032)
Table 28 South America Bar Soap Revenue (USD Million) By Product (2021-2032)
Table 29 Middle East and Africa Bar Soap Revenue (USD Million) By Type (2021-2032)
Table 30 Middle East and Africa Bar Soap Revenue (USD Million) By Application (2021-2032)
Table 31 Middle East and Africa Bar Soap Revenue (USD Million) By Product (2021-2032)
LIST OF FIGURES
Figure 1. Market Scope
Figure 2. Pricing Forecasts Per Unit, 2023- 2032
Figure 3. Porter’s Five Forces
Figure 4. Global Bar Soap Market Revenue (USD Million) By Regions (2021-2032)
Figure 5. Global Bar Soap Market Share (%) By Regions (2023)
Figure 6. North America Bar Soap Revenue (USD Million) By Country (2021-2032)
Figure 7. United States Bar Soap Revenue (USD Million) By Country (2021-2032)
Figure 8. Canada Bar Soap Revenue (USD Million) By Country (2021-2032)
Figure 9. Mexico Bar Soap Revenue (USD Million) By Country (2021-2032)
Figure 10. Europe Bar Soap Revenue (USD Million) By Country (2021-2032)
Figure 11. Germany Bar Soap Revenue (USD Million) By Country (2021-2032)
Figure 12. France Bar Soap Revenue (USD Million) By Country (2021-2032)
Figure 13. United Kingdom Bar Soap Revenue (USD Million) By Country (2021-2032)
Figure 14. Spain Bar Soap Revenue (USD Million) By Country (2021-2032)
Figure 15. Italy Bar Soap Revenue (USD Million) By Country (2021-2032)
Figure 16. Russia Bar Soap Revenue (USD Million) By Country (2021-2032)
Figure 17. Rest of Europe Bar Soap Revenue (USD Million) By Country (2021-2032)
Figure 11. Asia Pacific Bar Soap Revenue (USD Million) By Country (2021-2032)
Figure 12. China Bar Soap Revenue (USD Million) By Country (2021-2032)
Figure 13. Japan Bar Soap Revenue (USD Million) By Country (2021-2032)
Figure 14. India Bar Soap Revenue (USD Million) By Country (2021-2032)
Figure 15. South Korea Bar Soap Revenue (USD Million) By Country (2021-2032)
Figure 16. Australia Bar Soap Revenue (USD Million) By Country (2021-2032)
Figure 17. South East Asia Bar Soap Revenue (USD Million) By Country (2021-2032)
Figure 18. South America Bar Soap Revenue (USD Million) By Country (2021-2032)
Figure 19. Brazil Bar Soap Revenue (USD Million) By Country (2021-2032)
Figure 20. Argentina Bar Soap Revenue (USD Million) By Country (2021-2032)
Figure 21. Rest of Asia Pacific Bar Soap Revenue (USD Million) By Country (2021-2032)
Figure 22. Middle East and Africa Bar Soap Revenue (USD Million) By Region (2021-2032)
Figure 23. Saudi Arabia Bar Soap Revenue (USD Million) By Region (2021-2032)
Figure 24. The UAE Bar Soap Revenue (USD Million) By Region (2021-2032)
Figure 25. Rest of Middle East Bar Soap Revenue (USD Million) By Region (2021-2032)
Figure 26. South Africa Bar Soap Revenue (USD Million) By Region (2021-2032)
Figure 27. Africa Bar Soap Revenue (USD Million) By Region (2021-2032)
Figure 28. North America Bar Soap Revenue (USD Million) By Type (2021-2032)
Figure 29. North America Bar Soap Revenue (USD Million) By Application (2021-2032)
Figure 30. North America Bar Soap Revenue (USD Million) By Product (2021-2032)
Figure 31. Europe Bar Soap Revenue (USD Million) By Type (2021-2032)
Figure 32. Europe Bar Soap Revenue (USD Million) By Application (2021-2032)
Figure 33. Europe Bar Soap Revenue (USD Million) By Product (2021-2032)
Figure 34. Asia Pacific Bar Soap Revenue (USD Million) By Type (2021-2032)
Figure 35. Asia Pacific Bar Soap Revenue (USD Million) By Application (2021-2032)
Figure 36. Asia Pacific Bar Soap Revenue (USD Million) By Product (2021-2032)
Figure 37. South America Bar Soap Revenue (USD Million) By Type (2021-2032)
Figure 38. South America Bar Soap Revenue (USD Million) By Application (2021-2032)
Figure 39. South America Bar Soap Revenue (USD Million) By Product (2021-2032)
Figure 40. Middle East and Africa Bar Soap Revenue (USD Million) By Type (2021-2032)
Figure 41. Middle East and Africa Bar Soap Revenue (USD Million) By Application (2021-2032)
Figure 42. Middle East and Africa Bar Soap Revenue (USD Million) By Product (2021-2032)
By Type
Organic
Synthetic
By Application
Hair Care
Skin/Body Care
Facial Care
Specialized
By Distribution Channel
Supermarkets/Hypermarkets
Convenience Stores
Specialty Stores
Online Retailers
Others
Countries Analyzed
North America (US, Canada, Mexico)
Europe (Germany, UK, France, Spain, Italy, Russia, Rest of Europe)
Asia Pacific (China, India, Japan, South Korea, Australia, South East Asia, Rest of Asia)
South America (Brazil, Argentina, Rest of South America)
Middle East and Africa (Saudi Arabia, UAE, Rest of Middle East, South Africa, Egypt, Rest of Africa)
