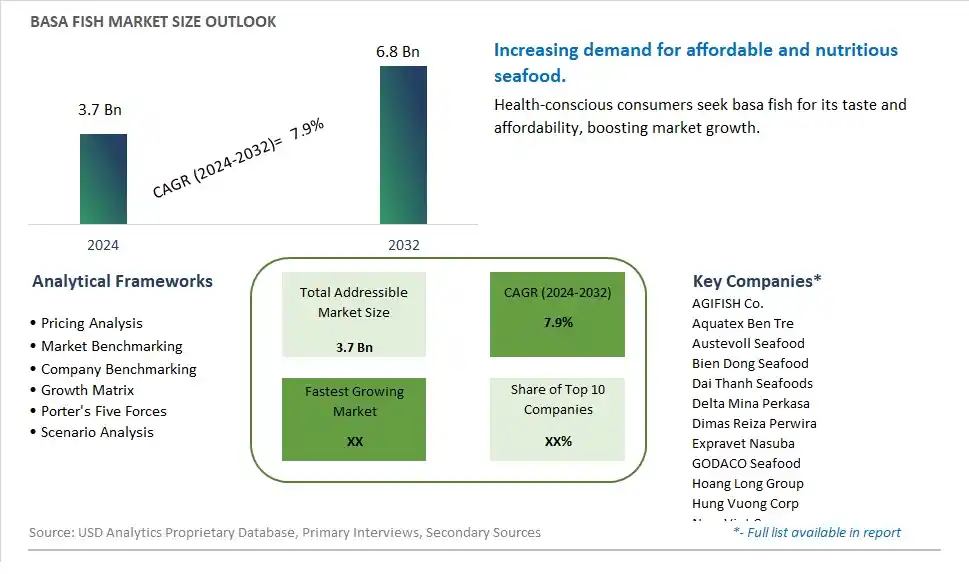
Global Basa Fish Market Size is valued at $3.7 Billion in 2024 and is forecast to register a growth rate (CAGR) of 7.9% to reach $6.8 Billion by 2032.
The global Basa Fish Market Comprehensive Study analyzes and forecasts the market size across 6 regions and 24 countries for diverse segments -By Type (Fresh Whole Fish, Frozen Whole Fish, Fresh Fillet, Frozen Fillet), By Application (Caterers, Food, Retail Customers, Hotels, Others)
An Introduction to Basa Fish Market
The Basa Fish market in 2024 is expanding steadily, driven by the increasing demand for affordable, versatile, and mild-flavored seafood. Basa fish, also known as Pangasius, is popular for its tender texture and neutral taste, making it suitable for various culinary applications. The market is supported by the growing consumer interest in healthy and protein-rich diets. Advances in aquaculture practices and sustainable farming methods are enhancing the quality and availability of basa fish. The market is also benefiting from the trend towards convenient and ready-to-cook seafood products, appealing to busy consumers seeking nutritious meal options.
Basa Fish Competitive Landscape
The market report analyses the leading companies in the industry including AGIFISH Co., Aquatex Ben Tre, Austevoll Seafood, Bien Dong Seafood, Dai Thanh Seafoods, Delta Mina Perkasa, Dimas Reiza Perwira, Expravet Nasuba, GODACO Seafood, Hoang Long Group, Hung Vuong Corp, Nam Viet Corp, Nomad Foods, NTSF SEAFOODS, Thai Union, Truong Giang Fishery Holdings Corp, Vinh Foods, Vinh Hoan, and Others.
Basa Fish Market Dynamics
Basa Fish Market Trend: Increasing Demand for Sustainable and Affordable Seafood
The most prominent market trend for Basa Fish is the increasing demand for sustainable and affordable seafood options. With growing concerns about overfishing and environmental sustainability, consumers are seeking responsibly sourced seafood products. Basa fish, known for its mild flavor, affordability, and ease of cultivation, has gained popularity as a sustainable alternative to other whitefish species. This trend reflects a broader consumer preference for ethically sourced and environmentally friendly seafood choices, driving the demand for Basa fish in the seafood market.
Basa Fish Market Driver: Versatility and Wide Culinary Applications
A key market driver for Basa Fish is its versatility and suitability for a wide range of culinary applications. Basa fish fillets are prized for their mild and flaky texture, making them ideal for grilling, baking, frying, and pan-searing. Additionally, Basa fish can be used in various recipes, including fish tacos, stir-fries, curries, and sandwiches, appealing to diverse consumer tastes and preferences. The driver of versatility propels the adoption of Basa fish by restaurants, seafood processors, and home cooks seeking a versatile and cost-effective seafood option that delivers on taste and culinary flexibility.
Basa Fish Market Opportunity: Targeting Health-Conscious Consumers with Nutritional Benefits
A potential opportunity within the Basa Fish market lies in targeting health-conscious consumers by highlighting its nutritional benefits. Basa fish is low in calories, high in protein, and a good source of essential nutrients such as omega-3 fatty acids, vitamins, and minerals. Collaborating with nutritionists, dietitians, and health experts can lead to the promotion of Basa fish as a nutritious and wholesome seafood choice. For example, marketing campaigns can emphasize Basa fish's heart-healthy properties, its role in supporting brain function, and its contribution to a balanced diet. Exploring opportunities to position Basa fish as a healthy and nutritious protein source allows seafood retailers and suppliers to tap into the growing demand for health-focused food options and attract health-conscious consumers to the Basa fish market. By focusing on promoting the nutritional benefits of Basa fish, there are opportunities to create value-added products, educate consumers about its health advantages, and differentiate Basa fish from other seafood offerings in the market.
Basa Fish Market Share Analysis: Frozen Fillet segment generated the highest revenue share in the industry
The Frozen Fillet segment emerges as the largest and rapidly growing segment within the Basa Fish Market. Frozen fillets are processed cuts of basa fish that are flash-frozen to preserve their freshness, flavor, and nutritional value. This segment's market dominance is attributed to several factors, including the convenience and longer shelf life offered by frozen fillets, the ease of storage and transportation, and the increasing demand for convenient seafood options among consumers and foodservice establishments. Frozen basa fillets are widely used in various culinary applications, including grilling, baking, frying, and as ingredients in seafood dishes and sushi, due to their firm texture, mild flavor, and versatility in cooking. Further, with the globalization of food supply chains and the expansion of export markets, the Frozen Fillet segment is expected to continue its strong growth trajectory, catering to the evolving preferences of consumers and the increasing demand for high-quality seafood products worldwide.
Basa Fish Market Share Analysis: Retail Customers is the fastest growing segment over the forecast period to 2032
The Retail Customers segment is anticipated to experience rapid expansion and significant growth in the Basa Fish Market leading up to 2032. This segment focuses on the sale of basa fish products directly to consumers through retail outlets, supermarkets, and online platforms. The fast growth of this segment can be attributed to several factors, including the increasing consumer awareness of the health benefits of consuming seafood, the rising popularity of basa fish as an affordable and nutritious option, and the convenience of purchasing seafood products for home cooking. Retail customers are seeking convenient, ready-to-cook basa fish fillets and portions, contributing to the segment's growth. Further, with the growing trend of home cooking, healthy eating, and seafood consumption, the Retail Customers segment is expected to be a major driver of market growth and innovation in the Basa Fish Market, meeting the evolving preferences and demands of consumers seeking high-quality seafood products for their meals.
Basa Fish Market Segmentation
By Type
Fresh Whole Fish
Frozen Whole Fish
Fresh Fillet
Frozen Fillet
By Application
Caterers
Food
Retail Customers
Hotels
Others
Countries Analyzed
North America (US, Canada, Mexico)
Europe (Germany, UK, France, Spain, Italy, Russia, Rest of Europe)
Asia Pacific (China, India, Japan, South Korea, Australia, South East Asia, Rest of Asia)
South America (Brazil, Argentina, Rest of South America)
Middle East and Africa (Saudi Arabia, UAE, Rest of Middle East, South Africa, Egypt, Rest of Africa)
Basa Fish Companies Profiled in the Study
AGIFISH Co.
Aquatex Ben Tre
Austevoll Seafood
Bien Dong Seafood
Dai Thanh Seafoods
Delta Mina Perkasa
Dimas Reiza Perwira
Expravet Nasuba
GODACO Seafood
Hoang Long Group
Hung Vuong Corp
Nam Viet Corp
Nomad Foods
NTSF SEAFOODS
Thai Union
Truong Giang Fishery Holdings Corp
Vinh Foods
Vinh Hoan
*- List Not Exhaustive
Chapter 1. TABLE OF CONTENTS
Chapter 2. Introduction to Basa Fish Market
2.1. Market Overview
2.2. Key Statistics and Report Highlights
2.3. Scope of the Comprehensive Study
2.3.1. Market Definition
2.3.2 Countries and Regions Covered
2.3.3 Research Objective
2.3.4 Units, Currency, and Conversions
2.3.5 Industry Value Chain
2.4. Key Market Segments
2.5. Key Companies
2.6. Study Period
Chapter 3. Strategic Analysis Review
3.1. Basa Fish Pricing Analysis and Forecast
3.2. Porter’s Five Forces
3.3. Market Ecosystem
3.4. SWOT Analysis
3.5. Regulatory Scenario
3.3. Effects of Inflation, Russia-Ukraine War, moderating economic growth, and other macroeconomic factors
Chapter 4. Competitive Landscape
4.1. Market Share Analysis
4.1.1. Global Basa Fish Market Share by Company, 2023
4.1.2. Product Offerings of Leading Basa Fish Companies
4.2. Market Entropy
4.2.1. New Product Launches in the Industry
4.2.2. Mergers, Acquisitions, Joint ventures, and Partnerships
4.3. Key Strategies and Best Practices
Chapter 5. Global Market Projections: Best, Reference, and Low Case Scenarios
5.1. Growth Analysis- Case Scenario Definitions
5.2. Low Growth Case Scenario Forecasts
5.3. Reference Growth Case Scenario Forecasts
5.4. High Growth Case Scenario Forecasts
Chapter 6. Market Dynamics
6.1. Basa Fish Market Drivers
6.2. Basa Fish Market Challenges
6.6. Basa Fish Market Opportunities
6.4. Basa Fish Market Trends
Chapter 7. Global Basa Fish Market Outlook Trends
7.1. Global Basa Fish Revenue (USD Million) and CAGR (%) by Type (2021-2032)
7.2. Global Basa Fish Revenue (USD Million) and CAGR (%) by Application (2021-2032)
7.3. Global Basa Fish Revenue (USD Million) and CAGR (%) by Product (2021-2032)
By Type
Fresh Whole Fish
Frozen Whole Fish
Fresh Fillet
Frozen Fillet
By Application
Caterers
Food
Retail Customers
Hotels
Others
Chapter 8. Global Basa Fish Regional Analysis and Outlook
8.1. Global Basa Fish Revenue (USD Million) By Regions (2021- 2032)
8.2. North America Basa Fish Revenue (USD Million) by Country (2021-2032)
8.2.1. United States Basa Fish Regional Analysis and Outlook
8.2.2. Canada Basa Fish Regional Analysis and Outlook
8.2.3. Mexico Basa Fish Regional Analysis and Outlook
8.3. Europe Basa Fish Revenue (USD Million), by Country (2021-2032)
8.3.1. Germany Basa Fish Regional Analysis and Outlook
8.3.2. France Basa Fish Regional Analysis and Outlook
8.3.3. United Kingdom Basa Fish Regional Analysis and Outlook
8.3.4. Spain Basa Fish Regional Analysis and Outlook
8.3.5. Italy Basa Fish Regional Analysis and Outlook
8.3.6. Russia Basa Fish Regional Analysis and Outlook
8.3.7. Rest of Europe Basa Fish Regional Analysis and Outlook
8.4. Asia Pacific Basa Fish Revenue (USD Million) by Country (2021-2032)
8.4.1. China Basa Fish Regional Analysis and Outlook
8.4.2. Japan Basa Fish Regional Analysis and Outlook
8.4.3. India Basa Fish Regional Analysis and Outlook
8.4.4. South Korea Basa Fish Regional Analysis and Outlook
8.4.5. Australia Basa Fish Regional Analysis and Outlook
8.4.6. South East Asia Basa Fish Regional Analysis and Outlook
8.4.7. Rest of Asia Pacific Basa Fish Regional Analysis and Outlook
8.5. South America Basa Fish Revenue (USD Million), by Country (2021-2032)
8.5.1. Brazil Basa Fish Regional Analysis and Outlook
8.5.2. Argentina Basa Fish Regional Analysis and Outlook
8.5.3. Rest of South America Basa Fish Regional Analysis and Outlook
8.6. Middle East and Africa Basa Fish Revenue (USD Million) by Country (2021-2032)
8.6.1. Middle East Basa Fish Regional Analysis and Outlook
8.6.2. Africa Basa Fish Regional Analysis and Outlook
Chapter 9. North America Basa Fish Analysis and Outlook
9.1. North America Basa Fish Revenue (USD Million) by Segments (2021-2032)
9.1.1. North America Basa Fish Revenue (USD Million) by Type (2021-2032)
9.1.2. North America Basa Fish Revenue (USD Million) by Application (2021-2032)
9.1.3. North America Basa Fish Revenue (USD Million) by Product (2021-2032)
By Type
Fresh Whole Fish
Frozen Whole Fish
Fresh Fillet
Frozen Fillet
By Application
Caterers
Food
Retail Customers
Hotels
Others
Chapter 10. Europe Basa Fish Analysis and Outlook
10.1. Europe Basa Fish Revenue (USD Million), by Segments (USD Million) (2021-2032)
10.1.1. Europe Basa Fish Revenue (USD Million) by Type (2021-2032)
10.1.2. Europe Basa Fish Revenue (USD Million) by Application (2021-2032)
10.1.3. Europe Basa Fish Revenue (USD Million) by Product (2021-2032)
By Type
Fresh Whole Fish
Frozen Whole Fish
Fresh Fillet
Frozen Fillet
By Application
Caterers
Food
Retail Customers
Hotels
Others
Chapter 11. Asia Pacific Basa Fish Analysis and Outlook
11.1. Asia Pacific Basa Fish Revenue (USD Million), and Revenue (USD Million) by Segments (2021-2032)
11.1.1. Asia Pacific Basa Fish Revenue (USD Million) by Type (2021-2032)
11.1.2. Asia Pacific Basa Fish Revenue (USD Million) by Application (2021-2032)
11.1.3. Asia Pacific Basa Fish Revenue (USD Million) by Product (2021-2032)
By Type
Fresh Whole Fish
Frozen Whole Fish
Fresh Fillet
Frozen Fillet
By Application
Caterers
Food
Retail Customers
Hotels
Others
Chapter 12. South America Basa Fish Analysis and Outlook
12.1. South America Basa Fish Revenue (USD Million), by Segments (2021-2032)
12.1.1. South America Basa Fish Revenue (USD Million) by Type (2021-2032)
12.1.2. South America Basa Fish Revenue (USD Million) by Application (2021-2032)
12.1.3. South America Basa Fish Revenue (USD Million) by Product (2021-2032)
By Type
Fresh Whole Fish
Frozen Whole Fish
Fresh Fillet
Frozen Fillet
By Application
Caterers
Food
Retail Customers
Hotels
Others
Chapter 13. Middle East and Africa Basa Fish Analysis and Outlook
13.1. Middle East and Africa Basa Fish Revenue (USD Million), by Segments (2021-2032)
13.1.1. Middle East and Africa Basa Fish Revenue (USD Million) by Type (2021-2032)
13.1.2. Middle East and Africa Basa Fish Revenue (USD Million) by Application (2021-2032)
13.1.3. Middle East and Africa Basa Fish Revenue (USD Million) by Product (2021-2032)
By Type
Fresh Whole Fish
Frozen Whole Fish
Fresh Fillet
Frozen Fillet
By Application
Caterers
Food
Retail Customers
Hotels
Others
Chapter 14. Basa Fish Company Profiles
14.1 Business Overview
14.2 Product Profiles
14.3 SWOT Profiles
14.5 Recent Developments
14.6 Financial Profile
List of Companies
AGIFISH Co.
Aquatex Ben Tre
Austevoll Seafood
Bien Dong Seafood
Dai Thanh Seafoods
Delta Mina Perkasa
Dimas Reiza Perwira
Expravet Nasuba
GODACO Seafood
Hoang Long Group
Hung Vuong Corp
Nam Viet Corp
Nomad Foods
NTSF SEAFOODS
Thai Union
Truong Giang Fishery Holdings Corp
Vinh Foods
Vinh Hoan
15. Methodology and Data Sources
15.1 Customization Offerings
15.2 Subscription Services
15.3 Related Reports
15.4 Publisher Expertise
LIST OF TABLES
Table 1 Market Segmentation Analysis
Table 2 Global Basa Fish Market Share of Leading Companies, 2023
Table 3 Product Offerings of Leading Companies
Table 4 Low Growth Scenario Forecasts
Table 5 Reference Case Growth Scenario
Table 6 High Growth Case Scenario
Table 7 Global Basa Fish Revenue (USD Million) And CAGR (%) By Type (2021-2032)
Table 8 Global Basa Fish Revenue (USD Million) And CAGR (%) By Application (2021-2032)
Table 9 Global Basa Fish Revenue (USD Million) And CAGR (%) By Product (2021-2032)
Table 10 Global Basa Fish Market Revenue (USD Million) By Regions (2021-2032)
Table 11 Global Basa Fish Market Share (%) By Regions (2021-2032)
Table 12 North America Basa Fish Revenue (USD Million) By Country (2021-2032)
Table 13 Europe Basa Fish Revenue (USD Million) By Country (2021-2032)
Table 14 Asia Pacific Basa Fish Revenue (USD Million) By Country (2021-2032)
Table 15 South America Basa Fish Revenue (USD Million) By Country (2021-2032)
Table 16 Middle East and Africa Basa Fish Revenue (USD Million) By Region (2021-2032)
Table 17 North America Basa Fish Revenue (USD Million) By Type (2021-2032)
Table 18 North America Basa Fish Revenue (USD Million) By Application (2021-2032)
Table 19 North America Basa Fish Revenue (USD Million) By Product (2021-2032)
Table 20 Europe Basa Fish Revenue (USD Million) By Type (2021-2032)
Table 21 Europe Basa Fish Revenue (USD Million) By Application (2021-2032)
Table 22 Europe Basa Fish Revenue (USD Million) By Product (2021-2032)
Table 23 Asia Pacific Basa Fish Revenue (USD Million) By Type (2021-2032)
Table 24 Asia Pacific Basa Fish Revenue (USD Million) By Application (2021-2032)
Table 25 Asia Pacific Basa Fish Revenue (USD Million) By Product (2021-2032)
Table 26 South America Basa Fish Revenue (USD Million) By Type (2021-2032)
Table 27 South America Basa Fish Revenue (USD Million) By Application (2021-2032)
Table 28 South America Basa Fish Revenue (USD Million) By Product (2021-2032)
Table 29 Middle East and Africa Basa Fish Revenue (USD Million) By Type (2021-2032)
Table 30 Middle East and Africa Basa Fish Revenue (USD Million) By Application (2021-2032)
Table 31 Middle East and Africa Basa Fish Revenue (USD Million) By Product (2021-2032)
LIST OF FIGURES
Figure 1. Market Scope
Figure 2. Pricing Forecasts Per Unit, 2023- 2032
Figure 3. Porter’s Five Forces
Figure 4. Global Basa Fish Market Revenue (USD Million) By Regions (2021-2032)
Figure 5. Global Basa Fish Market Share (%) By Regions (2023)
Figure 6. North America Basa Fish Revenue (USD Million) By Country (2021-2032)
Figure 7. United States Basa Fish Revenue (USD Million) By Country (2021-2032)
Figure 8. Canada Basa Fish Revenue (USD Million) By Country (2021-2032)
Figure 9. Mexico Basa Fish Revenue (USD Million) By Country (2021-2032)
Figure 10. Europe Basa Fish Revenue (USD Million) By Country (2021-2032)
Figure 11. Germany Basa Fish Revenue (USD Million) By Country (2021-2032)
Figure 12. France Basa Fish Revenue (USD Million) By Country (2021-2032)
Figure 13. United Kingdom Basa Fish Revenue (USD Million) By Country (2021-2032)
Figure 14. Spain Basa Fish Revenue (USD Million) By Country (2021-2032)
Figure 15. Italy Basa Fish Revenue (USD Million) By Country (2021-2032)
Figure 16. Russia Basa Fish Revenue (USD Million) By Country (2021-2032)
Figure 17. Rest of Europe Basa Fish Revenue (USD Million) By Country (2021-2032)
Figure 11. Asia Pacific Basa Fish Revenue (USD Million) By Country (2021-2032)
Figure 12. China Basa Fish Revenue (USD Million) By Country (2021-2032)
Figure 13. Japan Basa Fish Revenue (USD Million) By Country (2021-2032)
Figure 14. India Basa Fish Revenue (USD Million) By Country (2021-2032)
Figure 15. South Korea Basa Fish Revenue (USD Million) By Country (2021-2032)
Figure 16. Australia Basa Fish Revenue (USD Million) By Country (2021-2032)
Figure 17. South East Asia Basa Fish Revenue (USD Million) By Country (2021-2032)
Figure 18. South America Basa Fish Revenue (USD Million) By Country (2021-2032)
Figure 19. Brazil Basa Fish Revenue (USD Million) By Country (2021-2032)
Figure 20. Argentina Basa Fish Revenue (USD Million) By Country (2021-2032)
Figure 21. Rest of Asia Pacific Basa Fish Revenue (USD Million) By Country (2021-2032)
Figure 22. Middle East and Africa Basa Fish Revenue (USD Million) By Region (2021-2032)
Figure 23. Saudi Arabia Basa Fish Revenue (USD Million) By Region (2021-2032)
Figure 24. The UAE Basa Fish Revenue (USD Million) By Region (2021-2032)
Figure 25. Rest of Middle East Basa Fish Revenue (USD Million) By Region (2021-2032)
Figure 26. South Africa Basa Fish Revenue (USD Million) By Region (2021-2032)
Figure 27. Africa Basa Fish Revenue (USD Million) By Region (2021-2032)
Figure 28. North America Basa Fish Revenue (USD Million) By Type (2021-2032)
Figure 29. North America Basa Fish Revenue (USD Million) By Application (2021-2032)
Figure 30. North America Basa Fish Revenue (USD Million) By Product (2021-2032)
Figure 31. Europe Basa Fish Revenue (USD Million) By Type (2021-2032)
Figure 32. Europe Basa Fish Revenue (USD Million) By Application (2021-2032)
Figure 33. Europe Basa Fish Revenue (USD Million) By Product (2021-2032)
Figure 34. Asia Pacific Basa Fish Revenue (USD Million) By Type (2021-2032)
Figure 35. Asia Pacific Basa Fish Revenue (USD Million) By Application (2021-2032)
Figure 36. Asia Pacific Basa Fish Revenue (USD Million) By Product (2021-2032)
Figure 37. South America Basa Fish Revenue (USD Million) By Type (2021-2032)
Figure 38. South America Basa Fish Revenue (USD Million) By Application (2021-2032)
Figure 39. South America Basa Fish Revenue (USD Million) By Product (2021-2032)
Figure 40. Middle East and Africa Basa Fish Revenue (USD Million) By Type (2021-2032)
Figure 41. Middle East and Africa Basa Fish Revenue (USD Million) By Application (2021-2032)
Figure 42. Middle East and Africa Basa Fish Revenue (USD Million) By Product (2021-2032)
By Type
Fresh Whole Fish
Frozen Whole Fish
Fresh Fillet
Frozen Fillet
By Application
Caterers
Food
Retail Customers
Hotels
Others
Countries Analyzed
North America (US, Canada, Mexico)
Europe (Germany, UK, France, Spain, Italy, Russia, Rest of Europe)
Asia Pacific (China, India, Japan, South Korea, Australia, South East Asia, Rest of Asia)
South America (Brazil, Argentina, Rest of South America)
Middle East and Africa (Saudi Arabia, UAE, Rest of Middle East, South Africa, Egypt, Rest of Africa)
