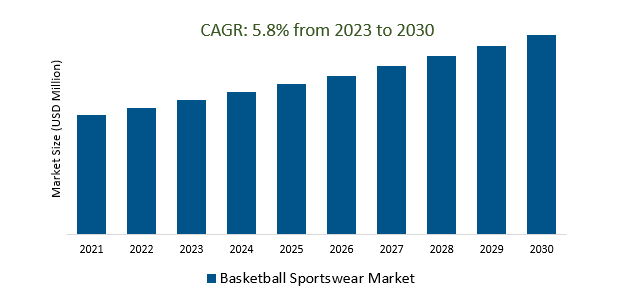
The Global Basketball Sportswear Market Size is estimated to register 5.8% growth over the forecast period from 2023 to 2030.
The market growth is driven by increasing demand for eco-friendly and sustainable sportswear is on the rise, leading to the use of recycled materials and environmentally conscious manufacturing processes. Leading Companies focusing on Smart and Connected Apparel, Sustainable and Eco-Friendly Materials, Personalization and Customization, Augmented Reality (AR) and Virtual Reality (VR) Shopping, Enhanced Durability and Performance, Collaborations and Limited Editions, and others to boost market shares in the industry.
Market Overview
The basketball sportswear market was characterized by trends such as athlete collaborations, a focus on sustainability, the shift to digital commerce, performance enhancements, the influence of streetwear, inclusivity efforts, the athleisure trend, and nostalgic designs. However, the market landscape may have evolved since then, and it is advisable to consult current sources for the latest developments in the basketball sportswear market.
Market Dynamics
Market Trends- Basketball athletes are driving innovation in the basketball sportswear market through their athlete-driven designs.
Athlete-driven designs in the basketball sportswear market, fueled by collaborations between sportswear brands and star players, are propelling innovation. These designs cater to athletes' performance needs while resonating with fans and basketball enthusiasts, representing a fusion of technology and fashion. They not only enhance on-court performance but also influence the broader basketball culture, elevating the significance of sportswear in the sport.
Market Driver- Basketball players and fans are increasingly demanding sustainable and eco-friendly materials in basketball sportswear.
The basketball sportswear market is witnessing an increased demand for sustainable and eco-friendly materials, driven by both players and fans. This trend reflects a growing environmental awareness and a desire to reduce the ecological impact of sportswear production. Consequently, many sportswear brands are incorporating recycled materials and eco-conscious manufacturing methods in the development of basketball apparel and footwear. This transition toward sustainability not only meets the expectations of socially responsible consumers but also aligns with global initiatives to address environmental concerns in the fashion and sportswear industry, marking a positive move towards a more environmentally responsible future in basketball sportswear.
Market Opportunity- Digital commerce and personalization are transforming the basketball sportswear market, as brands increasingly focus on providing a seamless and personalized shopping experience for customers.
Digital commerce and personalization are fundamentally reshaping the basketball sportswear market as brands prioritize delivering a seamless and customized shopping experience. This involves the use of technology such as augmented reality and virtual reality applications for virtual try-ons, direct engagement with consumers through e-commerce platforms, and the utilization of data analytics for personalized recommendations, ultimately enhancing the convenience and engagement between consumers and sportswear brands.
Market Share Analysis- Shoes the basketball Sportswear Market will register the fastest growth
The Global Basketball Sportswear Market is analyzed across, Top Wear, Bottom Wear, Shoes, and others. Shoes are poised to register the fastest growth. Basketball shoes are a significant category within the basketball sportswear market, tailored to meet the performance needs of athletes with features like cushioning, ankle support, and traction. Market trends are influenced by design, technology, and athlete collaborations, with a growing emphasis on eco-friendly materials and sustainability. Consumer preferences for style and functionality shape the development and marketing of basketball shoes, making them a pivotal component catering to both professional athletes and enthusiasts.
Market Share Analysis- Kids held a significant market share in 2023
The Global Basketball Sportswear Market is analyzed across various applications including Men, Women, Kids, and others. Of these, Kids held a significant market share in 2023. The kids' basketball sportswear market comprises sportswear and footwear designed for young athletes, emphasizing comfort, performance, and safety. Similar to the adult market, it is influenced by design trends, sustainability, digital commerce, and personalization. Parents seek durable, affordable, and inclusive options for their children, considering factors like fit and style.
Basketball Sportswear Market News
The NBA and WNBA are set to establish a nationwide network of youth basketball leagues.
NBA and Reliance Retail introduce a wide range of NBA merchandise in India.
Basketball Sportswear Market Segmentation
By Type
- Top Wear
- Bottom Wear
- Shoes
- Others
By Application
By Material
- Polyester
- Cotton
- Spandex
- Blends
By Distribution Channel
- Online
- Specialty Stores
- Department Stores
- Others
By Region
- North America (United States, Canada, Mexico)
- Europe (Germany, France, United Kingdom, Spain, Italy, Others)
- Asia Pacific (China, India, Japan, South Korea, Australia, Others)
- Latin America (Brazil, Argentina, Others)
- Middle East and Africa (Saudi Arabia, UAE, Kuwait, Other Middle East, South Africa, Nigeria, Other Africa)
Basketball Sportswear Market Companies
- Champion (United States)
- Adidas (Germany)
- AND1 (United States)
- Ellesse (Italy)
- Fila (Switzerland)
- Lotto (Italy
- Hummel (Denmark)
- Erreà (Italy)
- Joma (Spain)
- Kappa (Italy)
*List not exhaustive
Basketball Sportswear Market Outlook 2023
1 Market Overview
1.1 Introduction to the Basketball Sportswear Market
1.2 Scope of the Study
1.3 Research Objective
1.3.1 Key Market Scope and Segments
1.3.2 Players Covered
1.3.3 Years Considered
2 Executive Summary
2.1 2023 Basketball Sportswear Industry- Market Statistics
3 Market Dynamics
3.1 Market Drivers
3.2 Market Challenges
3.3 Market Opportunities
3.4 Market Trends
4 Market Factor Analysis
4.1 Porter’s Five Forces
4.2 Market Entropy
4.2.1 Global Basketball Sportswear Market Companies with Area Served
4.2.2 Products Offerings Global Basketball Sportswear Market
5 COVID-19 Impact Analysis and Outlook Scenarios
5.1.1 Covid-19 Impact Analysis
5.1.2 Post-COVID-19 Scenario- Low Growth Case
5.1.3 Post-COVID-19 Scenario- Reference Growth Case
5.1.4 Post-COVID-19 Scenario- Low Growth Case
6 Global Basketball Sportswear Market Trends
6.1 Global Basketball Sportswear Revenue (USD Million) and CAGR (%) by Type (2018-2030)
6.2 Global Basketball Sportswear Revenue (USD Million) and CAGR (%) by Applications (2018-2030)
6.3 Global Basketball Sportswear Revenue (USD Million) and CAGR (%) by Regions (2018-2030)
7 Global Basketball Sportswear Market Revenue (USD Million) by Type, and Applications (2018-2022)
7.1 Global Basketball Sportswear Revenue (USD Million) by Type (2018-2022)
7.1.1 Global Basketball Sportswear Revenue (USD Million), Market Share (%) by Type (2018-2022)
7.2 Global Basketball Sportswear Revenue (USD Million) by Applications (2018-2022)
7.2.1 Global Basketball Sportswear Revenue (USD Million), Market Share (%) by Applications (2018-2022)
8 Global Basketball Sportswear Development Regional Status and Outlook
8.1 Global Basketball Sportswear Revenue (USD Million) By Regions (2018-2022)
8.2 North America Basketball Sportswear Revenue (USD Million) by Type, and Application (2018-2022)
8.2.1 North America Basketball Sportswear Revenue (USD Million) by Country (2018-2022)
8.2.2 North America Basketball Sportswear Revenue (USD Million) by Type (2018-2022)
8.2.3 North America Basketball Sportswear Revenue (USD Million) by Applications (2018-2022)
8.3 Europe Basketball Sportswear Revenue (USD Million), by Type, and Applications (USD Million) (2018-2022)
8.3.1 Europe Basketball Sportswear Revenue (USD Million), by Country (2018-2022)
8.3.2 Europe Basketball Sportswear Revenue (USD Million) by Type (2018-2022)
8.3.3 Europe Basketball Sportswear Revenue (USD Million) by Applications (2018-2022)
8.4 Asia Pacific Basketball Sportswear Revenue (USD Million), and Revenue (USD Million) by Type, and Applications (2018-2022)
8.4.1 Asia Pacific Basketball Sportswear Revenue (USD Million) by Country (2018-2022)
8.4.2 Asia Pacific Basketball Sportswear Revenue (USD Million) by Type (2018-2022)
8.4.3 Asia Pacific Basketball Sportswear Revenue (USD Million) by Applications (2018-2022)
8.5 South America Basketball Sportswear Revenue (USD Million), by Type, and Applications (2018-2022)
8.5.1 South America Basketball Sportswear Revenue (USD Million), by Country (2018-2022)
8.5.2 South America Basketball Sportswear Revenue (USD Million) by Type (2018-2022)
8.5.3 South America Basketball Sportswear Revenue (USD Million) by Applications (2018-2022)
8.6 Middle East and Africa Basketball Sportswear Revenue (USD Million), by Type, Technology, Application, Thickness (2018-2022)
8.6.1 Middle East and Africa Basketball Sportswear Revenue (USD Million) by Country (2018-2022)
8.6.2 Middle East and Africa Basketball Sportswear Revenue (USD Million) by Type (2018-2022)
8.6.3 Middle East and Africa Basketball Sportswear Revenue (USD Million) by Applications (2018-2022)
9 Company Profiles
10 Global Basketball Sportswear Market Revenue (USD Million), by Type, and Applications (2023-2030)
10.1 Global Basketball Sportswear Revenue (USD Million) and Market Share (%) by Type (2023-2030)
10.1.1 Global Basketball Sportswear Revenue (USD Million), and Market Share (%) by Type (2023-2030)
10.2 Global Basketball Sportswear Revenue (USD Million) and Market Share (%) by Applications (2023-2030)
10.2.1 Global Basketball Sportswear Revenue (USD Million), and Market Share (%) by Applications (2023-2030)
11 Global Basketball Sportswear Development Regional Status and Outlook Forecast
11.1 Global Basketball Sportswear Revenue (USD Million) By Regions (2023-2030)
11.2 North America Basketball Sportswear Revenue (USD Million) by Type, and Applications (2023-2030)
11.2.1 North America Basketball Sportswear Revenue (USD) Million by Country (2023-2030)
11.2.2 North America Basketball Sportswear Revenue (USD Million), by Type (2023-2030)
11.2.3 North America Basketball Sportswear Revenue (USD Million), Market Share (%) by Applications (2023-2030)
11.3 Europe Basketball Sportswear Revenue (USD Million), by Type, and Applications (2023-2030)
11.3.1 Europe Basketball Sportswear Revenue (USD Million), by Country (2023-2030)
11.3.2 Europe Basketball Sportswear Revenue (USD Million), by Type (2023-2030)
11.3.3 Europe Basketball Sportswear Revenue (USD Million), by Applications (2023-2030)
11.4 Asia Pacific Basketball Sportswear Revenue (USD Million) by Type, and Applications (2023-2030)
11.4.1 Asia Pacific Basketball Sportswear Revenue (USD Million), by Country (2023-2030)
11.4.2 Asia Pacific Basketball Sportswear Revenue (USD Million), by Type (2023-2030)
11.4.3 Asia Pacific Basketball Sportswear Revenue (USD Million), by Applications (2023-2030)
11.5 South America Basketball Sportswear Revenue (USD Million), by Type, and Applications (2023-2030)
11.5.1 South America Basketball Sportswear Revenue (USD Million), by Country (2023-2030)
11.5.2 South America Basketball Sportswear Revenue (USD Million), by Type (2023-2030)
11.5.3 South America Basketball Sportswear Revenue (USD Million), by Applications (2023-2030)
11.6 Middle East and Africa Basketball Sportswear Revenue (USD Million), by Type, and Applications (2023-2030)
11.6.1 Middle East and Africa Basketball Sportswear Revenue (USD Million), by Region (2023-2030)
11.6.2 Middle East and Africa Basketball Sportswear Revenue (USD Million), by Type (2023-2030)
11.6.3 Middle East and Africa Basketball Sportswear Revenue (USD Million), by Applications (2023-2030)
12 Methodology and Data Sources
12.1 Methodology/Research Approach
12.1.1 Research Programs/Design
12.1.2 Market Size Estimation
12.1.3 Market Breakdown and Data Triangulation
12.2 Data Sources
12.2.1 Secondary Sources
12.2.2 Primary Sources
12.3 Disclaimer
List of Tables
Table 1 Market Segmentation Analysis
Table 2 Global Basketball Sportswear Market Companies with Areas Served
Table 3 Products Offerings Global Basketball Sportswear Market
Table 4 Low Growth Scenario Forecasts
Table 5 Reference Case Growth Scenario
Table 6 High Growth Case Scenario
Table 7 Global Basketball Sportswear Revenue (USD Million) And CAGR (%) By Type (2018-2030)
Table 8 Global Basketball Sportswear Revenue (USD Million) And CAGR (%) By Applications (2018-2030)
Table 9 Global Basketball Sportswear Revenue (USD Million) And CAGR (%) By Regions (2018-2030)
Table 10 Global Basketball Sportswear Revenue (USD Million) By Type (2018-2022)
Table 11 Global Basketball Sportswear Revenue Market Share (%) By Type (2018-2022)
Table 12 Global Basketball Sportswear Revenue (USD Million) By Applications (2018-2022)
Table 13 Global Basketball Sportswear Revenue Market Share (%) By Applications (2018-2022)
Table 14 Global Basketball Sportswear Market Revenue (USD Million) By Regions (2018-2022)
Table 15 Global Basketball Sportswear Market Share (%) By Regions (2018-2022)
Table 16 North America Basketball Sportswear Revenue (USD Million) By Country (2018-2022)
Table 17 North America Basketball Sportswear Revenue (USD Million) By Type (2018-2022)
Table 18 North America Basketball Sportswear Revenue (USD Million) By Applications (2018-2022)
Table 19 Europe Basketball Sportswear Revenue (USD Million) By Country (2018-2022)
Table 20 Europe Basketball Sportswear Revenue (USD Million) By Type (2018-2022)
Table 21 Europe Basketball Sportswear Revenue (USD Million) By Applications (2018-2022)
Table 22 Asia Pacific Basketball Sportswear Revenue (USD Million) By Country (2018-2022)
Table 23 Asia Pacific Basketball Sportswear Revenue (USD Million) By Type (2018-2022)
Table 24 Asia Pacific Basketball Sportswear Revenue (USD Million) By Applications (2018-2022)
Table 25 South America Basketball Sportswear Revenue (USD Million) By Country (2018-2022)
Table 26 South America Basketball Sportswear Revenue (USD Million) By Type (2018-2022)
Table 27 South America Basketball Sportswear Revenue (USD Million) By Applications (2018-2022)
Table 28 Middle East and Africa Basketball Sportswear Revenue (USD Million) By Region (2018-2022)
Table 29 Middle East and Africa Basketball Sportswear Revenue (USD Million) By Type (2018-2022)
Table 30 Middle East and Africa Basketball Sportswear Revenue (USD Million) By Applications (2018-2022)
Table 31 Financial Analysis
Table 32 Global Basketball Sportswear Revenue (USD Million) By Type (2023-2030)
Table 33 Global Basketball Sportswear Revenue Market Share (%) By Type (2023-2030)
Table 34 Global Basketball Sportswear Revenue (USD Million) By Applications (2023-2030)
Table 35 Global Basketball Sportswear Revenue Market Share (%) By Applications (2023-2030)
Table 36 Global Basketball Sportswear Market Revenue (USD Million), And Revenue (USD Million) By Regions (2023-2030)
Table 37 North America Basketball Sportswear Revenue (USD)By Country (2023-2030)
Table 38 North America Basketball Sportswear Revenue (USD Million) By Type (2023-2030)
Table 39 North America Basketball Sportswear Revenue (USD Million) By Applications (2023-2030)
Table 40 Europe Basketball Sportswear Revenue (USD Million) By Country (2023-2030)
Table 41 Europe Basketball Sportswear Revenue (USD Million) By Type (2023-2030)
Table 42 Europe Basketball Sportswear Revenue (USD Million) By Applications (2023-2030)
Table 43 Asia Pacific Basketball Sportswear Revenue (USD Million) By Country (2023-2030)
Table 44 Asia Pacific Basketball Sportswear Revenue (USD Million) By Type (2023-2030)
Table 45 Asia Pacific Basketball Sportswear Revenue (USD Million) By Applications (2023-2030)
Table 46 South America Basketball Sportswear Revenue (USD Million) By Country (2023-2030)
Table 47 South America Basketball Sportswear Revenue (USD Million) By Type (2023-2030)
Table 48 South America Basketball Sportswear Revenue (USD Million) By Applications (2023-2030)
Table 49 Middle East and Africa Basketball Sportswear Revenue (USD Million) By Region (2023-2030)
Table 50 Middle East and Africa Basketball Sportswear Revenue (USD Million) By Region (2023-2030)
Table 51 Middle East and Africa Basketball Sportswear Revenue (USD Million) By Type (2023-2030)
Table 52 Middle East and Africa Basketball Sportswear Revenue (USD Million) By Applications (2023-2030)
Table 53 Research Programs/Design for This Report
Table 54 Key Data Information from Secondary Sources
Table 55 Key Data Information from Primary Sources
List of Figures
Figure 1 Market Scope
Figure 2 Porter’s Five Forces
Figure 3 Global Basketball Sportswear Revenue (USD Million) By Type (2018-2022)
Figure 4 Global Basketball Sportswear Revenue Market Share (%) By Type (2022)
Figure 5 Global Basketball Sportswear Revenue (USD Million) By Applications (2018-2022)
Figure 6 Global Basketball Sportswear Revenue Market Share (%) By Applications (2022)
Figure 7 Global Basketball Sportswear Market Revenue (USD Million) By Regions (2018-2022)
Figure 8 Global Basketball Sportswear Market Share (%) By Regions (2022)
Figure 9 North America Basketball Sportswear Revenue (USD Million) By Country (2018-2022)
Figure 10 North America Basketball Sportswear Revenue (USD Million) By Type (2018-2022)
Figure 11 North America Basketball Sportswear Revenue (USD Million) By Applications (2018-2022)
Figure 12 Europe Basketball Sportswear Revenue (USD Million) By Country (2018-2022)
Figure 13 Europe Basketball Sportswear Revenue (USD Million) By Type (2018-2022)
Figure 14 Europe Basketball Sportswear Revenue (USD Million) By Applications (2018-2022)
Figure 15 Asia Pacific Basketball Sportswear Revenue (USD Million) By Country (2018-2022)
Figure 16 Asia Pacific Basketball Sportswear Revenue (USD Million) By Type (2018-2022)
Figure 17 Asia Pacific Basketball Sportswear Revenue (USD Million) By Applications (2018-2022)
Figure 18 South America Basketball Sportswear Revenue (USD Million) By Country (2018-2022)
Figure 19 South America Basketball Sportswear Revenue (USD Million) By Type (2018-2022)
Figure 20 South America Basketball Sportswear Revenue (USD Million) By Applications (2018-2022)
Figure 21 Middle East and Africa Basketball Sportswear Revenue (USD Million) By Region (2018-2022)
Figure 22 Middle East and Africa Basketball Sportswear Revenue (USD Million) By Type (2018-2022)
Figure 23 Middle East and Africa Basketball Sportswear Revenue (USD Million) By Applications (2018-2022)
Figure 24 Global Basketball Sportswear Revenue (USD Million) By Type (2023-2030)
Figure 25 Global Basketball Sportswear Revenue Market Share (%) By Type (2030)
Figure 26 Global Basketball Sportswear Revenue (USD Million) By Applications (2023-2030)
Figure 27 Global Basketball Sportswear Revenue Market Share (%) By Applications (2030)
Figure 28 Global Basketball Sportswear Market Revenue (USD Million) By Regions (2023-2030)
Figure 29 North America Basketball Sportswear Revenue (USD Million) By Country (2023-2030)
Figure 30 North America Basketball Sportswear Revenue (USD Million) By Type (2023-2030)
Figure 31 North America Basketball Sportswear Revenue (USD Million) By Applications (2023-2030)
Figure 32 Europe Basketball Sportswear Revenue (USD Million) By Country (2023-2030)
Figure 33 Europe Basketball Sportswear Revenue (USD Million) By Type (2023-2030)
Figure 34 Europe Basketball Sportswear Revenue (USD Million) By Applications (2023-2030)
Figure 35 Asia Pacific Basketball Sportswear Revenue (USD Million) By Country (2023-2030)
Figure 36 Asia Pacific Basketball Sportswear Revenue (USD Million) By Type (2023-2030)
Figure 37 Asia Pacific Basketball Sportswear Revenue (USD Million) By Applications (2023-2030)
Figure 38 South America Basketball Sportswear Revenue (USD Million) By Country (2023-2030)
Figure 39 South America Basketball Sportswear Revenue (USD Million) By Type (2023-2030)
Figure 40 South America Basketball Sportswear Revenue (USD Million) By Applications (2023-2030)
Figure 41 Middle East and Africa Basketball Sportswear Revenue (USD Million) By Region (2023-2030)
Figure 42 Middle East and Africa Basketball Sportswear Revenue (USD Million) By Region (2023-2030)
Figure 43 Middle East and Africa Basketball Sportswear Revenue (USD Million) By Type (2023-2030)
Figure 44 Middle East and Africa Basketball Sportswear Revenue (USD Million) By Applications (2023-2030)
Figure 45 Bottom-Up and Top-Down Approaches For This Report
Figure 46 Data Triangulation
