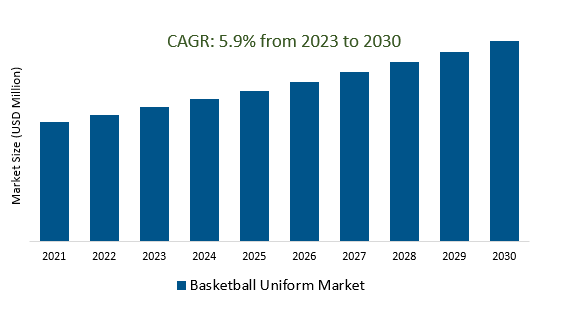
The Basketball Uniform Market Size is estimated to register 5.9% growth over the forecast period from 2024 to 2030.
Basketball Uniform Market Overview
The evolving preferences and demands of athletes, teams, and leagues for technologically advanced, high-performance, and comfortable basketball uniforms are the major factors. Manufacturers are incorporating innovative fabrics, designs, and construction techniques to optimize breathability, flexibility, moisture-wicking properties, and durability in uniforms. The rising popularity and commercialization of basketball at various levels, including professional leagues, college tournaments, and amateur competitions are propelling the demand for distinct, stylish, and visually appealing uniforms. Additionally, Teams and apparel manufacturers are revisiting classic designs and incorporating nostalgic elements, blending heritage with modern fashion sensibilities to create visually appealing uniforms. Further, endorsements, sponsorships, and marketing collaborations with sports apparel companies and prominent players or teams are playing a vital role in driving the market, influencing trends, designs, and sales of basketball uniforms.
Basketball Uniform Market Dynamics
Market Trends- Performance-enhancing technology significantly influences the Basketball Uniform Market
Manufacturers are continually striving to innovate and incorporate advanced materials and design elements in basketball uniforms to elevate athletes' performance on the court.
Leveraging cutting-edge fabrics engineered for moisture management, breathability, and flexibility, providing players with enhanced comfort and agility during gameplay are increasing the market growth.
Additionally, ergonomic designs, reinforced stitching, and strategic panelling are contributing to durability and mobility, crucial for athletes seeking an edge in their performance.
Market Driver- Customization and personalization drive the Basketball Uniform Market, meeting athletes' and teams' demands for unique apparel
Pronounced inclination among players and teams to stand out and create a unique identity, are elevating the significance of customized uniforms.
Manufacturers are offering customization options involving the creation of unique designs, colour schemes, logos, and fits, allowing teams to establish a strong visual identity by offering customization options leading to market expansion.
Further, extension beyond professional leagues to college, school-level, and amateur teams, catering to a broad spectrum of consumers seeking customized sports attire are fueling the demand.
Market Opportunity- Impact of Sustainability and Eco-friendly Materials in the Basketball Uniform Market
Growing inclination towards environmentally conscious practices and materials, aligning with evolving consumer preferences for more responsible and sustainable choices are fostering the demand.
Manufacturers are increasingly integrating eco-friendly fabrics, recycled materials, and sustainable production methods into basketball uniform designs, responding to the demand for environmentally responsible products.
The use of recycled polyester, organic cotton, or plant-based materials in uniform production significantly reduces the environmental footprint, reflecting a commitment to minimizing waste and resource consumption, thereby driving the market.
Market Share Analysis- Polyester will register the fastest growth
The Basketball Uniform Market is analyzed across Cotton, Polyester, Spandex and Nylon. Polyester is poised to register the fastest growth. This synthetic fabric is widely favoured for basketball uniforms due to its exceptional durability, moisture-wicking capabilities, and ease of customization. Polyester's ability to withstand the wear and tear of intense physical activity, while retaining its shape and colour, makes it an ideal choice for sportswear. Its moisture-wicking properties efficiently draw sweat away from the body, keeping players dry and comfortable during the game. Moreover, polyester is highly customizable, allowing for various designs, colour combinations, and logos to be printed or sublimated onto the fabric, enabling teams to create unique and visually appealing uniforms that showcase team identity. Additionally, polyester's quick-drying nature and resistance to shrinking or wrinkling contribute to its popularity in basketball uniforms, offering athletes a garment that remains functional, vibrant, and consistent throughout intense gameplay.
Market Share Analysis- Compression held a significant market share in 2023
The Basketball Uniform Market is analyzed across various Fit types including Loose, Compression and Standard. Of these, Compression held a significant market share in 2023. Compression garments, including compression shirts, shorts, and tights, offer a snug fit that applies gentle pressure to specific muscle groups, aiding in muscle stabilization and reducing muscle oscillation during physical activity. For basketball players, compression garments, especially compression shorts or tights, are valued for their ability to provide support to leg muscles, potentially reducing fatigue and minimizing the risk of muscle strain. Additionally, compression wear is known for its moisture-wicking properties, effectively managing sweat and keeping players dry throughout intense gameplay. Moreover, some athletes believe that wearing compression gear may help in enhancing circulation and promoting faster muscle recovery post-exercise. The Basketball Uniform Market has seen an increasing demand for compression wear due to its perceived benefits in performance, injury prevention, and recovery.
Basketball Uniform Market News
Nike Unveils Retail Jersey Launch Showcasing Four Notable College Basketball Stars.
SquadLocker Introduces Fresh Apparel Designs for On-Demand Custom Sublimated Uniform Line.
Basketball Uniform Market Segmentation
By Type
By Material
- Cotton
- Polyester
- Spandex
- Nylon
By Fit
- Loose
- Compression
- Standard
By Application
- Men
- Women
- Kids
- Professional
- Amateur
By Distribution Channel
By Region
- North America (United States, Canada, Mexico)
- Europe (Germany, France, United Kingdom, Spain, Italy, Others)
- Asia Pacific (China, India, Japan, South Korea, Australia, Others)
- Latin America (Brazil, Argentina, Others)
- Middle East and Africa (Saudi Arabia, UAE, Kuwait, Other Middle East, South Africa, Nigeria, Other Africa)
Basketball Uniform Market Companies
- Adidas
- Amer Sports
- ASICS
- Billabong
- Columbia Sportswear
- Hanesbrands
- Kappa
- LiNing
- Lululemon Athletica
- Nike
- PEAK
- Puma
- Ralph Lauren
- Under Armour
- VF
- Xtep
*List not exhaustive
Basketball Uniform Market Outlook 2023
1 Market Overview
1.1 Introduction to the Basketball Uniform Market
1.2 Scope of the Study
1.3 Research Objective
1.3.1 Key Market Scope and Segments
1.3.2 Players Covered
1.3.3 Years Considered
2 Executive Summary
2.1 2023 Basketball Uniform Industry- Market Statistics
3 Market Dynamics
3.1 Market Drivers
3.2 Market Challenges
3.3 Market Opportunities
3.4 Market Trends
4 Market Factor Analysis
4.1 Porter’s Five Forces
4.2 Market Entropy
4.2.1 Global Basketball Uniform Market Companies with Area Served
4.2.2 Products Offerings Global Basketball Uniform Market
5 COVID-19 Impact Analysis and Outlook Scenarios
5.1.1 Covid-19 Impact Analysis
5.1.2 post-COVID-19 Scenario- Low Growth Case
5.1.3 Post-COVID-19 Scenario- Reference Growth Case
5.1.4 Post-COVID-19 Scenario- Low Growth Case
6 Global Basketball Uniform Market Trends
6.1 Global Basketball Uniform Revenue (USD Million) and CAGR (%) by Type (2018-2030)
6.2 Global Basketball Uniform Revenue (USD Million) and CAGR (%) by Applications (2018-2030)
6.3 Global Basketball Uniform Revenue (USD Million) and CAGR (%) by Regions (2018-2030)
7 Global Basketball Uniform Market Revenue (USD Million) by Type, and Applications (2018-2022)
7.1 Global Basketball Uniform Revenue (USD Million) by Type (2018-2022)
7.1.1 Global Basketball Uniform Revenue (USD Million), Market Share (%) by Type (2018-2022)
7.2 Global Basketball Uniform Revenue (USD Million) by Applications (2018-2022)
7.2.1 Global Basketball Uniform Revenue (USD Million), Market Share (%) by Applications (2018-2022)
8 Global Basketball Uniform Development Regional Status and Outlook
8.1 Global Basketball Uniform Revenue (USD Million) By Regions (2018-2022)
8.2 North America Basketball Uniform Revenue (USD Million) by Type, and Application (2018-2022)
8.2.1 North America Basketball Uniform Revenue (USD Million) by Country (2018-2022)
8.2.2 North America Basketball Uniform Revenue (USD Million) by Type (2018-2022)
8.2.3 North America Basketball Uniform Revenue (USD Million) by Applications (2018-2022)
8.3 Europe Basketball Uniform Revenue (USD Million), by Type, and Applications (USD Million) (2018-2022)
8.3.1 Europe Basketball Uniform Revenue (USD Million), by Country (2018-2022)
8.3.2 Europe Basketball Uniform Revenue (USD Million) by Type (2018-2022)
8.3.3 Europe Basketball Uniform Revenue (USD Million) by Applications (2018-2022)
8.4 Asia Pacific Basketball Uniform Revenue (USD Million), and Revenue (USD Million) by Type, and Applications (2018-2022)
8.4.1 Asia Pacific Basketball Uniform Revenue (USD Million) by Country (2018-2022)
8.4.2 Asia Pacific Basketball Uniform Revenue (USD Million) by Type (2018-2022)
8.4.3 Asia Pacific Basketball Uniform Revenue (USD Million) by Applications (2018-2022)
8.5 South America Basketball Uniform Revenue (USD Million), by Type, and Applications (2018-2022)
8.5.1 South America Basketball Uniform Revenue (USD Million), by Country (2018-2022)
8.5.2 South America Basketball Uniform Revenue (USD Million) by Type (2018-2022)
8.5.3 South America Basketball Uniform Revenue (USD Million) by Applications (2018-2022)
8.6 Middle East and Africa Basketball Uniform Revenue (USD Million), by Type, Technology, Application, Thickness (2018-2022)
8.6.1 Middle East and Africa Basketball Uniform Revenue (USD Million) by Country (2018-2022)
8.6.2 Middle East and Africa Basketball Uniform Revenue (USD Million) by Type (2018-2022)
8.6.3 Middle East and Africa Basketball Uniform Revenue (USD Million) by Applications (2018-2022)
9 Company Profiles
10 Global Basketball Uniform Market Revenue (USD Million), by Type, and Applications (2023-2030)
10.1 Global Basketball Uniform Revenue (USD Million) and Market Share (%) by Type (2023-2030)
10.1.1 Global Basketball Uniform Revenue (USD Million), and Market Share (%) by Type (2023-2030)
10.2 Global Basketball Uniform Revenue (USD Million) and Market Share (%) by Applications (2023-2030)
10.2.1 Global Basketball Uniform Revenue (USD Million), and Market Share (%) by Applications (2023-2030)
11 Global Basketball Uniform Development Regional Status and Outlook Forecast
11.1 Global Basketball Uniform Revenue (USD Million) By Regions (2023-2030)
11.2 North America Basketball Uniform Revenue (USD Million) by Type, and Applications (2023-2030)
11.2.1 North America Basketball Uniform Revenue (USD) Million by Country (2023-2030)
11.2.2 North America Basketball Uniform Revenue (USD Million), by Type (2023-2030)
11.2.3 North America Basketball Uniform Revenue (USD Million), Market Share (%) by Applications (2023-2030)
11.3 Europe Basketball Uniform Revenue (USD Million), by Type, and Applications (2023-2030)
11.3.1 Europe Basketball Uniform Revenue (USD Million), by Country (2023-2030)
11.3.2 Europe Basketball Uniform Revenue (USD Million), by Type (2023-2030)
11.3.3 Europe Basketball Uniform Revenue (USD Million), by Applications (2023-2030)
11.4 Asia Pacific Basketball Uniform Revenue (USD Million) by Type, and Applications (2023-2030)
11.4.1 Asia Pacific Basketball Uniform Revenue (USD Million), by Country (2023-2030)
11.4.2 Asia Pacific Basketball Uniform Revenue (USD Million), by Type (2023-2030)
11.4.3 Asia Pacific Basketball Uniform Revenue (USD Million), by Applications (2023-2030)
11.5 South America Basketball Uniform Revenue (USD Million), by Type, and Applications (2023-2030)
11.5.1 South America Basketball Uniform Revenue (USD Million), by Country (2023-2030)
11.5.2 South America Basketball Uniform Revenue (USD Million), by Type (2023-2030)
11.5.3 South America Basketball Uniform Revenue (USD Million), by Applications (2023-2030)
11.6 Middle East and Africa Basketball Uniform Revenue (USD Million), by Type, and Applications (2023-2030)
11.6.1 Middle East and Africa Basketball Uniform Revenue (USD Million), by Region (2023-2030)
11.6.2 Middle East and Africa Basketball Uniform Revenue (USD Million), by Type (2023-2030)
11.6.3 Middle East and Africa Basketball Uniform Revenue (USD Million), by Applications (2023-2030)
12 Methodology and Data Sources
12.1 Methodology/Research Approach
12.1.1 Research Programs/Design
12.1.2 Market Size Estimation
12.1.3 Market Breakdown and Data Triangulation
12.2 Data Sources
12.2.1 Secondary Sources
12.2.2 Primary Sources
12.3 Disclaimer
List of Tables
Table 1 Market Segmentation Analysis
Table 2 Global Basketball Uniform Market Companies with Areas Served
Table 3 Products Offerings Global Basketball Uniform Market
Table 4 Low Growth Scenario Forecasts
Table 5 Reference Case Growth Scenario
Table 6 High Growth Case Scenario
Table 7 Global Basketball Uniform Revenue (USD Million) And CAGR (%) By Type (2018-2030)
Table 8 Global Basketball Uniform Revenue (USD Million) And CAGR (%) By Applications (2018-2030)
Table 9 Global Basketball Uniform Revenue (USD Million) And CAGR (%) By Regions (2018-2030)
Table 10 Global Basketball Uniform Revenue (USD Million) By Type (2018-2022)
Table 11 Global Basketball Uniform Revenue Market Share (%) By Type (2018-2022)
Table 12 Global Basketball Uniform Revenue (USD Million) By Applications (2018-2022)
Table 13 Global Basketball Uniform Revenue Market Share (%) By Applications (2018-2022)
Table 14 Global Basketball Uniform Market Revenue (USD Million) By Regions (2018-2022)
Table 15 Global Basketball Uniform Market Share (%) By Regions (2018-2022)
Table 16 North America Basketball Uniform Revenue (USD Million) By Country (2018-2022)
Table 17 North America Basketball Uniform Revenue (USD Million) By Type (2018-2022)
Table 18 North America Basketball Uniform Revenue (USD Million) By Applications (2018-2022)
Table 19 Europe Basketball Uniform Revenue (USD Million) By Country (2018-2022)
Table 20 Europe Basketball Uniform Revenue (USD Million) By Type (2018-2022)
Table 21 Europe Basketball Uniform Revenue (USD Million) By Applications (2018-2022)
Table 22 Asia Pacific Basketball Uniform Revenue (USD Million) By Country (2018-2022)
Table 23 Asia Pacific Basketball Uniform Revenue (USD Million) By Type (2018-2022)
Table 24 Asia Pacific Basketball Uniform Revenue (USD Million) By Applications (2018-2022)
Table 25 South America Basketball Uniform Revenue (USD Million) By Country (2018-2022)
Table 26 South America Basketball Uniform Revenue (USD Million) By Type (2018-2022)
Table 27 South America Basketball Uniform Revenue (USD Million) By Applications (2018-2022)
Table 28 Middle East and Africa Basketball Uniform Revenue (USD Million) By Region (2018-2022)
Table 29 Middle East and Africa Basketball Uniform Revenue (USD Million) By Type (2018-2022)
Table 30 Middle East and Africa Basketball Uniform Revenue (USD Million) By Applications (2018-2022)
Table 31 Financial Analysis
Table 32 Global Basketball Uniform Revenue (USD Million) By Type (2023-2030)
Table 33 Global Basketball Uniform Revenue Market Share (%) By Type (2023-2030)
Table 34 Global Basketball Uniform Revenue (USD Million) By Applications (2023-2030)
Table 35 Global Basketball Uniform Revenue Market Share (%) By Applications (2023-2030)
Table 36 Global Basketball Uniform Market Revenue (USD Million), And Revenue (USD Million) By Regions (2023-2030)
Table 37 North America Basketball Uniform Revenue (USD)By Country (2023-2030)
Table 38 North America Basketball Uniform Revenue (USD Million) By Type (2023-2030)
Table 39 North America Basketball Uniform Revenue (USD Million) By Applications (2023-2030)
Table 40 Europe Basketball Uniform Revenue (USD Million) By Country (2023-2030)
Table 41 Europe Basketball Uniform Revenue (USD Million) By Type (2023-2030)
Table 42 Europe Basketball Uniform Revenue (USD Million) By Applications (2023-2030)
Table 43 Asia Pacific Basketball Uniform Revenue (USD Million) By Country (2023-2030)
Table 44 Asia Pacific Basketball Uniform Revenue (USD Million) By Type (2023-2030)
Table 45 Asia Pacific Basketball Uniform Revenue (USD Million) By Applications (2023-2030)
Table 46 South America Basketball Uniform Revenue (USD Million) By Country (2023-2030)
Table 47 South America Basketball Uniform Revenue (USD Million) By Type (2023-2030)
Table 48 South America Basketball Uniform Revenue (USD Million) By Applications (2023-2030)
Table 49 Middle East and Africa Basketball Uniform Revenue (USD Million) By Region (2023-2030)
Table 50 Middle East and Africa Basketball Uniform Revenue (USD Million) By Region (2023-2030)
Table 51 Middle East and Africa Basketball Uniform Revenue (USD Million) By Type (2023-2030)
Table 52 Middle East and Africa Basketball Uniform Revenue (USD Million) By Applications (2023-2030)
Table 53 Research Programs/Design for This Report
Table 54 Key Data Information from Secondary Sources
Table 55 Key Data Information from Primary Sources
List of Figures
Figure 1 Market Scope
Figure 2 Porter’s Five Forces
Figure 3 Global Basketball Uniform Revenue (USD Million) By Type (2018-2022)
Figure 4 Global Basketball Uniform Revenue Market Share (%) By Type (2022)
Figure 5 Global Basketball Uniform Revenue (USD Million) By Applications (2018-2022)
Figure 6 Global Basketball Uniform Revenue Market Share (%) By Applications (2022)
Figure 7 Global Basketball Uniform Market Revenue (USD Million) By Regions (2018-2022)
Figure 8 Global Basketball Uniform Market Share (%) By Regions (2022)
Figure 9 North America Basketball Uniform Revenue (USD Million) By Country (2018-2022)
Figure 10 North America Basketball Uniform Revenue (USD Million) By Type (2018-2022)
Figure 11 North America Basketball Uniform Revenue (USD Million) By Applications (2018-2022)
Figure 12 Europe Basketball Uniform Revenue (USD Million) By Country (2018-2022)
Figure 13 Europe Basketball Uniform Revenue (USD Million) By Type (2018-2022)
Figure 14 Europe Basketball Uniform Revenue (USD Million) By Applications (2018-2022)
Figure 15 Asia Pacific Basketball Uniform Revenue (USD Million) By Country (2018-2022)
Figure 16 Asia Pacific Basketball Uniform Revenue (USD Million) By Type (2018-2022)
Figure 17 Asia Pacific Basketball Uniform Revenue (USD Million) By Applications (2018-2022)
Figure 18 South America Basketball Uniform Revenue (USD Million) By Country (2018-2022)
Figure 19 South America Basketball Uniform Revenue (USD Million) By Type (2018-2022)
Figure 20 South America Basketball Uniform Revenue (USD Million) By Applications (2018-2022)
Figure 21 Middle East and Africa Basketball Uniform Revenue (USD Million) By Region (2018-2022)
Figure 22 Middle East and Africa Basketball Uniform Revenue (USD Million) By Type (2018-2022)
Figure 23 Middle East and Africa Basketball Uniform Revenue (USD Million) By Applications (2018-2022)
Figure 24 Global Basketball Uniform Revenue (USD Million) By Type (2023-2030)
Figure 25 Global Basketball Uniform Revenue Market Share (%) By Type (2030)
Figure 26 Global Basketball Uniform Revenue (USD Million) By Applications (2023-2030)
Figure 27 Global Basketball Uniform Revenue Market Share (%) By Applications (2030)
Figure 28 Global Basketball Uniform Market Revenue (USD Million) By Regions (2023-2030)
Figure 29 North America Basketball Uniform Revenue (USD Million) By Country (2023-2030)
Figure 30 North America Basketball Uniform Revenue (USD Million) By Type (2023-2030)
Figure 31 North America Basketball Uniform Revenue (USD Million) By Applications (2023-2030)
Figure 32 Europe Basketball Uniform Revenue (USD Million) By Country (2023-2030)
Figure 33 Europe Basketball Uniform Revenue (USD Million) By Type (2023-2030)
Figure 34 Europe Basketball Uniform Revenue (USD Million) By Applications (2023-2030)
Figure 35 Asia Pacific Basketball Uniform Revenue (USD Million) By Country (2023-2030)
Figure 36 Asia Pacific Basketball Uniform Revenue (USD Million) By Type (2023-2030)
Figure 37 Asia Pacific Basketball Uniform Revenue (USD Million) By Applications (2023-2030)
Figure 38 South America Basketball Uniform Revenue (USD Million) By Country (2023-2030)
Figure 39 South America Basketball Uniform Revenue (USD Million) By Type (2023-2030)
Figure 40 South America Basketball Uniform Revenue (USD Million) By Applications (2023-2030)
Figure 41 Middle East and Africa Basketball Uniform Revenue (USD Million) By Region (2023-2030)
Figure 42 Middle East and Africa Basketball Uniform Revenue (USD Million) By Region (2023-2030)
Figure 43 Middle East and Africa Basketball Uniform Revenue (USD Million) By Type (2023-2030)
Figure 44 Middle East and Africa Basketball Uniform Revenue (USD Million) By Applications (2023-2030)
Figure 45 Bottom-Up and Top-Down Approaches For This Report
Figure 46 Data Triangulation
