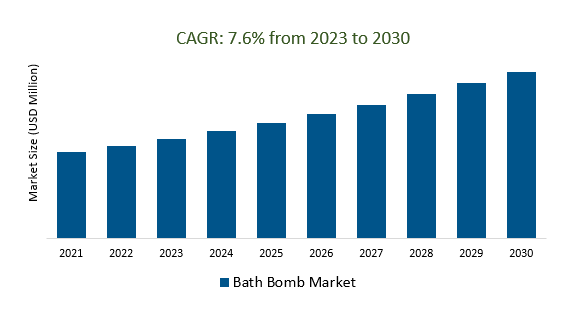
The Global Bath Bomb Market Size is estimated to register 7.6% growth over the forecast period from 2023 to 2030.
The market growth is driven by the Increasing awareness of the importance of self-care and relaxation has led to an increased demand for bath products, including bath bombs, which offer a luxurious and soothing bathing experience. Leading companies that are focused on Product Innovation, Customization, Sustainability, Health and Wellness, Digital Marketing and E-commerce, Regulatory Compliance, Health and Safety, Wellness Tourism, and others to boost market shares in the industry.
Market Overview
The bath bomb market was experiencing steady growth driven by increasing consumer interest in self-care and luxury bath products. Key trends included the demand for natural and organic ingredients, customization options, and a focus on wellness and aromatherapy benefits. Sustainability, online retailing, and influencer marketing played significant roles. The market's future outlook appeared promising, with opportunities in product innovation, sustainability, and international expansion, all driven by consumer preferences for self-care and wellness-oriented products.
Market Dynamics
Market Trends - The Benefits of Natural and Organic Bath Bombs
Natural and organic bath bombs offer multiple advantages in the bath bomb market, including skin safety, eco-friendliness, aromatherapy benefits, non-toxic fragrances, transparency, niche market appeal, reduced environmental impact, positive brand image, compliance with standards, and effective differentiation in a competitive market, making them an increasingly popular choice for health-conscious and environmentally aware consumers seeking safer and more sustainable bath products.
Market Driver- Health and Well-Being Trends Demand Bath Bomb Market
The bath bomb market is experiencing heightened demand due to prevailing health and well-being trends. As consumers increasingly prioritize self-care and wellness, bath bombs have become a sought-after product for their ability to provide relaxation, stress relief, and an overall sense of well-being during bath time. This growing emphasis on health and well-being aligns with the market's offerings, making bath bombs a popular choice for those looking to enhance their bathing rituals and promote personal wellness.
Market Opportunity-Introduction of Health and Safety Standards
Health and safety standards are paramount in the bath bomb market, ensuring product quality, user safety, and regulatory compliance. Manufacturers must adhere to regulations governing ingredients, labeling, and production processes to minimize risks, maintain quality control, and build consumer trust in the safety and efficacy of bath bombs.
Market Share Analysis- Fruity Bath Bomb Market will register the fastest growth
The Global Bath Bomb Market is analyzed across Fruity, Floral, and others. Of these, Fruity, and Floral, are poised to register the fastest growth. Fruity scents are highly appealing in the bath bomb market, offering a diverse range of refreshing and invigorating fragrances like citrus, berry, and tropical options. These scents create a vibrant and enjoyable bathing experience, catering to consumers seeking freshness and vitality in their bathtime rituals. The versatility of fruity fragrances allows manufacturers to meet diverse preferences, enhancing the overall attractiveness and market potential of fruity-scented bath bombs.
Market Share Analysis- Households held a significant market share in 2023
The Global Bath Bomb Market is analyzed across a wide range of applications including Household, Commercial, and others. Of these, Household held a significant market share in 2023. The household segment in the bath bomb market represents the use of bath bombs as an accessible and affordable personal care product for daily relaxation and enjoyment within homes. These bath bombs are chosen to elevate regular bathing routines, create a spa-like ambiance, and promote well-being, reflecting their widespread adoption for self-care and wellness by a diverse range of consumers.
Bath Bomb Market Segmentation
By Fragrance
By Applications
By Distribution Channels
- Supermarkets/Hypermarkets
- Convenience Stores
- Pharmacies
- Specialty Stores
- Online
- Others
By Region
- North America (United States, Canada, Mexico)
- Europe (Germany, France, United Kingdom, Spain, Italy, Others)
- Asia Pacific (China, India, Japan, South Korea, Australia, Others)
- Latin America (Brazil, Argentina, Others)
- Middle East and Africa (Saudi Arabia, UAE, Kuwait, Other Middle East, South Africa, Nigeria, Other Africa)
Bath Bomb Market Companies
- Pearl Bath Bombs
- Oliver Rocket LLC
- Lush Ltd
- The Village Company LLC
- Body Shop International Ltd
- Hugo Naturals
- Swanky Sweet Pea
- Heavenly Bubbles Ltd
- The Natural Soap Company
- Level Naturals
*List not exhaustive
Bath Bomb Market Outlook 2023
1 Market Overview
1.1 Introduction to the Bath Bomb Market
1.2 Scope of the Study
1.3 Research Objective
1.3.1 Key Market Scope and Segments
1.3.2 Players Covered
1.3.3 Years Considered
2 Executive Summary
2.1 2023 Bath Bomb Industry- Market Statistics
3 Market Dynamics
3.1 Market Drivers
3.2 Market Challenges
3.3 Market Opportunities
3.4 Market Trends
4 Market Factor Analysis
4.1 Porter’s Five Forces
4.2 Market Entropy
4.2.1 Global Bath Bomb Market Companies with Area Served
4.2.2 Products Offerings Global Bath Bomb Market
5 COVID-19 Impact Analysis and Outlook Scenarios
5.1.1 Covid-19 Impact Analysis
5.1.2 Post-COVID-19 Scenario- Low Growth Case
5.1.3 Post-COVID-19 Scenario- Reference Growth Case
5.1.4 Post-COVID-19 Scenario- Low Growth Case
6 Global Bath Bomb Market Trends
6.1 Global Bath Bomb Revenue (USD Million) and CAGR (%) by Type (2018-2030)
6.2 Global Bath Bomb Revenue (USD Million) and CAGR (%) by Applications (2018-2030)
6.3 Global Bath Bomb Revenue (USD Million) and CAGR (%) by Regions (2018-2030)
7 Global Bath Bomb Market Revenue (USD Million) by Type, and Applications (2018-2022)
7.1 Global Bath Bomb Revenue (USD Million) by Type (2018-2022)
7.1.1 Global Bath Bomb Revenue (USD Million), Market Share (%) by Type (2018-2022)
7.2 Global Bath Bomb Revenue (USD Million) by Applications (2018-2022)
7.2.1 Global Bath Bomb Revenue (USD Million), Market Share (%) by Applications (2018-2022)
8 Global Bath Bomb Development Regional Status and Outlook
8.1 Global Bath Bomb Revenue (USD Million) By Regions (2018-2022)
8.2 North America Bath Bomb Revenue (USD Million) by Type, and Application (2018-2022)
8.2.1 North America Bath Bomb Revenue (USD Million) by Country (2018-2022)
8.2.2 North America Bath Bomb Revenue (USD Million) by Type (2018-2022)
8.2.3 North America Bath Bomb Revenue (USD Million) by Applications (2018-2022)
8.3 Europe Bath Bomb Revenue (USD Million), by Type, and Applications (USD Million) (2018-2022)
8.3.1 Europe Bath Bomb Revenue (USD Million), by Country (2018-2022)
8.3.2 Europe Bath Bomb Revenue (USD Million) by Type (2018-2022)
8.3.3 Europe Bath Bomb Revenue (USD Million) by Applications (2018-2022)
8.4 Asia Pacific Bath Bomb Revenue (USD Million), and Revenue (USD Million) by Type, and Applications (2018-2022)
8.4.1 Asia Pacific Bath Bomb Revenue (USD Million) by Country (2018-2022)
8.4.2 Asia Pacific Bath Bomb Revenue (USD Million) by Type (2018-2022)
8.4.3 Asia Pacific Bath Bomb Revenue (USD Million) by Applications (2018-2022)
8.5 South America Bath Bomb Revenue (USD Million), by Type, and Applications (2018-2022)
8.5.1 South America Bath Bomb Revenue (USD Million), by Country (2018-2022)
8.5.2 South America Bath Bomb Revenue (USD Million) by Type (2018-2022)
8.5.3 South America Bath Bomb Revenue (USD Million) by Applications (2018-2022)
8.6 Middle East and Africa Bath Bomb Revenue (USD Million), by Type, Technology, Application, Thickness (2018-2022)
8.6.1 Middle East and Africa Bath Bomb Revenue (USD Million) by Country (2018-2022)
8.6.2 Middle East and Africa Bath Bomb Revenue (USD Million) by Type (2018-2022)
8.6.3 Middle East and Africa Bath Bomb Revenue (USD Million) by Applications (2018-2022)
9 Company Profiles
10 Global Bath Bomb Market Revenue (USD Million), by Type, and Applications (2023-2030)
10.1 Global Bath Bomb Revenue (USD Million) and Market Share (%) by Type (2023-2030)
10.1.1 Global Bath Bomb Revenue (USD Million), and Market Share (%) by Type (2023-2030)
10.2 Global Bath Bomb Revenue (USD Million) and Market Share (%) by Applications (2023-2030)
10.2.1 Global Bath Bomb Revenue (USD Million), and Market Share (%) by Applications (2023-2030)
11 Global Bath Bomb Development Regional Status and Outlook Forecast
11.1 Global Bath Bomb Revenue (USD Million) By Regions (2023-2030)
11.2 North America Bath Bomb Revenue (USD Million) by Type, and Applications (2023-2030)
11.2.1 North America Bath Bomb Revenue (USD) Million by Country (2023-2030)
11.2.2 North America Bath Bomb Revenue (USD Million), by Type (2023-2030)
11.2.3 North America Bath Bomb Revenue (USD Million), Market Share (%) by Applications (2023-2030)
11.3 Europe Bath Bomb Revenue (USD Million), by Type, and Applications (2023-2030)
11.3.1 Europe Bath Bomb Revenue (USD Million), by Country (2023-2030)
11.3.2 Europe Bath Bomb Revenue (USD Million), by Type (2023-2030)
11.3.3 Europe Bath Bomb Revenue (USD Million), by Applications (2023-2030)
11.4 Asia Pacific Bath Bomb Revenue (USD Million) by Type, and Applications (2023-2030)
11.4.1 Asia Pacific Bath Bomb Revenue (USD Million), by Country (2023-2030)
11.4.2 Asia Pacific Bath Bomb Revenue (USD Million), by Type (2023-2030)
11.4.3 Asia Pacific Bath Bomb Revenue (USD Million), by Applications (2023-2030)
11.5 South America Bath Bomb Revenue (USD Million), by Type, and Applications (2023-2030)
11.5.1 South America Bath Bomb Revenue (USD Million), by Country (2023-2030)
11.5.2 South America Bath Bomb Revenue (USD Million), by Type (2023-2030)
11.5.3 South America Bath Bomb Revenue (USD Million), by Applications (2023-2030)
11.6 Middle East and Africa Bath Bomb Revenue (USD Million), by Type, and Applications (2023-2030)
11.6.1 Middle East and Africa Bath Bomb Revenue (USD Million), by Region (2023-2030)
11.6.2 Middle East and Africa Bath Bomb Revenue (USD Million), by Type (2023-2030)
11.6.3 Middle East and Africa Bath Bomb Revenue (USD Million), by Applications (2023-2030)
12 Methodology and Data Sources
12.1 Methodology/Research Approach
12.1.1 Research Programs/Design
12.1.2 Market Size Estimation
12.1.3 Market Breakdown and Data Triangulation
12.2 Data Sources
12.2.1 Secondary Sources
12.2.2 Primary Sources
12.3 Disclaimer
List of Tables
Table 1 Market Segmentation Analysis
Table 2 Global Bath Bomb Market Companies with Areas Served
Table 3 Products Offerings Global Bath Bomb Market
Table 4 Low Growth Scenario Forecasts
Table 5 Reference Case Growth Scenario
Table 6 High Growth Case Scenario
Table 7 Global Bath Bomb Revenue (USD Million) And CAGR (%) By Type (2018-2030)
Table 8 Global Bath Bomb Revenue (USD Million) And CAGR (%) By Applications (2018-2030)
Table 9 Global Bath Bomb Revenue (USD Million) And CAGR (%) By Regions (2018-2030)
Table 10 Global Bath Bomb Revenue (USD Million) By Type (2018-2022)
Table 11 Global Bath Bomb Revenue Market Share (%) By Type (2018-2022)
Table 12 Global Bath Bomb Revenue (USD Million) By Applications (2018-2022)
Table 13 Global Bath Bomb Revenue Market Share (%) By Applications (2018-2022)
Table 14 Global Bath Bomb Market Revenue (USD Million) By Regions (2018-2022)
Table 15 Global Bath Bomb Market Share (%) By Regions (2018-2022)
Table 16 North America Bath Bomb Revenue (USD Million) By Country (2018-2022)
Table 17 North America Bath Bomb Revenue (USD Million) By Type (2018-2022)
Table 18 North America Bath Bomb Revenue (USD Million) By Applications (2018-2022)
Table 19 Europe Bath Bomb Revenue (USD Million) By Country (2018-2022)
Table 20 Europe Bath Bomb Revenue (USD Million) By Type (2018-2022)
Table 21 Europe Bath Bomb Revenue (USD Million) By Applications (2018-2022)
Table 22 Asia Pacific Bath Bomb Revenue (USD Million) By Country (2018-2022)
Table 23 Asia Pacific Bath Bomb Revenue (USD Million) By Type (2018-2022)
Table 24 Asia Pacific Bath Bomb Revenue (USD Million) By Applications (2018-2022)
Table 25 South America Bath Bomb Revenue (USD Million) By Country (2018-2022)
Table 26 South America Bath Bomb Revenue (USD Million) By Type (2018-2022)
Table 27 South America Bath Bomb Revenue (USD Million) By Applications (2018-2022)
Table 28 Middle East and Africa Bath Bomb Revenue (USD Million) By Region (2018-2022)
Table 29 Middle East and Africa Bath Bomb Revenue (USD Million) By Type (2018-2022)
Table 30 Middle East and Africa Bath Bomb Revenue (USD Million) By Applications (2018-2022)
Table 31 Financial Analysis
Table 32 Global Bath Bomb Revenue (USD Million) By Type (2023-2030)
Table 33 Global Bath Bomb Revenue Market Share (%) By Type (2023-2030)
Table 34 Global Bath Bomb Revenue (USD Million) By Applications (2023-2030)
Table 35 Global Bath Bomb Revenue Market Share (%) By Applications (2023-2030)
Table 36 Global Bath Bomb Market Revenue (USD Million), And Revenue (USD Million) By Regions (2023-2030)
Table 37 North America Bath Bomb Revenue (USD)By Country (2023-2030)
Table 38 North America Bath Bomb Revenue (USD Million) By Type (2023-2030)
Table 39 North America Bath Bomb Revenue (USD Million) By Applications (2023-2030)
Table 40 Europe Bath Bomb Revenue (USD Million) By Country (2023-2030)
Table 41 Europe Bath Bomb Revenue (USD Million) By Type (2023-2030)
Table 42 Europe Bath Bomb Revenue (USD Million) By Applications (2023-2030)
Table 43 Asia Pacific Bath Bomb Revenue (USD Million) By Country (2023-2030)
Table 44 Asia Pacific Bath Bomb Revenue (USD Million) By Type (2023-2030)
Table 45 Asia Pacific Bath Bomb Revenue (USD Million) By Applications (2023-2030)
Table 46 South America Bath Bomb Revenue (USD Million) By Country (2023-2030)
Table 47 South America Bath Bomb Revenue (USD Million) By Type (2023-2030)
Table 48 South America Bath Bomb Revenue (USD Million) By Applications (2023-2030)
Table 49 Middle East and Africa Bath Bomb Revenue (USD Million) By Region (2023-2030)
Table 50 Middle East and Africa Bath Bomb Revenue (USD Million) By Region (2023-2030)
Table 51 Middle East and Africa Bath Bomb Revenue (USD Million) By Type (2023-2030)
Table 52 Middle East and Africa Bath Bomb Revenue (USD Million) By Applications (2023-2030)
Table 53 Research Programs/Design for This Report
Table 54 Key Data Information from Secondary Sources
Table 55 Key Data Information from Primary Sources
List of Figures
Figure 1 Market Scope
Figure 2 Porter’s Five Forces
Figure 3 Global Bath Bomb Revenue (USD Million) By Type (2018-2022)
Figure 4 Global Bath Bomb Revenue Market Share (%) By Type (2022)
Figure 5 Global Bath Bomb Revenue (USD Million) By Applications (2018-2022)
Figure 6 Global Bath Bomb Revenue Market Share (%) By Applications (2022)
Figure 7 Global Bath Bomb Market Revenue (USD Million) By Regions (2018-2022)
Figure 8 Global Bath Bomb Market Share (%) By Regions (2022)
Figure 9 North America Bath Bomb Revenue (USD Million) By Country (2018-2022)
Figure 10 North America Bath Bomb Revenue (USD Million) By Type (2018-2022)
Figure 11 North America Bath Bomb Revenue (USD Million) By Applications (2018-2022)
Figure 12 Europe Bath Bomb Revenue (USD Million) By Country (2018-2022)
Figure 13 Europe Bath Bomb Revenue (USD Million) By Type (2018-2022)
Figure 14 Europe Bath Bomb Revenue (USD Million) By Applications (2018-2022)
Figure 15 Asia Pacific Bath Bomb Revenue (USD Million) By Country (2018-2022)
Figure 16 Asia Pacific Bath Bomb Revenue (USD Million) By Type (2018-2022)
Figure 17 Asia Pacific Bath Bomb Revenue (USD Million) By Applications (2018-2022)
Figure 18 South America Bath Bomb Revenue (USD Million) By Country (2018-2022)
Figure 19 South America Bath Bomb Revenue (USD Million) By Type (2018-2022)
Figure 20 South America Bath Bomb Revenue (USD Million) By Applications (2018-2022)
Figure 21 Middle East and Africa Bath Bomb Revenue (USD Million) By Region (2018-2022)
Figure 22 Middle East and Africa Bath Bomb Revenue (USD Million) By Type (2018-2022)
Figure 23 Middle East and Africa Bath Bomb Revenue (USD Million) By Applications (2018-2022)
Figure 24 Global Bath Bomb Revenue (USD Million) By Type (2023-2030)
Figure 25 Global Bath Bomb Revenue Market Share (%) By Type (2030)
Figure 26 Global Bath Bomb Revenue (USD Million) By Applications (2023-2030)
Figure 27 Global Bath Bomb Revenue Market Share (%) By Applications (2030)
Figure 28 Global Bath Bomb Market Revenue (USD Million) By Regions (2023-2030)
Figure 29 North America Bath Bomb Revenue (USD Million) By Country (2023-2030)
Figure 30 North America Bath Bomb Revenue (USD Million) By Type (2023-2030)
Figure 31 North America Bath Bomb Revenue (USD Million) By Applications (2023-2030)
Figure 32 Europe Bath Bomb Revenue (USD Million) By Country (2023-2030)
Figure 33 Europe Bath Bomb Revenue (USD Million) By Type (2023-2030)
Figure 34 Europe Bath Bomb Revenue (USD Million) By Applications (2023-2030)
Figure 35 Asia Pacific Bath Bomb Revenue (USD Million) By Country (2023-2030)
Figure 36 Asia Pacific Bath Bomb Revenue (USD Million) By Type (2023-2030)
Figure 37 Asia Pacific Bath Bomb Revenue (USD Million) By Applications (2023-2030)
Figure 38 South America Bath Bomb Revenue (USD Million) By Country (2023-2030)
Figure 39 South America Bath Bomb Revenue (USD Million) By Type (2023-2030)
Figure 40 South America Bath Bomb Revenue (USD Million) By Applications (2023-2030)
Figure 41 Middle East and Africa Bath Bomb Revenue (USD Million) By Region (2023-2030)
Figure 42 Middle East and Africa Bath Bomb Revenue (USD Million) By Region (2023-2030)
Figure 43 Middle East and Africa Bath Bomb Revenue (USD Million) By Type (2023-2030)
Figure 44 Middle East and Africa Bath Bomb Revenue (USD Million) By Applications (2023-2030)
Figure 45 Bottom-Up and Top-Down Approaches For This Report
Figure 46 Data Triangulation
