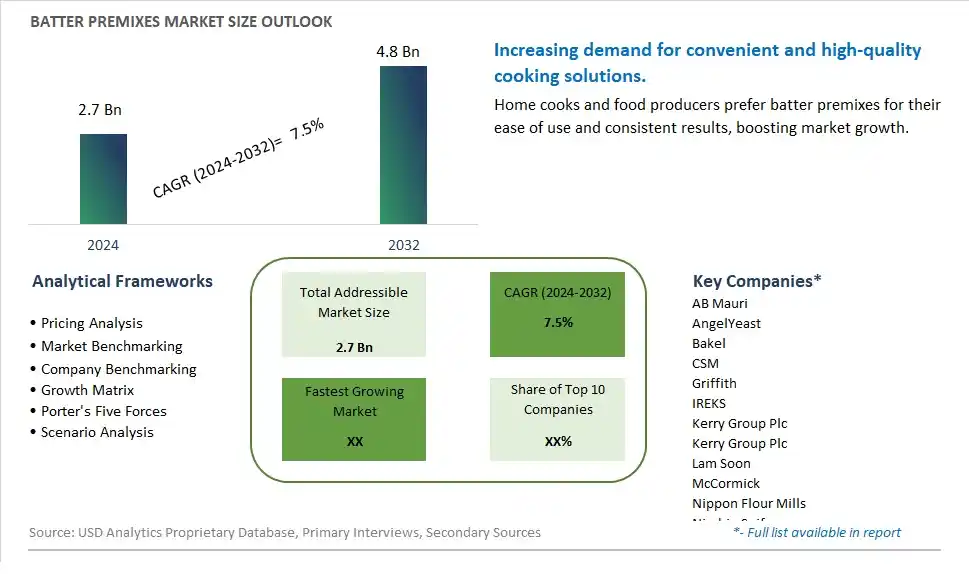
Global Batter Premixes Market Size is valued at $2.7 Billion in 2024 and is forecast to register a growth rate (CAGR) of 7.5% to reach $4.8 Billion by 2032.
The global Batter Premixes Market Comprehensive Study analyzes and forecasts the market size across 6 regions and 24 countries for diverse segments -By Type (Tempura Batter, Fish And Chicken Batter, Others), By Application (Food Processing, Catering, Retail, Others)
An Introduction to Batter Premixes Market
In 2024, the Batter Premixes market is expanding rapidly, fueled by the increasing demand for convenient and high-quality baking solutions. Batter premixes, which include pre-measured ingredients for various baked goods, offer consistency and ease of use for both home bakers and commercial establishments. The market is supported by the growing trend towards home baking and the demand for ready-to-use products that save time and effort. Innovations in premix formulations are enhancing the taste, texture, and nutritional profile of baked goods. The market is also benefiting from the rise of specialty and health-focused premixes, including gluten-free, organic, and high-protein options, catering to diverse dietary needs and preferences.
Batter Premixes Competitive Landscape
The market report analyses the leading companies in the industry including AB Mauri, AngelYeast, Bakel, CSM, Griffith, IREKS, Kerry Group Plc, Kerry Group Plc, Lam Soon, McCormick, Nippon Flour Mills, Nisshin Seifun, Orangerie, Pondan Pangan Makmur Indonesia (PPMI), Prima Flour, PT Gandum Mas Kencana, Puratos Group NV, Rikevita Food, Showa Sangyo, Zeelandia, and Others.
Batter Premixes Market Dynamics
Batter Premixes Market Trend: Convenience and Time-Saving Solutions in Food Preparation
The most prominent market trend for Batter Premixes is the increasing demand for convenience and time-saving solutions in food preparation. With busy lifestyles and a desire for quick and easy meal options, consumers are turning to pre-made batter mixes that streamline the cooking process. Batter premixes offer a convenient way to prepare various dishes, from pancakes and waffles to fried chicken and tempura, without the need to measure and mix individual ingredients. This trend reflects a broader consumer preference for ready-to-use food products that save time and effort in the kitchen, driving the demand for batter premixes across households and foodservice establishments.
Batter Premixes Market Driver: Innovation in Flavor Varieties and Customization
A key market driver for Batter Premixes is the innovation in flavor varieties and customization options. Manufacturers of batter premixes are constantly developing new flavors and formulations to cater to diverse consumer tastes and culinary preferences. Whether it's savory batters for chicken or fish, sweet batters for desserts, or specialty batters with ethnic flavors, the driver of flavor innovation drives the adoption of batter premixes by chefs, home cooks, and food manufacturers seeking convenient solutions with a variety of taste options. Additionally, the customization aspect allows businesses to create unique batter mixes tailored to specific menu offerings and consumer demands.
Batter Premixes Market Opportunity: Expansion into Gluten-Free and Health-Conscious Market Segments
A potential opportunity within the Batter Premixes market lies in expansion into gluten-free and health-conscious market segments. With the increasing prevalence of gluten intolerance and dietary preferences for healthier options, there is a growing demand for gluten-free batter mixes made from alternative flours like rice flour, chickpea flour, or almond flour. Furthermore, there is an opportunity to develop batter premixes with added nutritional benefits, such as whole grains, protein-rich ingredients, or reduced sodium content, catering to health-conscious consumers seeking better-for-you food options. Exploring opportunities in the gluten-free and health-focused segments allows batter premix manufacturers to diversify their product offerings, tap into new market niches, and capitalize on the growing demand for dietary-friendly and nutritious convenience foods. By focusing on expansion into gluten-free and health-conscious market segments, there are opportunities to meet evolving consumer preferences, drive product innovation, and differentiate batter premixes in the competitive convenience food market.
Batter Premixes Market Share Analysis: Fish and Chicken Batter segment generated the highest revenue share in the industry
The Fish and Chicken Batter segment emerges as the largest and most dominant force within the Batter Premixes Market. This segment focuses on premixed batter formulations specifically designed for coating and frying fish and chicken products, offering convenience and consistent quality to foodservice establishments and consumers. The market dominance of this segment is driven by several factors, including the popularity of fried fish and chicken dishes globally, the convenience of using premixed batter for quick and easy preparation, and the increasing demand for crispy and flavorful fried food options. Fish and chicken batters are formulated with a blend of flour, starch, seasoning, and leavening agents to create a light, crispy, and golden coating when fried, enhancing the texture and flavor of fried fish fillets, chicken tenders, nuggets, and other fried items. Further, with the growing trend of indulgent and comfort foods, the Fish and Chicken Batter segment is expected to witness rapid growth and innovation, catering to the evolving tastes and preferences of consumers seeking delicious fried food experiences.
Batter Premixes Market Share Analysis: Food Processing is the fastest growing segment over the forecast period to 2032
The Food Processing segment stands out as the fastest-growing category within the Batter Premixes Market. This segment focuses on providing premixed batter solutions tailored for use in food processing facilities, including industrial-scale operations such as frozen food manufacturers, snack food producers, and foodservice suppliers. The rapid growth of this segment can be attributed to several key factors. Firstly, as the demand for convenience and ready-to-cook food products continues to rise, food processing companies increasingly rely on premixed batters to streamline their production processes and ensure consistency in product quality. Further, advancements in food technology and batter formulations have led to the development of specialized batter mixes that offer extended shelf life, improved texture, and enhanced flavor profiles, catering to the evolving preferences of consumers for high-quality fried and coated food products. Additionally, the Food Processing segment benefits from the expanding global food industry and the proliferation of quick-service restaurants, driving the adoption of premixed batter solutions for a wide range of fried food applications. As a result, the Food Processing segment is poised for substantial growth and innovation, playing a pivotal role in shaping the future landscape of the Batter Premixes Market.
Batter Premixes Market Segmentation
By Type
Tempura Batter
Fish And Chicken Batter
Others
By Application
Food Processing
Catering
Retail
Others
Countries Analyzed
North America (US, Canada, Mexico)
Europe (Germany, UK, France, Spain, Italy, Russia, Rest of Europe)
Asia Pacific (China, India, Japan, South Korea, Australia, South East Asia, Rest of Asia)
South America (Brazil, Argentina, Rest of South America)
Middle East and Africa (Saudi Arabia, UAE, Rest of Middle East, South Africa, Egypt, Rest of Africa)
Batter Premixes Companies Profiled in the Study
AB Mauri
AngelYeast
Bakel
CSM
Griffith
IREKS
Kerry Group Plc
Kerry Group Plc
Lam Soon
McCormick
Nippon Flour Mills
Nisshin Seifun
Orangerie
Pondan Pangan Makmur Indonesia (PPMI)
Prima Flour
PT Gandum Mas Kencana
Puratos Group NV
Rikevita Food
Showa Sangyo
Zeelandia
*- List Not Exhaustive
Chapter 1. TABLE OF CONTENTS
Chapter 2. Introduction to Batter Premixes Market
2.1. Market Overview
2.2. Key Statistics and Report Highlights
2.3. Scope of the Comprehensive Study
2.3.1. Market Definition
2.3.2 Countries and Regions Covered
2.3.3 Research Objective
2.3.4 Units, Currency, and Conversions
2.3.5 Industry Value Chain
2.4. Key Market Segments
2.5. Key Companies
2.6. Study Period
Chapter 3. Strategic Analysis Review
3.1. Batter Premixes Pricing Analysis and Forecast
3.2. Porter’s Five Forces
3.3. Market Ecosystem
3.4. SWOT Analysis
3.5. Regulatory Scenario
3.3. Effects of Inflation, Russia-Ukraine War, moderating economic growth, and other macroeconomic factors
Chapter 4. Competitive Landscape
4.1. Market Share Analysis
4.1.1. Global Batter Premixes Market Share by Company, 2023
4.1.2. Product Offerings of Leading Batter Premixes Companies
4.2. Market Entropy
4.2.1. New Product Launches in the Industry
4.2.2. Mergers, Acquisitions, Joint ventures, and Partnerships
4.3. Key Strategies and Best Practices
Chapter 5. Global Market Projections: Best, Reference, and Low Case Scenarios
5.1. Growth Analysis- Case Scenario Definitions
5.2. Low Growth Case Scenario Forecasts
5.3. Reference Growth Case Scenario Forecasts
5.4. High Growth Case Scenario Forecasts
Chapter 6. Market Dynamics
6.1. Batter Premixes Market Drivers
6.2. Batter Premixes Market Challenges
6.6. Batter Premixes Market Opportunities
6.4. Batter Premixes Market Trends
Chapter 7. Global Batter Premixes Market Outlook Trends
7.1. Global Batter Premixes Revenue (USD Million) and CAGR (%) by Type (2021-2032)
7.2. Global Batter Premixes Revenue (USD Million) and CAGR (%) by Application (2021-2032)
7.3. Global Batter Premixes Revenue (USD Million) and CAGR (%) by Product (2021-2032)
By Type
Tempura Batter
Fish And Chicken Batter
Others
By Application
Food Processing
Catering
Retail
Others
Chapter 8. Global Batter Premixes Regional Analysis and Outlook
8.1. Global Batter Premixes Revenue (USD Million) By Regions (2021- 2032)
8.2. North America Batter Premixes Revenue (USD Million) by Country (2021-2032)
8.2.1. United States Batter Premixes Regional Analysis and Outlook
8.2.2. Canada Batter Premixes Regional Analysis and Outlook
8.2.3. Mexico Batter Premixes Regional Analysis and Outlook
8.3. Europe Batter Premixes Revenue (USD Million), by Country (2021-2032)
8.3.1. Germany Batter Premixes Regional Analysis and Outlook
8.3.2. France Batter Premixes Regional Analysis and Outlook
8.3.3. United Kingdom Batter Premixes Regional Analysis and Outlook
8.3.4. Spain Batter Premixes Regional Analysis and Outlook
8.3.5. Italy Batter Premixes Regional Analysis and Outlook
8.3.6. Russia Batter Premixes Regional Analysis and Outlook
8.3.7. Rest of Europe Batter Premixes Regional Analysis and Outlook
8.4. Asia Pacific Batter Premixes Revenue (USD Million) by Country (2021-2032)
8.4.1. China Batter Premixes Regional Analysis and Outlook
8.4.2. Japan Batter Premixes Regional Analysis and Outlook
8.4.3. India Batter Premixes Regional Analysis and Outlook
8.4.4. South Korea Batter Premixes Regional Analysis and Outlook
8.4.5. Australia Batter Premixes Regional Analysis and Outlook
8.4.6. South East Asia Batter Premixes Regional Analysis and Outlook
8.4.7. Rest of Asia Pacific Batter Premixes Regional Analysis and Outlook
8.5. South America Batter Premixes Revenue (USD Million), by Country (2021-2032)
8.5.1. Brazil Batter Premixes Regional Analysis and Outlook
8.5.2. Argentina Batter Premixes Regional Analysis and Outlook
8.5.3. Rest of South America Batter Premixes Regional Analysis and Outlook
8.6. Middle East and Africa Batter Premixes Revenue (USD Million) by Country (2021-2032)
8.6.1. Middle East Batter Premixes Regional Analysis and Outlook
8.6.2. Africa Batter Premixes Regional Analysis and Outlook
Chapter 9. North America Batter Premixes Analysis and Outlook
9.1. North America Batter Premixes Revenue (USD Million) by Segments (2021-2032)
9.1.1. North America Batter Premixes Revenue (USD Million) by Type (2021-2032)
9.1.2. North America Batter Premixes Revenue (USD Million) by Application (2021-2032)
9.1.3. North America Batter Premixes Revenue (USD Million) by Product (2021-2032)
By Type
Tempura Batter
Fish And Chicken Batter
Others
By Application
Food Processing
Catering
Retail
Others
Chapter 10. Europe Batter Premixes Analysis and Outlook
10.1. Europe Batter Premixes Revenue (USD Million), by Segments (USD Million) (2021-2032)
10.1.1. Europe Batter Premixes Revenue (USD Million) by Type (2021-2032)
10.1.2. Europe Batter Premixes Revenue (USD Million) by Application (2021-2032)
10.1.3. Europe Batter Premixes Revenue (USD Million) by Product (2021-2032)
By Type
Tempura Batter
Fish And Chicken Batter
Others
By Application
Food Processing
Catering
Retail
Others
Chapter 11. Asia Pacific Batter Premixes Analysis and Outlook
11.1. Asia Pacific Batter Premixes Revenue (USD Million), and Revenue (USD Million) by Segments (2021-2032)
11.1.1. Asia Pacific Batter Premixes Revenue (USD Million) by Type (2021-2032)
11.1.2. Asia Pacific Batter Premixes Revenue (USD Million) by Application (2021-2032)
11.1.3. Asia Pacific Batter Premixes Revenue (USD Million) by Product (2021-2032)
By Type
Tempura Batter
Fish And Chicken Batter
Others
By Application
Food Processing
Catering
Retail
Others
Chapter 12. South America Batter Premixes Analysis and Outlook
12.1. South America Batter Premixes Revenue (USD Million), by Segments (2021-2032)
12.1.1. South America Batter Premixes Revenue (USD Million) by Type (2021-2032)
12.1.2. South America Batter Premixes Revenue (USD Million) by Application (2021-2032)
12.1.3. South America Batter Premixes Revenue (USD Million) by Product (2021-2032)
By Type
Tempura Batter
Fish And Chicken Batter
Others
By Application
Food Processing
Catering
Retail
Others
Chapter 13. Middle East and Africa Batter Premixes Analysis and Outlook
13.1. Middle East and Africa Batter Premixes Revenue (USD Million), by Segments (2021-2032)
13.1.1. Middle East and Africa Batter Premixes Revenue (USD Million) by Type (2021-2032)
13.1.2. Middle East and Africa Batter Premixes Revenue (USD Million) by Application (2021-2032)
13.1.3. Middle East and Africa Batter Premixes Revenue (USD Million) by Product (2021-2032)
By Type
Tempura Batter
Fish And Chicken Batter
Others
By Application
Food Processing
Catering
Retail
Others
Chapter 14. Batter Premixes Company Profiles
14.1 Business Overview
14.2 Product Profiles
14.3 SWOT Profiles
14.5 Recent Developments
14.6 Financial Profile
List of Companies
AB Mauri
AngelYeast
Bakel
CSM
Griffith
IREKS
Kerry Group Plc
Kerry Group Plc
Lam Soon
McCormick
Nippon Flour Mills
Nisshin Seifun
Orangerie
Pondan Pangan Makmur Indonesia (PPMI)
Prima Flour
PT Gandum Mas Kencana
Puratos Group NV
Rikevita Food
Showa Sangyo
Zeelandia
15. Methodology and Data Sources
15.1 Customization Offerings
15.2 Subscription Services
15.3 Related Reports
15.4 Publisher Expertise
LIST OF TABLES
Table 1 Market Segmentation Analysis
Table 2 Global Batter Premixes Market Share of Leading Companies, 2023
Table 3 Product Offerings of Leading Companies
Table 4 Low Growth Scenario Forecasts
Table 5 Reference Case Growth Scenario
Table 6 High Growth Case Scenario
Table 7 Global Batter Premixes Revenue (USD Million) And CAGR (%) By Type (2021-2032)
Table 8 Global Batter Premixes Revenue (USD Million) And CAGR (%) By Application (2021-2032)
Table 9 Global Batter Premixes Revenue (USD Million) And CAGR (%) By Product (2021-2032)
Table 10 Global Batter Premixes Market Revenue (USD Million) By Regions (2021-2032)
Table 11 Global Batter Premixes Market Share (%) By Regions (2021-2032)
Table 12 North America Batter Premixes Revenue (USD Million) By Country (2021-2032)
Table 13 Europe Batter Premixes Revenue (USD Million) By Country (2021-2032)
Table 14 Asia Pacific Batter Premixes Revenue (USD Million) By Country (2021-2032)
Table 15 South America Batter Premixes Revenue (USD Million) By Country (2021-2032)
Table 16 Middle East and Africa Batter Premixes Revenue (USD Million) By Region (2021-2032)
Table 17 North America Batter Premixes Revenue (USD Million) By Type (2021-2032)
Table 18 North America Batter Premixes Revenue (USD Million) By Application (2021-2032)
Table 19 North America Batter Premixes Revenue (USD Million) By Product (2021-2032)
Table 20 Europe Batter Premixes Revenue (USD Million) By Type (2021-2032)
Table 21 Europe Batter Premixes Revenue (USD Million) By Application (2021-2032)
Table 22 Europe Batter Premixes Revenue (USD Million) By Product (2021-2032)
Table 23 Asia Pacific Batter Premixes Revenue (USD Million) By Type (2021-2032)
Table 24 Asia Pacific Batter Premixes Revenue (USD Million) By Application (2021-2032)
Table 25 Asia Pacific Batter Premixes Revenue (USD Million) By Product (2021-2032)
Table 26 South America Batter Premixes Revenue (USD Million) By Type (2021-2032)
Table 27 South America Batter Premixes Revenue (USD Million) By Application (2021-2032)
Table 28 South America Batter Premixes Revenue (USD Million) By Product (2021-2032)
Table 29 Middle East and Africa Batter Premixes Revenue (USD Million) By Type (2021-2032)
Table 30 Middle East and Africa Batter Premixes Revenue (USD Million) By Application (2021-2032)
Table 31 Middle East and Africa Batter Premixes Revenue (USD Million) By Product (2021-2032)
LIST OF FIGURES
Figure 1. Market Scope
Figure 2. Pricing Forecasts Per Unit, 2023- 2032
Figure 3. Porter’s Five Forces
Figure 4. Global Batter Premixes Market Revenue (USD Million) By Regions (2021-2032)
Figure 5. Global Batter Premixes Market Share (%) By Regions (2023)
Figure 6. North America Batter Premixes Revenue (USD Million) By Country (2021-2032)
Figure 7. United States Batter Premixes Revenue (USD Million) By Country (2021-2032)
Figure 8. Canada Batter Premixes Revenue (USD Million) By Country (2021-2032)
Figure 9. Mexico Batter Premixes Revenue (USD Million) By Country (2021-2032)
Figure 10. Europe Batter Premixes Revenue (USD Million) By Country (2021-2032)
Figure 11. Germany Batter Premixes Revenue (USD Million) By Country (2021-2032)
Figure 12. France Batter Premixes Revenue (USD Million) By Country (2021-2032)
Figure 13. United Kingdom Batter Premixes Revenue (USD Million) By Country (2021-2032)
Figure 14. Spain Batter Premixes Revenue (USD Million) By Country (2021-2032)
Figure 15. Italy Batter Premixes Revenue (USD Million) By Country (2021-2032)
Figure 16. Russia Batter Premixes Revenue (USD Million) By Country (2021-2032)
Figure 17. Rest of Europe Batter Premixes Revenue (USD Million) By Country (2021-2032)
Figure 11. Asia Pacific Batter Premixes Revenue (USD Million) By Country (2021-2032)
Figure 12. China Batter Premixes Revenue (USD Million) By Country (2021-2032)
Figure 13. Japan Batter Premixes Revenue (USD Million) By Country (2021-2032)
Figure 14. India Batter Premixes Revenue (USD Million) By Country (2021-2032)
Figure 15. South Korea Batter Premixes Revenue (USD Million) By Country (2021-2032)
Figure 16. Australia Batter Premixes Revenue (USD Million) By Country (2021-2032)
Figure 17. South East Asia Batter Premixes Revenue (USD Million) By Country (2021-2032)
Figure 18. South America Batter Premixes Revenue (USD Million) By Country (2021-2032)
Figure 19. Brazil Batter Premixes Revenue (USD Million) By Country (2021-2032)
Figure 20. Argentina Batter Premixes Revenue (USD Million) By Country (2021-2032)
Figure 21. Rest of Asia Pacific Batter Premixes Revenue (USD Million) By Country (2021-2032)
Figure 22. Middle East and Africa Batter Premixes Revenue (USD Million) By Region (2021-2032)
Figure 23. Saudi Arabia Batter Premixes Revenue (USD Million) By Region (2021-2032)
Figure 24. The UAE Batter Premixes Revenue (USD Million) By Region (2021-2032)
Figure 25. Rest of Middle East Batter Premixes Revenue (USD Million) By Region (2021-2032)
Figure 26. South Africa Batter Premixes Revenue (USD Million) By Region (2021-2032)
Figure 27. Africa Batter Premixes Revenue (USD Million) By Region (2021-2032)
Figure 28. North America Batter Premixes Revenue (USD Million) By Type (2021-2032)
Figure 29. North America Batter Premixes Revenue (USD Million) By Application (2021-2032)
Figure 30. North America Batter Premixes Revenue (USD Million) By Product (2021-2032)
Figure 31. Europe Batter Premixes Revenue (USD Million) By Type (2021-2032)
Figure 32. Europe Batter Premixes Revenue (USD Million) By Application (2021-2032)
Figure 33. Europe Batter Premixes Revenue (USD Million) By Product (2021-2032)
Figure 34. Asia Pacific Batter Premixes Revenue (USD Million) By Type (2021-2032)
Figure 35. Asia Pacific Batter Premixes Revenue (USD Million) By Application (2021-2032)
Figure 36. Asia Pacific Batter Premixes Revenue (USD Million) By Product (2021-2032)
Figure 37. South America Batter Premixes Revenue (USD Million) By Type (2021-2032)
Figure 38. South America Batter Premixes Revenue (USD Million) By Application (2021-2032)
Figure 39. South America Batter Premixes Revenue (USD Million) By Product (2021-2032)
Figure 40. Middle East and Africa Batter Premixes Revenue (USD Million) By Type (2021-2032)
Figure 41. Middle East and Africa Batter Premixes Revenue (USD Million) By Application (2021-2032)
Figure 42. Middle East and Africa Batter Premixes Revenue (USD Million) By Product (2021-2032)
By Type
Tempura Batter
Fish And Chicken Batter
Others
By Application
Food Processing
Catering
Retail
Others
Countries Analyzed
North America (US, Canada, Mexico)
Europe (Germany, UK, France, Spain, Italy, Russia, Rest of Europe)
Asia Pacific (China, India, Japan, South Korea, Australia, South East Asia, Rest of Asia)
South America (Brazil, Argentina, Rest of South America)
Middle East and Africa (Saudi Arabia, UAE, Rest of Middle East, South Africa, Egypt, Rest of Africa)
