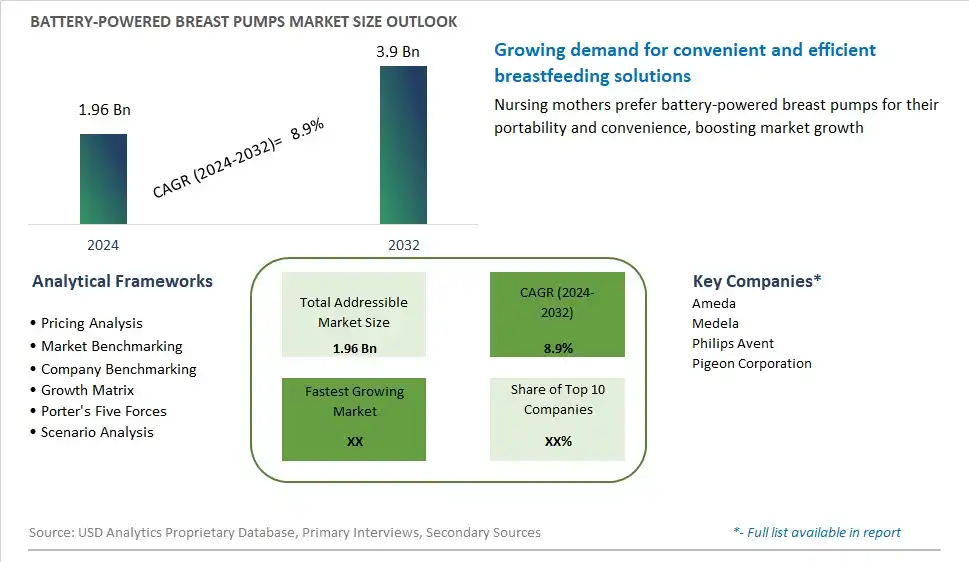
Global Battery-powered Breast Pumps Market Size is valued at $1.96 Billion in 2024 and is forecast to register a growth rate (CAGR) of 8.9% to reach $3.9 Billion by 2032.
The global Battery-powered Breast Pumps Market Comprehensive Study analyzes and forecasts the market size across 6 regions and 24 countries for diverse segments -By Type (Open System, Closed System), By Application (Personal Use, Hospital Grade)
An Introduction to Battery-powered Breast Pumps Market
In 2024, battery-powered breast pumps have revolutionized the landscape of breastfeeding and lactation support for nursing mothers. Offering portability, convenience, and discreet operation, these innovative devices provide flexibility and freedom for expressing breast milk anytime, anywhere. Battery-powered breast pumps are designed for on-the-go use, allowing mothers to pump milk discreetly and efficiently whether at work, traveling, or out and about with their baby. With advancements in technology, modern battery-powered breast pumps offer customizable settings, quiet operation, and gentle suction to mimic a baby's natural nursing rhythm, promoting comfort and efficiency. Moreover, these pumps often feature rechargeable batteries or compatibility with standard batteries, ensuring uninterrupted use without the need for a power outlet. As breastfeeding rates continue to rise and mothers seek support for their breastfeeding journey, battery-powered breast pumps offer a convenient and empowering solution for expressing breast milk with ease and confidence.
Battery powered Breast Pumps Competitive Landscape
The market report analyses the leading companies in the industry including Ameda, Medela, Philips Avent, Pigeon Corporation, and Others.
Battery powered Breast Pumps Market Dynamics
Market Trend: Technological Advancements
The most prominent trend in the Battery-Powered Breast Pumps Market is technological advancements. Manufacturers are continuously innovating to improve the efficiency, comfort, and convenience of battery-powered breast pumps. This trend is driven by the need to provide working mothers with portable and user-friendly solutions that enable them to express milk discreetly and efficiently. Features such as quiet operation, multiple pumping modes, and rechargeable batteries are becoming increasingly popular, enhancing the overall user experience
Market Driver: Increase in Working Mothers
The increase in working mothers is a major driver of the Battery-Powered Breast Pumps Market. As more women join the workforce, there is a growing demand for breast pumps that allow them to balance their professional and personal lives. Battery-powered breast pumps offer the flexibility and portability that working mothers need to continue breastfeeding while managing their work schedules. The rising number of working mothers, combined with their increasing spending power, is driving market growth
Market Opportunity: Expansion into Emerging Markets
A significant opportunity in the Battery-Powered Breast Pumps Market lies in the expansion into emerging markets. Regions such as Asia-Pacific and Latin America are experiencing rapid economic growth and increasing female workforce participation. As awareness of the benefits of breastfeeding rises, there is potential for growth in the demand for battery-powered breast pumps. By targeting these emerging markets with affordable and accessible products, companies can tap into a large and growing consumer base and drive market expansion
Battery-Powered Breast Pumps Market Share Analysis: Type (Open System, Closed System)
The closed system segment is anticipated to be the fastest-growing in the Battery-Powered Breast Pumps Market by type to 2032. Closed system breast pumps offer several advantages, including better hygiene, reduced risk of contamination, and ease of cleaning, making them a preferred choice for nursing mothers. The demand for closed system breast pumps is driven by the increasing awareness of breastfeeding benefits and the growing need for convenient and efficient milk expression solutions. Additionally, advancements in breast pump technology and the development of portable and user-friendly designs contribute to the segment's rapid growth. The expansion of the breastfeeding support market and the increasing availability of closed system breast pumps in various retail channels support the growth of this segment.
Battery-Powered Breast Pumps Market Share Analysis: Application (Personal Use, Hospital Grade)
The personal use segment is projected to be the fastest-growing in the Battery-Powered Breast Pumps Market by application to 2032. The demand for battery-powered breast pumps for personal use is driven by the increasing number of working mothers and the need for convenient and efficient milk expression solutions. Battery-powered breast pumps offer portability, ease of use, and flexibility, making them ideal for busy mothers who need to pump milk on the go. Additionally, advancements in breast pump technology and the development of compact and user-friendly designs contribute to the segment's rapid growth. The expansion of the breastfeeding support market and the increasing availability of battery-powered breast pumps in various retail channels support the growth of the personal use segment.
Battery powered Breast Pumps Market Segmentation
By Type
Open System
Closed System
By Application
Personal Use
Hospital Grade
Countries Analyzed
North America (US, Canada, Mexico)
Europe (Germany, UK, France, Spain, Italy, Russia, Rest of Europe)
Asia Pacific (China, India, Japan, South Korea, Australia, South East Asia, Rest of Asia)
South America (Brazil, Argentina, Rest of South America)
Middle East and Africa (Saudi Arabia, UAE, Rest of Middle East, South Africa, Egypt, Rest of Africa)
Battery powered Breast Pumps Companies Profiled in the Study
Ameda
Medela
Philips Avent
Pigeon Corporation
*- List Not Exhaustive
Chapter 1. TABLE OF CONTENTS
Chapter 2. Introduction to Battery powered Breast Pumps Market
2.1. Market Overview
2.2. Key Statistics and Report Highlights
2.3. Scope of the Comprehensive Study
2.3.1. Market Definition
2.3.2 Countries and Regions Covered
2.3.3 Research Objective
2.3.4 Units, Currency, and Conversions
2.3.5 Industry Value Chain
2.4. Key Market Segments
2.5. Key Companies
2.6. Study Period
Chapter 3. Strategic Analysis Review
3.1. Battery powered Breast Pumps Pricing Analysis and Forecast
3.2. Porter’s Five Forces
3.3. Market Ecosystem
3.4. SWOT Analysis
3.5. Regulatory Scenario
3.3. Effects of Inflation, Russia-Ukraine War, moderating economic growth, and other macroeconomic factors
Chapter 4. Competitive Landscape
4.1. Market Share Analysis
4.1.1. Global Battery powered Breast Pumps Market Share by Company, 2023
4.1.2. Product Offerings of Leading Battery powered Breast Pumps Companies
4.2. Market Entropy
4.2.1. New Product Launches in the Industry
4.2.2. Mergers, Acquisitions, Joint ventures, and Partnerships
4.3. Key Strategies and Best Practices
Chapter 5. Global Market Projections: Best, Reference, and Low Case Scenarios
5.1. Growth Analysis- Case Scenario Definitions
5.2. Low Growth Case Scenario Forecasts
5.3. Reference Growth Case Scenario Forecasts
5.4. High Growth Case Scenario Forecasts
Chapter 6. Market Dynamics
6.1. Battery powered Breast Pumps Market Drivers
6.2. Battery powered Breast Pumps Market Challenges
6.6. Battery powered Breast Pumps Market Opportunities
6.4. Battery powered Breast Pumps Market Trends
Chapter 7. Global Battery powered Breast Pumps Market Outlook Trends
7.1. Global Battery powered Breast Pumps Revenue (USD Million) and CAGR (%) by Type (2021-2032)
7.2. Global Battery powered Breast Pumps Revenue (USD Million) and CAGR (%) by Application (2021-2032)
7.3. Global Battery powered Breast Pumps Revenue (USD Million) and CAGR (%) by Product (2021-2032)
By Type
Open System
Closed System
By Application
Personal Use
Hospital Grade
Chapter 8. Global Battery powered Breast Pumps Regional Analysis and Outlook
8.1. Global Battery powered Breast Pumps Revenue (USD Million) By Regions (2021- 2032)
8.2. North America Battery powered Breast Pumps Revenue (USD Million) by Country (2021-2032)
8.2.1. United States Battery powered Breast Pumps Regional Analysis and Outlook
8.2.2. Canada Battery powered Breast Pumps Regional Analysis and Outlook
8.2.3. Mexico Battery powered Breast Pumps Regional Analysis and Outlook
8.3. Europe Battery powered Breast Pumps Revenue (USD Million), by Country (2021-2032)
8.3.1. Germany Battery powered Breast Pumps Regional Analysis and Outlook
8.3.2. France Battery powered Breast Pumps Regional Analysis and Outlook
8.3.3. United Kingdom Battery powered Breast Pumps Regional Analysis and Outlook
8.3.4. Spain Battery powered Breast Pumps Regional Analysis and Outlook
8.3.5. Italy Battery powered Breast Pumps Regional Analysis and Outlook
8.3.6. Russia Battery powered Breast Pumps Regional Analysis and Outlook
8.3.7. Rest of Europe Battery powered Breast Pumps Regional Analysis and Outlook
8.4. Asia Pacific Battery powered Breast Pumps Revenue (USD Million) by Country (2021-2032)
8.4.1. China Battery powered Breast Pumps Regional Analysis and Outlook
8.4.2. Japan Battery powered Breast Pumps Regional Analysis and Outlook
8.4.3. India Battery powered Breast Pumps Regional Analysis and Outlook
8.4.4. South Korea Battery powered Breast Pumps Regional Analysis and Outlook
8.4.5. Australia Battery powered Breast Pumps Regional Analysis and Outlook
8.4.6. South East Asia Battery powered Breast Pumps Regional Analysis and Outlook
8.4.7. Rest of Asia Pacific Battery powered Breast Pumps Regional Analysis and Outlook
8.5. South America Battery powered Breast Pumps Revenue (USD Million), by Country (2021-2032)
8.5.1. Brazil Battery powered Breast Pumps Regional Analysis and Outlook
8.5.2. Argentina Battery powered Breast Pumps Regional Analysis and Outlook
8.5.3. Rest of South America Battery powered Breast Pumps Regional Analysis and Outlook
8.6. Middle East and Africa Battery powered Breast Pumps Revenue (USD Million) by Country (2021-2032)
8.6.1. Middle East Battery powered Breast Pumps Regional Analysis and Outlook
8.6.2. Africa Battery powered Breast Pumps Regional Analysis and Outlook
Chapter 9. North America Battery powered Breast Pumps Analysis and Outlook
9.1. North America Battery powered Breast Pumps Revenue (USD Million) by Segments (2021-2032)
9.1.1. North America Battery powered Breast Pumps Revenue (USD Million) by Type (2021-2032)
9.1.2. North America Battery powered Breast Pumps Revenue (USD Million) by Application (2021-2032)
9.1.3. North America Battery powered Breast Pumps Revenue (USD Million) by Product (2021-2032)
By Type
Open System
Closed System
By Application
Personal Use
Hospital Grade
Chapter 10. Europe Battery powered Breast Pumps Analysis and Outlook
10.1. Europe Battery powered Breast Pumps Revenue (USD Million), by Segments (USD Million) (2021-2032)
10.1.1. Europe Battery powered Breast Pumps Revenue (USD Million) by Type (2021-2032)
10.1.2. Europe Battery powered Breast Pumps Revenue (USD Million) by Application (2021-2032)
10.1.3. Europe Battery powered Breast Pumps Revenue (USD Million) by Product (2021-2032)
By Type
Open System
Closed System
By Application
Personal Use
Hospital Grade
Chapter 11. Asia Pacific Battery powered Breast Pumps Analysis and Outlook
11.1. Asia Pacific Battery powered Breast Pumps Revenue (USD Million), and Revenue (USD Million) by Segments (2021-2032)
11.1.1. Asia Pacific Battery powered Breast Pumps Revenue (USD Million) by Type (2021-2032)
11.1.2. Asia Pacific Battery powered Breast Pumps Revenue (USD Million) by Application (2021-2032)
11.1.3. Asia Pacific Battery powered Breast Pumps Revenue (USD Million) by Product (2021-2032)
By Type
Open System
Closed System
By Application
Personal Use
Hospital Grade
Chapter 12. South America Battery powered Breast Pumps Analysis and Outlook
12.1. South America Battery powered Breast Pumps Revenue (USD Million), by Segments (2021-2032)
12.1.1. South America Battery powered Breast Pumps Revenue (USD Million) by Type (2021-2032)
12.1.2. South America Battery powered Breast Pumps Revenue (USD Million) by Application (2021-2032)
12.1.3. South America Battery powered Breast Pumps Revenue (USD Million) by Product (2021-2032)
By Type
Open System
Closed System
By Application
Personal Use
Hospital Grade
Chapter 13. Middle East and Africa Battery powered Breast Pumps Analysis and Outlook
13.1. Middle East and Africa Battery powered Breast Pumps Revenue (USD Million), by Segments (2021-2032)
13.1.1. Middle East and Africa Battery powered Breast Pumps Revenue (USD Million) by Type (2021-2032)
13.1.2. Middle East and Africa Battery powered Breast Pumps Revenue (USD Million) by Application (2021-2032)
13.1.3. Middle East and Africa Battery powered Breast Pumps Revenue (USD Million) by Product (2021-2032)
By Type
Open System
Closed System
By Application
Personal Use
Hospital Grade
Chapter 14. Battery powered Breast Pumps Company Profiles
14.1 Business Overview
14.2 Product Profiles
14.3 SWOT Profiles
14.5 Recent Developments
14.6 Financial Profile
List of Companies
Ameda
Medela
Philips Avent
Pigeon Corporation
15. Methodology and Data Sources
15.1 Customization Offerings
15.2 Subscription Services
15.3 Related Reports
15.4 Publisher Expertise
LIST OF TABLES
Table 1 Market Segmentation Analysis
Table 2 Global Battery powered Breast Pumps Market Share of Leading Companies, 2023
Table 3 Product Offerings of Leading Companies
Table 4 Low Growth Scenario Forecasts
Table 5 Reference Case Growth Scenario
Table 6 High Growth Case Scenario
Table 7 Global Battery powered Breast Pumps Revenue (USD Million) And CAGR (%) By Type (2021-2032)
Table 8 Global Battery powered Breast Pumps Revenue (USD Million) And CAGR (%) By Application (2021-2032)
Table 9 Global Battery powered Breast Pumps Revenue (USD Million) And CAGR (%) By Product (2021-2032)
Table 10 Global Battery powered Breast Pumps Market Revenue (USD Million) By Regions (2021-2032)
Table 11 Global Battery powered Breast Pumps Market Share (%) By Regions (2021-2032)
Table 12 North America Battery powered Breast Pumps Revenue (USD Million) By Country (2021-2032)
Table 13 Europe Battery powered Breast Pumps Revenue (USD Million) By Country (2021-2032)
Table 14 Asia Pacific Battery powered Breast Pumps Revenue (USD Million) By Country (2021-2032)
Table 15 South America Battery powered Breast Pumps Revenue (USD Million) By Country (2021-2032)
Table 16 Middle East and Africa Battery powered Breast Pumps Revenue (USD Million) By Region (2021-2032)
Table 17 North America Battery powered Breast Pumps Revenue (USD Million) By Type (2021-2032)
Table 18 North America Battery powered Breast Pumps Revenue (USD Million) By Application (2021-2032)
Table 19 North America Battery powered Breast Pumps Revenue (USD Million) By Product (2021-2032)
Table 20 Europe Battery powered Breast Pumps Revenue (USD Million) By Type (2021-2032)
Table 21 Europe Battery powered Breast Pumps Revenue (USD Million) By Application (2021-2032)
Table 22 Europe Battery powered Breast Pumps Revenue (USD Million) By Product (2021-2032)
Table 23 Asia Pacific Battery powered Breast Pumps Revenue (USD Million) By Type (2021-2032)
Table 24 Asia Pacific Battery powered Breast Pumps Revenue (USD Million) By Application (2021-2032)
Table 25 Asia Pacific Battery powered Breast Pumps Revenue (USD Million) By Product (2021-2032)
Table 26 South America Battery powered Breast Pumps Revenue (USD Million) By Type (2021-2032)
Table 27 South America Battery powered Breast Pumps Revenue (USD Million) By Application (2021-2032)
Table 28 South America Battery powered Breast Pumps Revenue (USD Million) By Product (2021-2032)
Table 29 Middle East and Africa Battery powered Breast Pumps Revenue (USD Million) By Type (2021-2032)
Table 30 Middle East and Africa Battery powered Breast Pumps Revenue (USD Million) By Application (2021-2032)
Table 31 Middle East and Africa Battery powered Breast Pumps Revenue (USD Million) By Product (2021-2032)
LIST OF FIGURES
Figure 1. Market Scope
Figure 2. Pricing Forecasts Per Unit, 2023- 2032
Figure 3. Porter’s Five Forces
Figure 4. Global Battery powered Breast Pumps Market Revenue (USD Million) By Regions (2021-2032)
Figure 5. Global Battery powered Breast Pumps Market Share (%) By Regions (2023)
Figure 6. North America Battery powered Breast Pumps Revenue (USD Million) By Country (2021-2032)
Figure 7. United States Battery powered Breast Pumps Revenue (USD Million) By Country (2021-2032)
Figure 8. Canada Battery powered Breast Pumps Revenue (USD Million) By Country (2021-2032)
Figure 9. Mexico Battery powered Breast Pumps Revenue (USD Million) By Country (2021-2032)
Figure 10. Europe Battery powered Breast Pumps Revenue (USD Million) By Country (2021-2032)
Figure 11. Germany Battery powered Breast Pumps Revenue (USD Million) By Country (2021-2032)
Figure 12. France Battery powered Breast Pumps Revenue (USD Million) By Country (2021-2032)
Figure 13. United Kingdom Battery powered Breast Pumps Revenue (USD Million) By Country (2021-2032)
Figure 14. Spain Battery powered Breast Pumps Revenue (USD Million) By Country (2021-2032)
Figure 15. Italy Battery powered Breast Pumps Revenue (USD Million) By Country (2021-2032)
Figure 16. Russia Battery powered Breast Pumps Revenue (USD Million) By Country (2021-2032)
Figure 17. Rest of Europe Battery powered Breast Pumps Revenue (USD Million) By Country (2021-2032)
Figure 11. Asia Pacific Battery powered Breast Pumps Revenue (USD Million) By Country (2021-2032)
Figure 12. China Battery powered Breast Pumps Revenue (USD Million) By Country (2021-2032)
Figure 13. Japan Battery powered Breast Pumps Revenue (USD Million) By Country (2021-2032)
Figure 14. India Battery powered Breast Pumps Revenue (USD Million) By Country (2021-2032)
Figure 15. South Korea Battery powered Breast Pumps Revenue (USD Million) By Country (2021-2032)
Figure 16. Australia Battery powered Breast Pumps Revenue (USD Million) By Country (2021-2032)
Figure 17. South East Asia Battery powered Breast Pumps Revenue (USD Million) By Country (2021-2032)
Figure 18. South America Battery powered Breast Pumps Revenue (USD Million) By Country (2021-2032)
Figure 19. Brazil Battery powered Breast Pumps Revenue (USD Million) By Country (2021-2032)
Figure 20. Argentina Battery powered Breast Pumps Revenue (USD Million) By Country (2021-2032)
Figure 21. Rest of Asia Pacific Battery powered Breast Pumps Revenue (USD Million) By Country (2021-2032)
Figure 22. Middle East and Africa Battery powered Breast Pumps Revenue (USD Million) By Region (2021-2032)
Figure 23. Saudi Arabia Battery powered Breast Pumps Revenue (USD Million) By Region (2021-2032)
Figure 24. The UAE Battery powered Breast Pumps Revenue (USD Million) By Region (2021-2032)
Figure 25. Rest of Middle East Battery powered Breast Pumps Revenue (USD Million) By Region (2021-2032)
Figure 26. South Africa Battery powered Breast Pumps Revenue (USD Million) By Region (2021-2032)
Figure 27. Africa Battery powered Breast Pumps Revenue (USD Million) By Region (2021-2032)
Figure 28. North America Battery powered Breast Pumps Revenue (USD Million) By Type (2021-2032)
Figure 29. North America Battery powered Breast Pumps Revenue (USD Million) By Application (2021-2032)
Figure 30. North America Battery powered Breast Pumps Revenue (USD Million) By Product (2021-2032)
Figure 31. Europe Battery powered Breast Pumps Revenue (USD Million) By Type (2021-2032)
Figure 32. Europe Battery powered Breast Pumps Revenue (USD Million) By Application (2021-2032)
Figure 33. Europe Battery powered Breast Pumps Revenue (USD Million) By Product (2021-2032)
Figure 34. Asia Pacific Battery powered Breast Pumps Revenue (USD Million) By Type (2021-2032)
Figure 35. Asia Pacific Battery powered Breast Pumps Revenue (USD Million) By Application (2021-2032)
Figure 36. Asia Pacific Battery powered Breast Pumps Revenue (USD Million) By Product (2021-2032)
Figure 37. South America Battery powered Breast Pumps Revenue (USD Million) By Type (2021-2032)
Figure 38. South America Battery powered Breast Pumps Revenue (USD Million) By Application (2021-2032)
Figure 39. South America Battery powered Breast Pumps Revenue (USD Million) By Product (2021-2032)
Figure 40. Middle East and Africa Battery powered Breast Pumps Revenue (USD Million) By Type (2021-2032)
Figure 41. Middle East and Africa Battery powered Breast Pumps Revenue (USD Million) By Application (2021-2032)
Figure 42. Middle East and Africa Battery powered Breast Pumps Revenue (USD Million) By Product (2021-2032)
By Type
Open System
Closed System
By Application
Personal Use
Hospital Grade
Countries Analyzed
North America (US, Canada, Mexico)
Europe (Germany, UK, France, Spain, Italy, Russia, Rest of Europe)
Asia Pacific (China, India, Japan, South Korea, Australia, South East Asia, Rest of Asia)
South America (Brazil, Argentina, Rest of South America)
Middle East and Africa (Saudi Arabia, UAE, Rest of Middle East, South Africa, Egypt, Rest of Africa)
