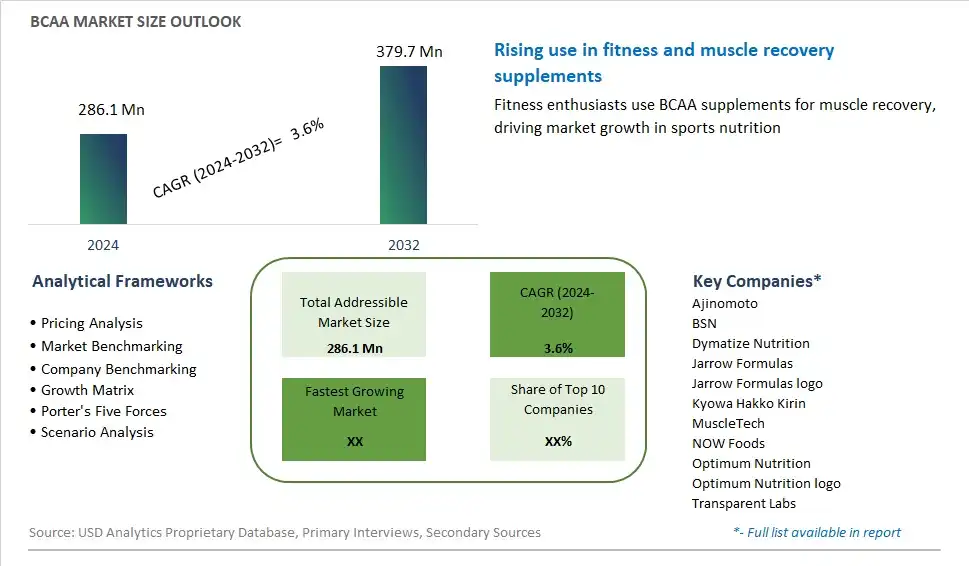
Global BCAA Market Size is valued at $286.1 Million in 2024 and is forecast to register a growth rate (CAGR) of 3.6% to reach $379.7 Million by 2032.
The global BCAA Market Comprehensive Study analyzes and forecasts the market size across 6 regions and 24 countries for diverse segments -By Product (Leucine, Isoleucine and Valine), By Source (Natural Sources, Synthetic Sources), By Formulation (Powder Form, Capsules and Tablets, Liquid Form), By End-User (Sports Nutrition and Supplements, Pharmaceuticals, Functional Foods and Beverages)
An Introduction to BCAA Market
The Branched-Chain Amino Acids (BCAA) Market involves the production and sale of BCAA supplements, which include leucine, isoleucine, and valine. These amino acids are essential for muscle growth, recovery, and performance enhancement. The market is driven by the increasing popularity of fitness and bodybuilding, rising health and wellness awareness, and the growing number of sports enthusiasts and athletes. Additionally, innovations in supplement formulations and the expansion of distribution channels contribute to market growth.
BCAA Competitive Landscape
The market report analyses the leading companies in the industry including Ajinomoto, BSN, Dymatize Nutrition, Jarrow Formulas, Jarrow Formulas logo, Kyowa Hakko Kirin, MuscleTech, NOW Foods, Optimum Nutrition, Optimum Nutrition logo, Transparent Labs, and Others.
BCAA Market Dynamics
BCAA Market Trend: Growing Demand for Sports Nutrition and Fitness Supplements
The market for Branched-Chain Amino Acids (BCAA) is witnessing a prominent trend driven by the growing demand for sports nutrition and fitness supplements. As more individuals prioritize health and wellness, there is an increasing interest in supplements that support athletic performance, muscle recovery, and overall fitness goals. BCAAs, consisting of leucine, isoleucine, and valine, are popular among athletes and fitness enthusiasts for their role in muscle protein synthesis and energy production. This trend is fueled by the rise of fitness culture, the proliferation of gyms and health clubs, and the influence of social media influencers promoting healthy lifestyles. As a result, the market for BCAAs is expanding as consumers seek effective supplements to enhance their exercise routines and achieve their fitness objectives.
Market Driver: Growth in Sports Participation and Fitness Activities
A significant driver of the BCAA market is the growth in sports participation and fitness activities worldwide. With increasing awareness of the importance of physical activity and exercise in maintaining good health, there has been a surge in gym memberships, sports events, and recreational activities. Athletes, bodybuilders, and fitness enthusiasts are incorporating BCAA supplements into their training regimens to support muscle recovery, reduce exercise-induced fatigue, and improve performance. Moreover, the rising popularity of high-intensity interval training (HIIT), CrossFit, and endurance sports has created a demand for supplements that enhance endurance, stamina, and recovery. The growth in sports participation and fitness activities is driving the demand for BCAAs as essential supplements for athletes and active individuals seeking to maximize their performance potential.
Market Opportunity: Expansion into Functional Food and Beverage Market
An opportunity for the BCAA market lies in expansion into the functional food and beverage market. While BCAA supplements are commonly available in powder or capsule form, there is potential for incorporating BCAAs into functional food and beverage products to reach a broader consumer base. Manufacturers can explore opportunities to fortify sports drinks, protein bars, ready-to-drink shakes, and other functional foods with BCAAs to offer convenient and tasty options for consumers seeking on-the-go nutrition. Additionally, there is potential for developing innovative BCAA-infused products targeting specific consumer segments such as post-workout recovery beverages, pre-workout energy snacks, or protein-packed meal replacements. By leveraging the versatility of BCAAs and collaborating with food and beverage manufacturers, suppliers can capitalize on the growing demand for functional nutrition solutions and expand their market reach.
BCAA Market Share Analysis: Leucine held the dominant market share in 2024
The leucine segment commands the largest share in the BCAA (Branched-Chain Amino Acid) market due to its unique role in muscle protein synthesis and its widespread use in sports nutrition and dietary supplements. Leucine, one of the essential amino acids, is known for its ability to stimulate muscle protein synthesis, promote muscle growth, and support recovery after exercise. Athletes, bodybuilders, and fitness enthusiasts often prioritize leucine supplementation to enhance athletic performance, accelerate muscle recovery, and preserve lean muscle mass. Further, leucine's role as a key regulator of protein metabolism and anabolic signaling pathways further contributes to its popularity in the sports nutrition industry. As a result, leucine is the largest segment in the BCAA market, catering to the growing demand for performance-enhancing supplements and fitness-focused nutrition.
BCAA Market Share Analysis: Natural Sources market is poised to register the fastest growth rae over the forecast period to 2032
The natural sources segment is experiencing the fastest growth in the BCAA (Branched-Chain Amino Acid) market, driven by the increasing consumer preference for clean label and minimally processed products. BCAAs obtained from natural sources such as meat, dairy, eggs, and plant-based proteins resonate with health-conscious consumers seeking wholesome and nutrient-rich dietary supplements. Further, natural BCAA sources offer additional nutritional benefits beyond amino acids, including vitamins, minerals, and antioxidants, contributing to overall health and wellness. Additionally, the growing interest in plant-based diets and sustainable food sourcing practices fuels the demand for BCAAs derived from plant sources such as soy, pea, and hemp proteins. As consumers prioritize transparency and authenticity in their dietary choices, the natural sources segment is the fastest-growing in the BCAA market, catering to the evolving preferences of health-conscious consumers.
BCAA Market Share Analysis: Powder Form held the dominant market share in 2024
The powder form segment commands the largest share in the BCAA (Branched-Chain Amino Acid) market due to its convenience, versatility, and popularity among fitness enthusiasts and athletes. BCAA powders offer ease of use, allowing consumers to mix the desired dosage into water, juice, or smoothies, providing a convenient way to consume BCAAs before, during, or after workouts. Further, powdered formulations often come in a variety of flavors, appealing to different taste preferences and enhancing the overall consumption experience. Additionally, BCAA powders are often formulated with additional ingredients such as electrolytes, vitamins, and minerals, offering added benefits for hydration, energy, and recovery. As a result, the powder form segment maintains its dominance in the BCAA market, catering to the demands of active individuals seeking convenient and effective nutritional supplementation.
BCAA Market Segmentation
By Product
Leucine
Isoleucine and Valine
By Source
Natural Sources
Synthetic Sources
By Formulation
Powder Form
Capsules and Tablets
Liquid Form
By End-User
Sports Nutrition and Supplements
Pharmaceuticals
Functional Foods and Beverages
Countries Analyzed
North America (US, Canada, Mexico)
Europe (Germany, UK, France, Spain, Italy, Russia, Rest of Europe)
Asia Pacific (China, India, Japan, South Korea, Australia, South East Asia, Rest of Asia)
South America (Brazil, Argentina, Rest of South America)
Middle East and Africa (Saudi Arabia, UAE, Rest of Middle East, South Africa, Egypt, Rest of Africa)
BCAA Companies Profiled in the Study
Ajinomoto
BSN
Dymatize Nutrition
Jarrow Formulas
Jarrow Formulas logo
Kyowa Hakko Kirin
MuscleTech
NOW Foods
Optimum Nutrition
Optimum Nutrition logo
Transparent Labs
*- List Not Exhaustive
Chapter 1. TABLE OF CONTENTS
Chapter 2. Introduction to BCAA Market
2.1. Market Overview
2.2. Key Statistics and Report Highlights
2.3. Scope of the Comprehensive Study
2.3.1. Market Definition
2.3.2 Countries and Regions Covered
2.3.3 Research Objective
2.3.4 Units, Currency, and Conversions
2.3.5 Industry Value Chain
2.4. Key Market Segments
2.5. Key Companies
2.6. Study Period
Chapter 3. Strategic Analysis Review
3.1. BCAA Pricing Analysis and Forecast
3.2. Porter’s Five Forces
3.3. Market Ecosystem
3.4. SWOT Analysis
3.5. Regulatory Scenario
3.3. Effects of Inflation, Russia-Ukraine War, moderating economic growth, and other macroeconomic factors
Chapter 4. Competitive Landscape
4.1. Market Share Analysis
4.1.1. Global BCAA Market Share by Company, 2023
4.1.2. Product Offerings of Leading BCAA Companies
4.2. Market Entropy
4.2.1. New Product Launches in the Industry
4.2.2. Mergers, Acquisitions, Joint ventures, and Partnerships
4.3. Key Strategies and Best Practices
Chapter 5. Global Market Projections: Best, Reference, and Low Case Scenarios
5.1. Growth Analysis- Case Scenario Definitions
5.2. Low Growth Case Scenario Forecasts
5.3. Reference Growth Case Scenario Forecasts
5.4. High Growth Case Scenario Forecasts
Chapter 6. Market Dynamics
6.1. BCAA Market Drivers
6.2. BCAA Market Challenges
6.6. BCAA Market Opportunities
6.4. BCAA Market Trends
Chapter 7. Global BCAA Market Outlook Trends
7.1. Global BCAA Revenue (USD Million) and CAGR (%) by Type (2021-2032)
7.2. Global BCAA Revenue (USD Million) and CAGR (%) by Application (2021-2032)
7.3. Global BCAA Revenue (USD Million) and CAGR (%) by Product (2021-2032)
By Product
Leucine
Isoleucine and Valine
By Source
Natural Sources
Synthetic Sources
By Formulation
Powder Form
Capsules and Tablets
Liquid Form
By End-User
Sports Nutrition and Supplements
Pharmaceuticals
Functional Foods and Beverages
Chapter 8. Global BCAA Regional Analysis and Outlook
8.1. Global BCAA Revenue (USD Million) By Regions (2021- 2032)
8.2. North America BCAA Revenue (USD Million) by Country (2021-2032)
8.2.1. United States BCAA Regional Analysis and Outlook
8.2.2. Canada BCAA Regional Analysis and Outlook
8.2.3. Mexico BCAA Regional Analysis and Outlook
8.3. Europe BCAA Revenue (USD Million), by Country (2021-2032)
8.3.1. Germany BCAA Regional Analysis and Outlook
8.3.2. France BCAA Regional Analysis and Outlook
8.3.3. United Kingdom BCAA Regional Analysis and Outlook
8.3.4. Spain BCAA Regional Analysis and Outlook
8.3.5. Italy BCAA Regional Analysis and Outlook
8.3.6. Russia BCAA Regional Analysis and Outlook
8.3.7. Rest of Europe BCAA Regional Analysis and Outlook
8.4. Asia Pacific BCAA Revenue (USD Million) by Country (2021-2032)
8.4.1. China BCAA Regional Analysis and Outlook
8.4.2. Japan BCAA Regional Analysis and Outlook
8.4.3. India BCAA Regional Analysis and Outlook
8.4.4. South Korea BCAA Regional Analysis and Outlook
8.4.5. Australia BCAA Regional Analysis and Outlook
8.4.6. South East Asia BCAA Regional Analysis and Outlook
8.4.7. Rest of Asia Pacific BCAA Regional Analysis and Outlook
8.5. South America BCAA Revenue (USD Million), by Country (2021-2032)
8.5.1. Brazil BCAA Regional Analysis and Outlook
8.5.2. Argentina BCAA Regional Analysis and Outlook
8.5.3. Rest of South America BCAA Regional Analysis and Outlook
8.6. Middle East and Africa BCAA Revenue (USD Million) by Country (2021-2032)
8.6.1. Middle East BCAA Regional Analysis and Outlook
8.6.2. Africa BCAA Regional Analysis and Outlook
Chapter 9. North America BCAA Analysis and Outlook
9.1. North America BCAA Revenue (USD Million) by Segments (2021-2032)
9.1.1. North America BCAA Revenue (USD Million) by Type (2021-2032)
9.1.2. North America BCAA Revenue (USD Million) by Application (2021-2032)
9.1.3. North America BCAA Revenue (USD Million) by Product (2021-2032)
By Product
Leucine
Isoleucine and Valine
By Source
Natural Sources
Synthetic Sources
By Formulation
Powder Form
Capsules and Tablets
Liquid Form
By End-User
Sports Nutrition and Supplements
Pharmaceuticals
Functional Foods and Beverages
Chapter 10. Europe BCAA Analysis and Outlook
10.1. Europe BCAA Revenue (USD Million), by Segments (USD Million) (2021-2032)
10.1.1. Europe BCAA Revenue (USD Million) by Type (2021-2032)
10.1.2. Europe BCAA Revenue (USD Million) by Application (2021-2032)
10.1.3. Europe BCAA Revenue (USD Million) by Product (2021-2032)
By Product
Leucine
Isoleucine and Valine
By Source
Natural Sources
Synthetic Sources
By Formulation
Powder Form
Capsules and Tablets
Liquid Form
By End-User
Sports Nutrition and Supplements
Pharmaceuticals
Functional Foods and Beverages
Chapter 11. Asia Pacific BCAA Analysis and Outlook
11.1. Asia Pacific BCAA Revenue (USD Million), and Revenue (USD Million) by Segments (2021-2032)
11.1.1. Asia Pacific BCAA Revenue (USD Million) by Type (2021-2032)
11.1.2. Asia Pacific BCAA Revenue (USD Million) by Application (2021-2032)
11.1.3. Asia Pacific BCAA Revenue (USD Million) by Product (2021-2032)
By Product
Leucine
Isoleucine and Valine
By Source
Natural Sources
Synthetic Sources
By Formulation
Powder Form
Capsules and Tablets
Liquid Form
By End-User
Sports Nutrition and Supplements
Pharmaceuticals
Functional Foods and Beverages
Chapter 12. South America BCAA Analysis and Outlook
12.1. South America BCAA Revenue (USD Million), by Segments (2021-2032)
12.1.1. South America BCAA Revenue (USD Million) by Type (2021-2032)
12.1.2. South America BCAA Revenue (USD Million) by Application (2021-2032)
12.1.3. South America BCAA Revenue (USD Million) by Product (2021-2032)
By Product
Leucine
Isoleucine and Valine
By Source
Natural Sources
Synthetic Sources
By Formulation
Powder Form
Capsules and Tablets
Liquid Form
By End-User
Sports Nutrition and Supplements
Pharmaceuticals
Functional Foods and Beverages
Chapter 13. Middle East and Africa BCAA Analysis and Outlook
13.1. Middle East and Africa BCAA Revenue (USD Million), by Segments (2021-2032)
13.1.1. Middle East and Africa BCAA Revenue (USD Million) by Type (2021-2032)
13.1.2. Middle East and Africa BCAA Revenue (USD Million) by Application (2021-2032)
13.1.3. Middle East and Africa BCAA Revenue (USD Million) by Product (2021-2032)
By Product
Leucine
Isoleucine and Valine
By Source
Natural Sources
Synthetic Sources
By Formulation
Powder Form
Capsules and Tablets
Liquid Form
By End-User
Sports Nutrition and Supplements
Pharmaceuticals
Functional Foods and Beverages
Chapter 14. BCAA Company Profiles
14.1 Business Overview
14.2 Product Profiles
14.3 SWOT Profiles
14.5 Recent Developments
14.6 Financial Profile
List of Companies
Ajinomoto
BSN
Dymatize Nutrition
Jarrow Formulas
Jarrow Formulas logo
Kyowa Hakko Kirin
MuscleTech
NOW Foods
Optimum Nutrition
Optimum Nutrition logo
Transparent Labs
15. Methodology and Data Sources
15.1 Customization Offerings
15.2 Subscription Services
15.3 Related Reports
15.4 Publisher Expertise
LIST OF TABLES
Table 1 Market Segmentation Analysis
Table 2 Global BCAA Market Share of Leading Companies, 2023
Table 3 Product Offerings of Leading Companies
Table 4 Low Growth Scenario Forecasts
Table 5 Reference Case Growth Scenario
Table 6 High Growth Case Scenario
Table 7 Global BCAA Revenue (USD Million) And CAGR (%) By Type (2021-2032)
Table 8 Global BCAA Revenue (USD Million) And CAGR (%) By Application (2021-2032)
Table 9 Global BCAA Revenue (USD Million) And CAGR (%) By Product (2021-2032)
Table 10 Global BCAA Market Revenue (USD Million) By Regions (2021-2032)
Table 11 Global BCAA Market Share (%) By Regions (2021-2032)
Table 12 North America BCAA Revenue (USD Million) By Country (2021-2032)
Table 13 Europe BCAA Revenue (USD Million) By Country (2021-2032)
Table 14 Asia Pacific BCAA Revenue (USD Million) By Country (2021-2032)
Table 15 South America BCAA Revenue (USD Million) By Country (2021-2032)
Table 16 Middle East and Africa BCAA Revenue (USD Million) By Region (2021-2032)
Table 17 North America BCAA Revenue (USD Million) By Type (2021-2032)
Table 18 North America BCAA Revenue (USD Million) By Application (2021-2032)
Table 19 North America BCAA Revenue (USD Million) By Product (2021-2032)
Table 20 Europe BCAA Revenue (USD Million) By Type (2021-2032)
Table 21 Europe BCAA Revenue (USD Million) By Application (2021-2032)
Table 22 Europe BCAA Revenue (USD Million) By Product (2021-2032)
Table 23 Asia Pacific BCAA Revenue (USD Million) By Type (2021-2032)
Table 24 Asia Pacific BCAA Revenue (USD Million) By Application (2021-2032)
Table 25 Asia Pacific BCAA Revenue (USD Million) By Product (2021-2032)
Table 26 South America BCAA Revenue (USD Million) By Type (2021-2032)
Table 27 South America BCAA Revenue (USD Million) By Application (2021-2032)
Table 28 South America BCAA Revenue (USD Million) By Product (2021-2032)
Table 29 Middle East and Africa BCAA Revenue (USD Million) By Type (2021-2032)
Table 30 Middle East and Africa BCAA Revenue (USD Million) By Application (2021-2032)
Table 31 Middle East and Africa BCAA Revenue (USD Million) By Product (2021-2032)
LIST OF FIGURES
Figure 1. Market Scope
Figure 2. Pricing Forecasts Per Unit, 2023- 2032
Figure 3. Porter’s Five Forces
Figure 4. Global BCAA Market Revenue (USD Million) By Regions (2021-2032)
Figure 5. Global BCAA Market Share (%) By Regions (2023)
Figure 6. North America BCAA Revenue (USD Million) By Country (2021-2032)
Figure 7. United States BCAA Revenue (USD Million) By Country (2021-2032)
Figure 8. Canada BCAA Revenue (USD Million) By Country (2021-2032)
Figure 9. Mexico BCAA Revenue (USD Million) By Country (2021-2032)
Figure 10. Europe BCAA Revenue (USD Million) By Country (2021-2032)
Figure 11. Germany BCAA Revenue (USD Million) By Country (2021-2032)
Figure 12. France BCAA Revenue (USD Million) By Country (2021-2032)
Figure 13. United Kingdom BCAA Revenue (USD Million) By Country (2021-2032)
Figure 14. Spain BCAA Revenue (USD Million) By Country (2021-2032)
Figure 15. Italy BCAA Revenue (USD Million) By Country (2021-2032)
Figure 16. Russia BCAA Revenue (USD Million) By Country (2021-2032)
Figure 17. Rest of Europe BCAA Revenue (USD Million) By Country (2021-2032)
Figure 11. Asia Pacific BCAA Revenue (USD Million) By Country (2021-2032)
Figure 12. China BCAA Revenue (USD Million) By Country (2021-2032)
Figure 13. Japan BCAA Revenue (USD Million) By Country (2021-2032)
Figure 14. India BCAA Revenue (USD Million) By Country (2021-2032)
Figure 15. South Korea BCAA Revenue (USD Million) By Country (2021-2032)
Figure 16. Australia BCAA Revenue (USD Million) By Country (2021-2032)
Figure 17. South East Asia BCAA Revenue (USD Million) By Country (2021-2032)
Figure 18. South America BCAA Revenue (USD Million) By Country (2021-2032)
Figure 19. Brazil BCAA Revenue (USD Million) By Country (2021-2032)
Figure 20. Argentina BCAA Revenue (USD Million) By Country (2021-2032)
Figure 21. Rest of Asia Pacific BCAA Revenue (USD Million) By Country (2021-2032)
Figure 22. Middle East and Africa BCAA Revenue (USD Million) By Region (2021-2032)
Figure 23. Saudi Arabia BCAA Revenue (USD Million) By Region (2021-2032)
Figure 24. The UAE BCAA Revenue (USD Million) By Region (2021-2032)
Figure 25. Rest of Middle East BCAA Revenue (USD Million) By Region (2021-2032)
Figure 26. South Africa BCAA Revenue (USD Million) By Region (2021-2032)
Figure 27. Africa BCAA Revenue (USD Million) By Region (2021-2032)
Figure 28. North America BCAA Revenue (USD Million) By Type (2021-2032)
Figure 29. North America BCAA Revenue (USD Million) By Application (2021-2032)
Figure 30. North America BCAA Revenue (USD Million) By Product (2021-2032)
Figure 31. Europe BCAA Revenue (USD Million) By Type (2021-2032)
Figure 32. Europe BCAA Revenue (USD Million) By Application (2021-2032)
Figure 33. Europe BCAA Revenue (USD Million) By Product (2021-2032)
Figure 34. Asia Pacific BCAA Revenue (USD Million) By Type (2021-2032)
Figure 35. Asia Pacific BCAA Revenue (USD Million) By Application (2021-2032)
Figure 36. Asia Pacific BCAA Revenue (USD Million) By Product (2021-2032)
Figure 37. South America BCAA Revenue (USD Million) By Type (2021-2032)
Figure 38. South America BCAA Revenue (USD Million) By Application (2021-2032)
Figure 39. South America BCAA Revenue (USD Million) By Product (2021-2032)
Figure 40. Middle East and Africa BCAA Revenue (USD Million) By Type (2021-2032)
Figure 41. Middle East and Africa BCAA Revenue (USD Million) By Application (2021-2032)
Figure 42. Middle East and Africa BCAA Revenue (USD Million) By Product (2021-2032)
By Product
Leucine
Isoleucine and Valine
By Source
Natural Sources
Synthetic Sources
By Formulation
Powder Form
Capsules and Tablets
Liquid Form
By End-User
Sports Nutrition and Supplements
Pharmaceuticals
Functional Foods and Beverages
Countries Analyzed
North America (US, Canada, Mexico)
Europe (Germany, UK, France, Spain, Italy, Russia, Rest of Europe)
Asia Pacific (China, India, Japan, South Korea, Australia, South East Asia, Rest of Asia)
South America (Brazil, Argentina, Rest of South America)
Middle East and Africa (Saudi Arabia, UAE, Rest of Middle East, South Africa, Egypt, Rest of Africa)
