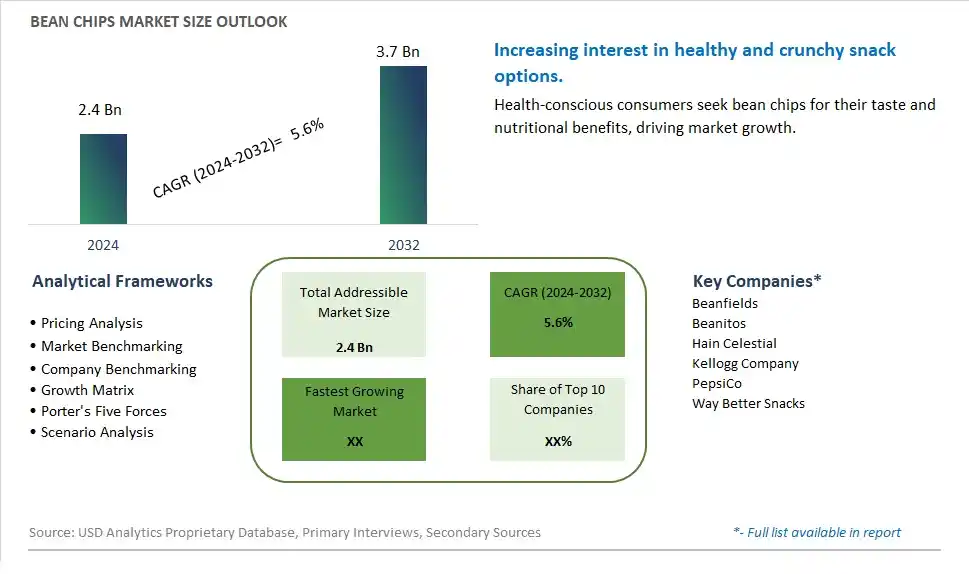
Global Bean Chips Market Size is valued at $2.4 Billion in 2024 and is forecast to register a growth rate (CAGR) of 5.6% to reach $3.7 Billion by 2032.
The global Bean Chips Market Comprehensive Study analyzes and forecasts the market size across 6 regions and 24 countries for diverse segments -By Type (Pinto Beans, Black Beans, White Beans), By Application (Supermarkets/Hypermarkets, Independent Retailer, Online Sales, Others)
An Introduction to Bean Chips Market
The Bean Chips market in 2024 is expanding rapidly, fueled by the rising demand for healthy and nutritious snack options. Bean chips, made from beans such as black beans, chickpeas, and lentils, are valued for their high protein and fiber content, making them a popular alternative to traditional potato chips. The market is supported by the increasing consumer preference for plant-based and gluten-free snacks. Innovations in product formulation and flavoring are enhancing the taste and texture of bean chips, catering to diverse consumer preferences. The market is also benefiting from the trend towards convenient and wholesome snacks that support a healthy lifestyle.
Bean Chips Competitive Landscape
The market report analyses the leading companies in the industry including Beanfields, Beanitos, Hain Celestial, Kellogg Company, PepsiCo, Way Better Snacks, and Others.
Bean Chips Market Dynamics
Bean Chips Market Trend: Increasing Demand for Healthy Snack Alternatives
The most prominent market trend for Bean Chips is the increasing demand for healthy snack alternatives. With a growing focus on health and wellness, consumers are seeking snacks that offer nutritional benefits without compromising on taste. Bean chips, made from legumes like chickpeas, black beans, or lentils, are gaining popularity as a healthier alternative to traditional potato chips. This trend reflects a broader shift towards mindful eating habits, driving the demand for bean chips as a nutritious and satisfying snack option.
Bean Chips Market Driver: Rise in Plant-Based and Vegan Diets
A key market driver for Bean Chips is the rise in plant-based and vegan diets. As more consumers adopt plant-forward eating habits and seek protein-rich, fiber-packed snacks, bean chips emerge as a convenient and satisfying choice. Bean chips are naturally vegan and gluten-free, making them suitable for a wide range of dietary preferences. The driver of plant-based diets propels the adoption of bean chips by health-conscious consumers looking for flavorful snacks that align with their dietary needs and values.
Bean Chips Market Opportunity: Expansion into Flavor Innovation and Functional Ingredients
A potential opportunity within the Bean Chips market lies in expansion into flavor innovation and functional ingredients. Collaborating with chefs and food technologists can lead to the development of unique and craveable flavors for bean chips, such as spicy jalapeno, tangy barbecue, savory garlic herb, or exotic curry blends. Furthermore, incorporating functional ingredients like superfoods, herbs, or spices can enhance the nutritional profile of bean chips, adding antioxidants, vitamins, and minerals. Exploring opportunities in flavor innovation and functional ingredients allows bean chip manufacturers to differentiate their products, cater to diverse flavor preferences, and attract consumers seeking both taste and health benefits in their snacks. By focusing on expansion into flavor innovation and functional ingredients, there are opportunities to create value-added offerings, capture market share, and stay competitive in the healthy snack market.
Bean Chips Market Share Analysis: Pinto Beans segment generated the highest revenue share in the industry
The Pinto Beans segment stands out as the largest and most influential category within the Bean Chips Market. Pinto beans, known for their earthy flavor and creamy texture, are a popular choice for bean chip production due to their versatility and widespread appeal among consumers. These beans are commonly used in the production of bean chips, providing a flavorful base that complements various seasonings and flavor profiles. The dominance of the Pinto Beans segment can be attributed to several key factors. Firstly, pinto beans are a staple ingredient in Mexican and Southwestern cuisines, where they are traditionally enjoyed in dishes such as refried beans, chili, and burritos. This cultural connection has contributed to their popularity and recognition among consumers, driving demand for pinto bean-based products like bean chips. Further, the growing consumer focus on health and wellness, along with the increasing adoption of plant-based diets, has boosted the demand for nutritious and protein-rich snacks like bean chips, further propelling the growth of the Pinto Beans segment. Additionally, manufacturers in the bean chips industry are continuously innovating with pinto beans, introducing new flavors, formats, and product variants to cater to evolving consumer preferences and dietary trends. As a result, the Pinto Beans segment maintains its leadership position in the Bean Chips Market and is expected to continue its growth trajectory in the coming years.
Bean Chips Market Share Analysis: Online Sales is the fastest growing segment over the forecast period to 2032
The Online Sales segment emerges as the fastest-growing category within the Bean Chips Market, showcasing remarkable growth potential up to 2032. This segment pertains to the distribution and sales of bean chips through online channels, including e-commerce platforms, online marketplaces, and direct-to-consumer websites. The rapid growth of the Online Sales segment can be attributed to several key factors. Firstly, the increasing consumer shift towards online shopping for groceries and snacks due to convenience, accessibility, and a wide range of product choices has fueled the demand for bean chips through online channels. The Past few yearshas further accelerated this trend as consumers prioritize contactless shopping experiences and home delivery services. Further, the extensive digital marketing efforts by bean chip manufacturers and retailers, coupled with attractive promotional offers, discounts, and bundles online, have attracted a larger customer base and contributed to increased sales volume in the Online Sales segment. Further, the ability of online platforms to provide detailed product information, customer reviews, and personalized recommendations has enhanced the shopping experience and encouraged repeat purchases. As the Online Sales segment continues to leverage digital advancements and capitalize on evolving consumer behavior, it is poised for rapid expansion and significant market share gains in the Bean Chips Market.
Bean Chips Market Segmentation
By Type
Pinto Beans
Black Beans
White Beans
By Application
Supermarkets/Hypermarkets
Independent Retailer
Online Sales
Others
Countries Analyzed
North America (US, Canada, Mexico)
Europe (Germany, UK, France, Spain, Italy, Russia, Rest of Europe)
Asia Pacific (China, India, Japan, South Korea, Australia, South East Asia, Rest of Asia)
South America (Brazil, Argentina, Rest of South America)
Middle East and Africa (Saudi Arabia, UAE, Rest of Middle East, South Africa, Egypt, Rest of Africa)
Bean Chips Companies Profiled in the Study
Beanfields
Beanitos
Hain Celestial
Kellogg Company
PepsiCo
Way Better Snacks
*- List Not Exhaustive
Chapter 1. TABLE OF CONTENTS
Chapter 2. Introduction to Bean Chips Market
2.1. Market Overview
2.2. Key Statistics and Report Highlights
2.3. Scope of the Comprehensive Study
2.3.1. Market Definition
2.3.2 Countries and Regions Covered
2.3.3 Research Objective
2.3.4 Units, Currency, and Conversions
2.3.5 Industry Value Chain
2.4. Key Market Segments
2.5. Key Companies
2.6. Study Period
Chapter 3. Strategic Analysis Review
3.1. Bean Chips Pricing Analysis and Forecast
3.2. Porter’s Five Forces
3.3. Market Ecosystem
3.4. SWOT Analysis
3.5. Regulatory Scenario
3.3. Effects of Inflation, Russia-Ukraine War, moderating economic growth, and other macroeconomic factors
Chapter 4. Competitive Landscape
4.1. Market Share Analysis
4.1.1. Global Bean Chips Market Share by Company, 2023
4.1.2. Product Offerings of Leading Bean Chips Companies
4.2. Market Entropy
4.2.1. New Product Launches in the Industry
4.2.2. Mergers, Acquisitions, Joint ventures, and Partnerships
4.3. Key Strategies and Best Practices
Chapter 5. Global Market Projections: Best, Reference, and Low Case Scenarios
5.1. Growth Analysis- Case Scenario Definitions
5.2. Low Growth Case Scenario Forecasts
5.3. Reference Growth Case Scenario Forecasts
5.4. High Growth Case Scenario Forecasts
Chapter 6. Market Dynamics
6.1. Bean Chips Market Drivers
6.2. Bean Chips Market Challenges
6.6. Bean Chips Market Opportunities
6.4. Bean Chips Market Trends
Chapter 7. Global Bean Chips Market Outlook Trends
7.1. Global Bean Chips Revenue (USD Million) and CAGR (%) by Type (2021-2032)
7.2. Global Bean Chips Revenue (USD Million) and CAGR (%) by Application (2021-2032)
7.3. Global Bean Chips Revenue (USD Million) and CAGR (%) by Product (2021-2032)
By Type
Pinto Beans
Black Beans
White Beans
By Application
Supermarkets/Hypermarkets
Independent Retailer
Online Sales
Others
Chapter 8. Global Bean Chips Regional Analysis and Outlook
8.1. Global Bean Chips Revenue (USD Million) By Regions (2021- 2032)
8.2. North America Bean Chips Revenue (USD Million) by Country (2021-2032)
8.2.1. United States Bean Chips Regional Analysis and Outlook
8.2.2. Canada Bean Chips Regional Analysis and Outlook
8.2.3. Mexico Bean Chips Regional Analysis and Outlook
8.3. Europe Bean Chips Revenue (USD Million), by Country (2021-2032)
8.3.1. Germany Bean Chips Regional Analysis and Outlook
8.3.2. France Bean Chips Regional Analysis and Outlook
8.3.3. United Kingdom Bean Chips Regional Analysis and Outlook
8.3.4. Spain Bean Chips Regional Analysis and Outlook
8.3.5. Italy Bean Chips Regional Analysis and Outlook
8.3.6. Russia Bean Chips Regional Analysis and Outlook
8.3.7. Rest of Europe Bean Chips Regional Analysis and Outlook
8.4. Asia Pacific Bean Chips Revenue (USD Million) by Country (2021-2032)
8.4.1. China Bean Chips Regional Analysis and Outlook
8.4.2. Japan Bean Chips Regional Analysis and Outlook
8.4.3. India Bean Chips Regional Analysis and Outlook
8.4.4. South Korea Bean Chips Regional Analysis and Outlook
8.4.5. Australia Bean Chips Regional Analysis and Outlook
8.4.6. South East Asia Bean Chips Regional Analysis and Outlook
8.4.7. Rest of Asia Pacific Bean Chips Regional Analysis and Outlook
8.5. South America Bean Chips Revenue (USD Million), by Country (2021-2032)
8.5.1. Brazil Bean Chips Regional Analysis and Outlook
8.5.2. Argentina Bean Chips Regional Analysis and Outlook
8.5.3. Rest of South America Bean Chips Regional Analysis and Outlook
8.6. Middle East and Africa Bean Chips Revenue (USD Million) by Country (2021-2032)
8.6.1. Middle East Bean Chips Regional Analysis and Outlook
8.6.2. Africa Bean Chips Regional Analysis and Outlook
Chapter 9. North America Bean Chips Analysis and Outlook
9.1. North America Bean Chips Revenue (USD Million) by Segments (2021-2032)
9.1.1. North America Bean Chips Revenue (USD Million) by Type (2021-2032)
9.1.2. North America Bean Chips Revenue (USD Million) by Application (2021-2032)
9.1.3. North America Bean Chips Revenue (USD Million) by Product (2021-2032)
By Type
Pinto Beans
Black Beans
White Beans
By Application
Supermarkets/Hypermarkets
Independent Retailer
Online Sales
Others
Chapter 10. Europe Bean Chips Analysis and Outlook
10.1. Europe Bean Chips Revenue (USD Million), by Segments (USD Million) (2021-2032)
10.1.1. Europe Bean Chips Revenue (USD Million) by Type (2021-2032)
10.1.2. Europe Bean Chips Revenue (USD Million) by Application (2021-2032)
10.1.3. Europe Bean Chips Revenue (USD Million) by Product (2021-2032)
By Type
Pinto Beans
Black Beans
White Beans
By Application
Supermarkets/Hypermarkets
Independent Retailer
Online Sales
Others
Chapter 11. Asia Pacific Bean Chips Analysis and Outlook
11.1. Asia Pacific Bean Chips Revenue (USD Million), and Revenue (USD Million) by Segments (2021-2032)
11.1.1. Asia Pacific Bean Chips Revenue (USD Million) by Type (2021-2032)
11.1.2. Asia Pacific Bean Chips Revenue (USD Million) by Application (2021-2032)
11.1.3. Asia Pacific Bean Chips Revenue (USD Million) by Product (2021-2032)
By Type
Pinto Beans
Black Beans
White Beans
By Application
Supermarkets/Hypermarkets
Independent Retailer
Online Sales
Others
Chapter 12. South America Bean Chips Analysis and Outlook
12.1. South America Bean Chips Revenue (USD Million), by Segments (2021-2032)
12.1.1. South America Bean Chips Revenue (USD Million) by Type (2021-2032)
12.1.2. South America Bean Chips Revenue (USD Million) by Application (2021-2032)
12.1.3. South America Bean Chips Revenue (USD Million) by Product (2021-2032)
By Type
Pinto Beans
Black Beans
White Beans
By Application
Supermarkets/Hypermarkets
Independent Retailer
Online Sales
Others
Chapter 13. Middle East and Africa Bean Chips Analysis and Outlook
13.1. Middle East and Africa Bean Chips Revenue (USD Million), by Segments (2021-2032)
13.1.1. Middle East and Africa Bean Chips Revenue (USD Million) by Type (2021-2032)
13.1.2. Middle East and Africa Bean Chips Revenue (USD Million) by Application (2021-2032)
13.1.3. Middle East and Africa Bean Chips Revenue (USD Million) by Product (2021-2032)
By Type
Pinto Beans
Black Beans
White Beans
By Application
Supermarkets/Hypermarkets
Independent Retailer
Online Sales
Others
Chapter 14. Bean Chips Company Profiles
14.1 Business Overview
14.2 Product Profiles
14.3 SWOT Profiles
14.5 Recent Developments
14.6 Financial Profile
List of Companies
Beanfields
Beanitos
Hain Celestial
Kellogg Company
PepsiCo
Way Better Snacks
15. Methodology and Data Sources
15.1 Customization Offerings
15.2 Subscription Services
15.3 Related Reports
15.4 Publisher Expertise
LIST OF TABLES
Table 1 Market Segmentation Analysis
Table 2 Global Bean Chips Market Share of Leading Companies, 2023
Table 3 Product Offerings of Leading Companies
Table 4 Low Growth Scenario Forecasts
Table 5 Reference Case Growth Scenario
Table 6 High Growth Case Scenario
Table 7 Global Bean Chips Revenue (USD Million) And CAGR (%) By Type (2021-2032)
Table 8 Global Bean Chips Revenue (USD Million) And CAGR (%) By Application (2021-2032)
Table 9 Global Bean Chips Revenue (USD Million) And CAGR (%) By Product (2021-2032)
Table 10 Global Bean Chips Market Revenue (USD Million) By Regions (2021-2032)
Table 11 Global Bean Chips Market Share (%) By Regions (2021-2032)
Table 12 North America Bean Chips Revenue (USD Million) By Country (2021-2032)
Table 13 Europe Bean Chips Revenue (USD Million) By Country (2021-2032)
Table 14 Asia Pacific Bean Chips Revenue (USD Million) By Country (2021-2032)
Table 15 South America Bean Chips Revenue (USD Million) By Country (2021-2032)
Table 16 Middle East and Africa Bean Chips Revenue (USD Million) By Region (2021-2032)
Table 17 North America Bean Chips Revenue (USD Million) By Type (2021-2032)
Table 18 North America Bean Chips Revenue (USD Million) By Application (2021-2032)
Table 19 North America Bean Chips Revenue (USD Million) By Product (2021-2032)
Table 20 Europe Bean Chips Revenue (USD Million) By Type (2021-2032)
Table 21 Europe Bean Chips Revenue (USD Million) By Application (2021-2032)
Table 22 Europe Bean Chips Revenue (USD Million) By Product (2021-2032)
Table 23 Asia Pacific Bean Chips Revenue (USD Million) By Type (2021-2032)
Table 24 Asia Pacific Bean Chips Revenue (USD Million) By Application (2021-2032)
Table 25 Asia Pacific Bean Chips Revenue (USD Million) By Product (2021-2032)
Table 26 South America Bean Chips Revenue (USD Million) By Type (2021-2032)
Table 27 South America Bean Chips Revenue (USD Million) By Application (2021-2032)
Table 28 South America Bean Chips Revenue (USD Million) By Product (2021-2032)
Table 29 Middle East and Africa Bean Chips Revenue (USD Million) By Type (2021-2032)
Table 30 Middle East and Africa Bean Chips Revenue (USD Million) By Application (2021-2032)
Table 31 Middle East and Africa Bean Chips Revenue (USD Million) By Product (2021-2032)
LIST OF FIGURES
Figure 1. Market Scope
Figure 2. Pricing Forecasts Per Unit, 2023- 2032
Figure 3. Porter’s Five Forces
Figure 4. Global Bean Chips Market Revenue (USD Million) By Regions (2021-2032)
Figure 5. Global Bean Chips Market Share (%) By Regions (2023)
Figure 6. North America Bean Chips Revenue (USD Million) By Country (2021-2032)
Figure 7. United States Bean Chips Revenue (USD Million) By Country (2021-2032)
Figure 8. Canada Bean Chips Revenue (USD Million) By Country (2021-2032)
Figure 9. Mexico Bean Chips Revenue (USD Million) By Country (2021-2032)
Figure 10. Europe Bean Chips Revenue (USD Million) By Country (2021-2032)
Figure 11. Germany Bean Chips Revenue (USD Million) By Country (2021-2032)
Figure 12. France Bean Chips Revenue (USD Million) By Country (2021-2032)
Figure 13. United Kingdom Bean Chips Revenue (USD Million) By Country (2021-2032)
Figure 14. Spain Bean Chips Revenue (USD Million) By Country (2021-2032)
Figure 15. Italy Bean Chips Revenue (USD Million) By Country (2021-2032)
Figure 16. Russia Bean Chips Revenue (USD Million) By Country (2021-2032)
Figure 17. Rest of Europe Bean Chips Revenue (USD Million) By Country (2021-2032)
Figure 11. Asia Pacific Bean Chips Revenue (USD Million) By Country (2021-2032)
Figure 12. China Bean Chips Revenue (USD Million) By Country (2021-2032)
Figure 13. Japan Bean Chips Revenue (USD Million) By Country (2021-2032)
Figure 14. India Bean Chips Revenue (USD Million) By Country (2021-2032)
Figure 15. South Korea Bean Chips Revenue (USD Million) By Country (2021-2032)
Figure 16. Australia Bean Chips Revenue (USD Million) By Country (2021-2032)
Figure 17. South East Asia Bean Chips Revenue (USD Million) By Country (2021-2032)
Figure 18. South America Bean Chips Revenue (USD Million) By Country (2021-2032)
Figure 19. Brazil Bean Chips Revenue (USD Million) By Country (2021-2032)
Figure 20. Argentina Bean Chips Revenue (USD Million) By Country (2021-2032)
Figure 21. Rest of Asia Pacific Bean Chips Revenue (USD Million) By Country (2021-2032)
Figure 22. Middle East and Africa Bean Chips Revenue (USD Million) By Region (2021-2032)
Figure 23. Saudi Arabia Bean Chips Revenue (USD Million) By Region (2021-2032)
Figure 24. The UAE Bean Chips Revenue (USD Million) By Region (2021-2032)
Figure 25. Rest of Middle East Bean Chips Revenue (USD Million) By Region (2021-2032)
Figure 26. South Africa Bean Chips Revenue (USD Million) By Region (2021-2032)
Figure 27. Africa Bean Chips Revenue (USD Million) By Region (2021-2032)
Figure 28. North America Bean Chips Revenue (USD Million) By Type (2021-2032)
Figure 29. North America Bean Chips Revenue (USD Million) By Application (2021-2032)
Figure 30. North America Bean Chips Revenue (USD Million) By Product (2021-2032)
Figure 31. Europe Bean Chips Revenue (USD Million) By Type (2021-2032)
Figure 32. Europe Bean Chips Revenue (USD Million) By Application (2021-2032)
Figure 33. Europe Bean Chips Revenue (USD Million) By Product (2021-2032)
Figure 34. Asia Pacific Bean Chips Revenue (USD Million) By Type (2021-2032)
Figure 35. Asia Pacific Bean Chips Revenue (USD Million) By Application (2021-2032)
Figure 36. Asia Pacific Bean Chips Revenue (USD Million) By Product (2021-2032)
Figure 37. South America Bean Chips Revenue (USD Million) By Type (2021-2032)
Figure 38. South America Bean Chips Revenue (USD Million) By Application (2021-2032)
Figure 39. South America Bean Chips Revenue (USD Million) By Product (2021-2032)
Figure 40. Middle East and Africa Bean Chips Revenue (USD Million) By Type (2021-2032)
Figure 41. Middle East and Africa Bean Chips Revenue (USD Million) By Application (2021-2032)
Figure 42. Middle East and Africa Bean Chips Revenue (USD Million) By Product (2021-2032)
By Type
Pinto Beans
Black Beans
White Beans
By Application
Supermarkets/Hypermarkets
Independent Retailer
Online Sales
Others
Countries Analyzed
North America (US, Canada, Mexico)
Europe (Germany, UK, France, Spain, Italy, Russia, Rest of Europe)
Asia Pacific (China, India, Japan, South Korea, Australia, South East Asia, Rest of Asia)
South America (Brazil, Argentina, Rest of South America)
Middle East and Africa (Saudi Arabia, UAE, Rest of Middle East, South Africa, Egypt, Rest of Africa)
