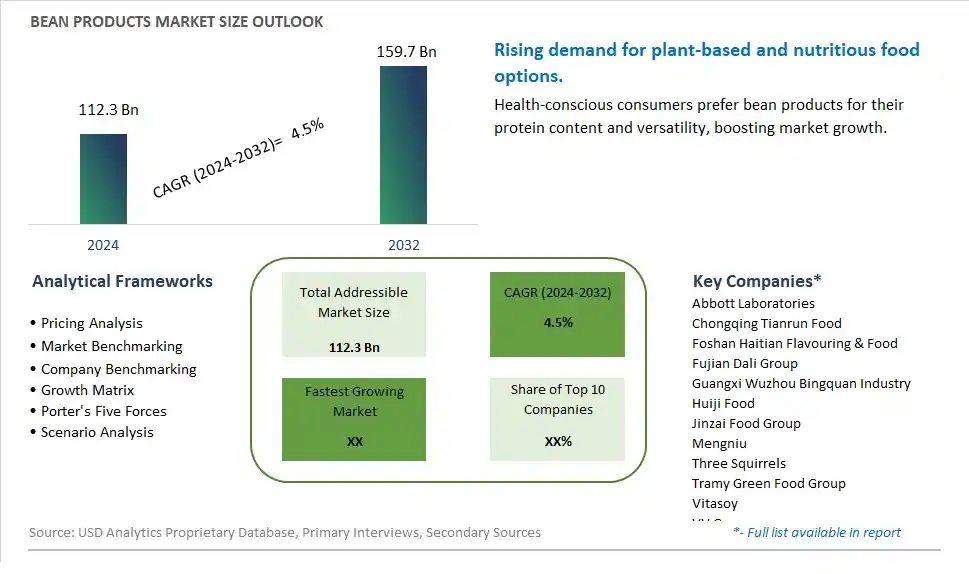
Global Bean Products Market Size is valued at $112.3 Billion in 2024 and is forecast to register a growth rate (CAGR) of 4.5% to reach $159.7 Billion by 2032.
The global Bean Products Market Comprehensive Study analyzes and forecasts the market size across 6 regions and 24 countries for diverse segments -By Type (Fresh Bean Products, Plant Protein Drinks, Leisure Bean Products), By Application (Supermarket, Catering Agency, E-commerce, Others)
An Introduction to Bean Products Market
In 2024, the Bean Products market is witnessing robust growth, driven by the increasing demand for plant-based and nutrient-dense foods. Bean products, which include items such as canned beans, bean flours, and ready-to-eat meals, are valued for their versatility, protein content, and health benefits. The market is supported by the growing trend towards vegetarian and vegan diets, as well as the rising awareness of the environmental benefits of plant-based foods. Advances in food processing and packaging technologies are enhancing the quality and shelf life of bean products. The market is also benefiting from the increasing popularity of ethnic cuisines that feature beans as staple ingredients.
Bean Products Competitive Landscape
The market report analyses the leading companies in the industry including Abbott Laboratories, Chongqing Tianrun Food, Foshan Haitian Flavouring & Food, Fujian Dali Group, Guangxi Wuzhou Bingquan Industry, Huiji Food, Jinzai Food Group, Mengniu, Three Squirrels, Tramy Green Food Group, Vitasoy, VV Group, Yanjin Shop Food Co. Ltd, Yili Group, Yonho Inc, Zhejiang Laoba Foodstuff Co. Ltd, Zuming Bean Products Co, and Others.
Bean Products Market Dynamics
Bean Products Market Trend: Growing Demand for Plant-Based Protein Sources
The most prominent market trend for Bean Products is the growing demand for plant-based protein sources. With an increasing focus on health, sustainability, and ethical eating, consumers are turning to plant-based diets and seeking protein-rich alternatives to meat products. Bean products, such as tofu, tempeh, bean burgers, and bean-based snacks, are gaining popularity as nutritious and environmentally friendly protein options. This trend reflects a broader shift towards plant-based eating habits, driving the demand for bean products across various consumer segments.
Bean Products Market Driver: Health and Wellness Consciousness
A key market driver for Bean Products is the increasing consciousness about health and wellness. Consumers are becoming more aware of the health benefits associated with beans, such as their high protein content, fiber, vitamins, minerals, and low saturated fat content. As a result, bean products are perceived as wholesome, nutritious choices that support overall well-being and contribute to a balanced diet. The driver of health and wellness consciousness propels the adoption of bean products by health-conscious individuals, vegetarians, vegans, and flexitarians looking for plant-based alternatives to animal-derived products.
Bean Products Market Opportunity: Innovation in Product Variety and Convenience
A potential opportunity within the Bean Products market lies in innovation in product variety and convenience. Collaborating with food scientists and chefs can lead to the development of new bean-based products, such as ready-to-eat meals, snacks, beverages, and desserts, that cater to different tastes and preferences. Additionally, focusing on convenient packaging formats, portion control options, and on-the-go snacks can appeal to busy consumers seeking quick and nutritious meal solutions. Exploring opportunities in product variety and convenience allows bean product manufacturers to expand their product offerings, reach new consumer segments, and capitalize on the demand for convenient, plant-based alternatives in the market. By focusing on innovation in product variety and convenience, there are opportunities to create value-added offerings, drive consumer interest, and stay competitive in the rapidly growing plant-based protein market.
Bean Products Market Share Analysis: Fresh Bean Products segment generated the highest revenue share in the industry
The Fresh Bean Products segment stands out as the largest and most prominent category within the Bean Products Market. This segment encompasses a wide range of fresh bean-based food items such as cooked beans, sprouted beans, bean salads, and bean-based dips. Fresh bean products are highly favored by consumers due to their nutritional value, versatility in culinary applications, and natural taste. They are rich in protein, fiber, vitamins, and minerals, making them a popular choice among health-conscious individuals and those following plant-based diets. The growth of the Fresh Bean Products segment is driven by several key factors. Firstly, the increasing consumer awareness regarding the health benefits of beans and plant-based proteins has led to a surge in demand for fresh bean products as a nutritious and sustainable food option. Further, the growing trend of home cooking and meal preparation has encouraged consumers to incorporate more fresh and whole foods into their diets, including fresh bean products. Additionally, the rise of vegetarian and vegan lifestyles has expanded the market for fresh bean-based alternatives to meat and dairy products. As a result, the Fresh Bean Products segment maintains its dominance in the Bean Products Market and is expected to experience continuous growth in the coming years as consumer preferences continue to prioritize health, sustainability, and culinary diversity.
Bean Products Market Share Analysis: E-commerce is the fastest growing segment over the forecast period to 2032
The E-commerce segment within the Bean Products Market emerges as the fastest-growing category, showcasing remarkable growth potential up to 2032. This segment represents the online retailing and distribution of bean products through various e-commerce platforms and websites. The surge in digitalization, coupled with changing consumer preferences and lifestyles, has significantly contributed to the rapid growth of e-commerce in the food and beverage industry, including bean products. The convenience and accessibility offered by online shopping platforms have attracted a large customer base seeking diverse bean-based products, ranging from fresh beans to processed bean snacks and plant-based protein alternatives. Further, the Past few yearshas accelerated the adoption of online shopping for groceries and food items, further boosting the demand for bean products through e-commerce channels. As technology continues to advance, with improved logistics, secure payment methods, and personalized shopping experiences, the E-commerce segment is poised to continue its robust growth trajectory in the Bean Products Market, catering to the evolving preferences of modern consumers who value convenience, variety, and health-conscious choices.
Bean Products Market Segmentation
By Type
Fresh Bean Products
Plant Protein Drinks
Leisure Bean Products
By Application
Supermarket
Catering Agency
E-commerce
Others
Countries Analyzed
North America (US, Canada, Mexico)
Europe (Germany, UK, France, Spain, Italy, Russia, Rest of Europe)
Asia Pacific (China, India, Japan, South Korea, Australia, South East Asia, Rest of Asia)
South America (Brazil, Argentina, Rest of South America)
Middle East and Africa (Saudi Arabia, UAE, Rest of Middle East, South Africa, Egypt, Rest of Africa)
Bean Products Companies Profiled in the Study
Abbott Laboratories
Chongqing Tianrun Food
Foshan Haitian Flavouring & Food
Fujian Dali Group
Guangxi Wuzhou Bingquan Industry
Huiji Food
Jinzai Food Group
Mengniu
Three Squirrels
Tramy Green Food Group
Vitasoy
VV Group
Yanjin Shop Food Co. Ltd
Yili Group
Yonho Inc
Zhejiang Laoba Foodstuff Co. Ltd
Zuming Bean Products Co
*- List Not Exhaustive
Chapter 1. TABLE OF CONTENTS
Chapter 2. Introduction to Bean Products Market
2.1. Market Overview
2.2. Key Statistics and Report Highlights
2.3. Scope of the Comprehensive Study
2.3.1. Market Definition
2.3.2 Countries and Regions Covered
2.3.3 Research Objective
2.3.4 Units, Currency, and Conversions
2.3.5 Industry Value Chain
2.4. Key Market Segments
2.5. Key Companies
2.6. Study Period
Chapter 3. Strategic Analysis Review
3.1. Bean Products Pricing Analysis and Forecast
3.2. Porter’s Five Forces
3.3. Market Ecosystem
3.4. SWOT Analysis
3.5. Regulatory Scenario
3.3. Effects of Inflation, Russia-Ukraine War, moderating economic growth, and other macroeconomic factors
Chapter 4. Competitive Landscape
4.1. Market Share Analysis
4.1.1. Global Bean Products Market Share by Company, 2023
4.1.2. Product Offerings of Leading Bean Products Companies
4.2. Market Entropy
4.2.1. New Product Launches in the Industry
4.2.2. Mergers, Acquisitions, Joint ventures, and Partnerships
4.3. Key Strategies and Best Practices
Chapter 5. Global Market Projections: Best, Reference, and Low Case Scenarios
5.1. Growth Analysis- Case Scenario Definitions
5.2. Low Growth Case Scenario Forecasts
5.3. Reference Growth Case Scenario Forecasts
5.4. High Growth Case Scenario Forecasts
Chapter 6. Market Dynamics
6.1. Bean Products Market Drivers
6.2. Bean Products Market Challenges
6.6. Bean Products Market Opportunities
6.4. Bean Products Market Trends
Chapter 7. Global Bean Products Market Outlook Trends
7.1. Global Bean Products Revenue (USD Million) and CAGR (%) by Type (2021-2032)
7.2. Global Bean Products Revenue (USD Million) and CAGR (%) by Application (2021-2032)
7.3. Global Bean Products Revenue (USD Million) and CAGR (%) by Product (2021-2032)
By Type
Fresh Bean Products
Plant Protein Drinks
Leisure Bean Products
By Application
Supermarket
Catering Agency
E-commerce
Others
Chapter 8. Global Bean Products Regional Analysis and Outlook
8.1. Global Bean Products Revenue (USD Million) By Regions (2021- 2032)
8.2. North America Bean Products Revenue (USD Million) by Country (2021-2032)
8.2.1. United States Bean Products Regional Analysis and Outlook
8.2.2. Canada Bean Products Regional Analysis and Outlook
8.2.3. Mexico Bean Products Regional Analysis and Outlook
8.3. Europe Bean Products Revenue (USD Million), by Country (2021-2032)
8.3.1. Germany Bean Products Regional Analysis and Outlook
8.3.2. France Bean Products Regional Analysis and Outlook
8.3.3. United Kingdom Bean Products Regional Analysis and Outlook
8.3.4. Spain Bean Products Regional Analysis and Outlook
8.3.5. Italy Bean Products Regional Analysis and Outlook
8.3.6. Russia Bean Products Regional Analysis and Outlook
8.3.7. Rest of Europe Bean Products Regional Analysis and Outlook
8.4. Asia Pacific Bean Products Revenue (USD Million) by Country (2021-2032)
8.4.1. China Bean Products Regional Analysis and Outlook
8.4.2. Japan Bean Products Regional Analysis and Outlook
8.4.3. India Bean Products Regional Analysis and Outlook
8.4.4. South Korea Bean Products Regional Analysis and Outlook
8.4.5. Australia Bean Products Regional Analysis and Outlook
8.4.6. South East Asia Bean Products Regional Analysis and Outlook
8.4.7. Rest of Asia Pacific Bean Products Regional Analysis and Outlook
8.5. South America Bean Products Revenue (USD Million), by Country (2021-2032)
8.5.1. Brazil Bean Products Regional Analysis and Outlook
8.5.2. Argentina Bean Products Regional Analysis and Outlook
8.5.3. Rest of South America Bean Products Regional Analysis and Outlook
8.6. Middle East and Africa Bean Products Revenue (USD Million) by Country (2021-2032)
8.6.1. Middle East Bean Products Regional Analysis and Outlook
8.6.2. Africa Bean Products Regional Analysis and Outlook
Chapter 9. North America Bean Products Analysis and Outlook
9.1. North America Bean Products Revenue (USD Million) by Segments (2021-2032)
9.1.1. North America Bean Products Revenue (USD Million) by Type (2021-2032)
9.1.2. North America Bean Products Revenue (USD Million) by Application (2021-2032)
9.1.3. North America Bean Products Revenue (USD Million) by Product (2021-2032)
By Type
Fresh Bean Products
Plant Protein Drinks
Leisure Bean Products
By Application
Supermarket
Catering Agency
E-commerce
Others
Chapter 10. Europe Bean Products Analysis and Outlook
10.1. Europe Bean Products Revenue (USD Million), by Segments (USD Million) (2021-2032)
10.1.1. Europe Bean Products Revenue (USD Million) by Type (2021-2032)
10.1.2. Europe Bean Products Revenue (USD Million) by Application (2021-2032)
10.1.3. Europe Bean Products Revenue (USD Million) by Product (2021-2032)
By Type
Fresh Bean Products
Plant Protein Drinks
Leisure Bean Products
By Application
Supermarket
Catering Agency
E-commerce
Others
Chapter 11. Asia Pacific Bean Products Analysis and Outlook
11.1. Asia Pacific Bean Products Revenue (USD Million), and Revenue (USD Million) by Segments (2021-2032)
11.1.1. Asia Pacific Bean Products Revenue (USD Million) by Type (2021-2032)
11.1.2. Asia Pacific Bean Products Revenue (USD Million) by Application (2021-2032)
11.1.3. Asia Pacific Bean Products Revenue (USD Million) by Product (2021-2032)
By Type
Fresh Bean Products
Plant Protein Drinks
Leisure Bean Products
By Application
Supermarket
Catering Agency
E-commerce
Others
Chapter 12. South America Bean Products Analysis and Outlook
12.1. South America Bean Products Revenue (USD Million), by Segments (2021-2032)
12.1.1. South America Bean Products Revenue (USD Million) by Type (2021-2032)
12.1.2. South America Bean Products Revenue (USD Million) by Application (2021-2032)
12.1.3. South America Bean Products Revenue (USD Million) by Product (2021-2032)
By Type
Fresh Bean Products
Plant Protein Drinks
Leisure Bean Products
By Application
Supermarket
Catering Agency
E-commerce
Others
Chapter 13. Middle East and Africa Bean Products Analysis and Outlook
13.1. Middle East and Africa Bean Products Revenue (USD Million), by Segments (2021-2032)
13.1.1. Middle East and Africa Bean Products Revenue (USD Million) by Type (2021-2032)
13.1.2. Middle East and Africa Bean Products Revenue (USD Million) by Application (2021-2032)
13.1.3. Middle East and Africa Bean Products Revenue (USD Million) by Product (2021-2032)
By Type
Fresh Bean Products
Plant Protein Drinks
Leisure Bean Products
By Application
Supermarket
Catering Agency
E-commerce
Others
Chapter 14. Bean Products Company Profiles
14.1 Business Overview
14.2 Product Profiles
14.3 SWOT Profiles
14.5 Recent Developments
14.6 Financial Profile
List of Companies
Abbott Laboratories
Chongqing Tianrun Food
Foshan Haitian Flavouring & Food
Fujian Dali Group
Guangxi Wuzhou Bingquan Industry
Huiji Food
Jinzai Food Group
Mengniu
Three Squirrels
Tramy Green Food Group
Vitasoy
VV Group
Yanjin Shop Food Co. Ltd
Yili Group
Yonho Inc
Zhejiang Laoba Foodstuff Co. Ltd
Zuming Bean Products Co
15. Methodology and Data Sources
15.1 Customization Offerings
15.2 Subscription Services
15.3 Related Reports
15.4 Publisher Expertise
LIST OF TABLES
Table 1 Market Segmentation Analysis
Table 2 Global Bean Products Market Share of Leading Companies, 2023
Table 3 Product Offerings of Leading Companies
Table 4 Low Growth Scenario Forecasts
Table 5 Reference Case Growth Scenario
Table 6 High Growth Case Scenario
Table 7 Global Bean Products Revenue (USD Million) And CAGR (%) By Type (2021-2032)
Table 8 Global Bean Products Revenue (USD Million) And CAGR (%) By Application (2021-2032)
Table 9 Global Bean Products Revenue (USD Million) And CAGR (%) By Product (2021-2032)
Table 10 Global Bean Products Market Revenue (USD Million) By Regions (2021-2032)
Table 11 Global Bean Products Market Share (%) By Regions (2021-2032)
Table 12 North America Bean Products Revenue (USD Million) By Country (2021-2032)
Table 13 Europe Bean Products Revenue (USD Million) By Country (2021-2032)
Table 14 Asia Pacific Bean Products Revenue (USD Million) By Country (2021-2032)
Table 15 South America Bean Products Revenue (USD Million) By Country (2021-2032)
Table 16 Middle East and Africa Bean Products Revenue (USD Million) By Region (2021-2032)
Table 17 North America Bean Products Revenue (USD Million) By Type (2021-2032)
Table 18 North America Bean Products Revenue (USD Million) By Application (2021-2032)
Table 19 North America Bean Products Revenue (USD Million) By Product (2021-2032)
Table 20 Europe Bean Products Revenue (USD Million) By Type (2021-2032)
Table 21 Europe Bean Products Revenue (USD Million) By Application (2021-2032)
Table 22 Europe Bean Products Revenue (USD Million) By Product (2021-2032)
Table 23 Asia Pacific Bean Products Revenue (USD Million) By Type (2021-2032)
Table 24 Asia Pacific Bean Products Revenue (USD Million) By Application (2021-2032)
Table 25 Asia Pacific Bean Products Revenue (USD Million) By Product (2021-2032)
Table 26 South America Bean Products Revenue (USD Million) By Type (2021-2032)
Table 27 South America Bean Products Revenue (USD Million) By Application (2021-2032)
Table 28 South America Bean Products Revenue (USD Million) By Product (2021-2032)
Table 29 Middle East and Africa Bean Products Revenue (USD Million) By Type (2021-2032)
Table 30 Middle East and Africa Bean Products Revenue (USD Million) By Application (2021-2032)
Table 31 Middle East and Africa Bean Products Revenue (USD Million) By Product (2021-2032)
LIST OF FIGURES
Figure 1. Market Scope
Figure 2. Pricing Forecasts Per Unit, 2023- 2032
Figure 3. Porter’s Five Forces
Figure 4. Global Bean Products Market Revenue (USD Million) By Regions (2021-2032)
Figure 5. Global Bean Products Market Share (%) By Regions (2023)
Figure 6. North America Bean Products Revenue (USD Million) By Country (2021-2032)
Figure 7. United States Bean Products Revenue (USD Million) By Country (2021-2032)
Figure 8. Canada Bean Products Revenue (USD Million) By Country (2021-2032)
Figure 9. Mexico Bean Products Revenue (USD Million) By Country (2021-2032)
Figure 10. Europe Bean Products Revenue (USD Million) By Country (2021-2032)
Figure 11. Germany Bean Products Revenue (USD Million) By Country (2021-2032)
Figure 12. France Bean Products Revenue (USD Million) By Country (2021-2032)
Figure 13. United Kingdom Bean Products Revenue (USD Million) By Country (2021-2032)
Figure 14. Spain Bean Products Revenue (USD Million) By Country (2021-2032)
Figure 15. Italy Bean Products Revenue (USD Million) By Country (2021-2032)
Figure 16. Russia Bean Products Revenue (USD Million) By Country (2021-2032)
Figure 17. Rest of Europe Bean Products Revenue (USD Million) By Country (2021-2032)
Figure 11. Asia Pacific Bean Products Revenue (USD Million) By Country (2021-2032)
Figure 12. China Bean Products Revenue (USD Million) By Country (2021-2032)
Figure 13. Japan Bean Products Revenue (USD Million) By Country (2021-2032)
Figure 14. India Bean Products Revenue (USD Million) By Country (2021-2032)
Figure 15. South Korea Bean Products Revenue (USD Million) By Country (2021-2032)
Figure 16. Australia Bean Products Revenue (USD Million) By Country (2021-2032)
Figure 17. South East Asia Bean Products Revenue (USD Million) By Country (2021-2032)
Figure 18. South America Bean Products Revenue (USD Million) By Country (2021-2032)
Figure 19. Brazil Bean Products Revenue (USD Million) By Country (2021-2032)
Figure 20. Argentina Bean Products Revenue (USD Million) By Country (2021-2032)
Figure 21. Rest of Asia Pacific Bean Products Revenue (USD Million) By Country (2021-2032)
Figure 22. Middle East and Africa Bean Products Revenue (USD Million) By Region (2021-2032)
Figure 23. Saudi Arabia Bean Products Revenue (USD Million) By Region (2021-2032)
Figure 24. The UAE Bean Products Revenue (USD Million) By Region (2021-2032)
Figure 25. Rest of Middle East Bean Products Revenue (USD Million) By Region (2021-2032)
Figure 26. South Africa Bean Products Revenue (USD Million) By Region (2021-2032)
Figure 27. Africa Bean Products Revenue (USD Million) By Region (2021-2032)
Figure 28. North America Bean Products Revenue (USD Million) By Type (2021-2032)
Figure 29. North America Bean Products Revenue (USD Million) By Application (2021-2032)
Figure 30. North America Bean Products Revenue (USD Million) By Product (2021-2032)
Figure 31. Europe Bean Products Revenue (USD Million) By Type (2021-2032)
Figure 32. Europe Bean Products Revenue (USD Million) By Application (2021-2032)
Figure 33. Europe Bean Products Revenue (USD Million) By Product (2021-2032)
Figure 34. Asia Pacific Bean Products Revenue (USD Million) By Type (2021-2032)
Figure 35. Asia Pacific Bean Products Revenue (USD Million) By Application (2021-2032)
Figure 36. Asia Pacific Bean Products Revenue (USD Million) By Product (2021-2032)
Figure 37. South America Bean Products Revenue (USD Million) By Type (2021-2032)
Figure 38. South America Bean Products Revenue (USD Million) By Application (2021-2032)
Figure 39. South America Bean Products Revenue (USD Million) By Product (2021-2032)
Figure 40. Middle East and Africa Bean Products Revenue (USD Million) By Type (2021-2032)
Figure 41. Middle East and Africa Bean Products Revenue (USD Million) By Application (2021-2032)
Figure 42. Middle East and Africa Bean Products Revenue (USD Million) By Product (2021-2032)
By Type
Fresh Bean Products
Plant Protein Drinks
Leisure Bean Products
By Application
Supermarket
Catering Agency
E-commerce
Others
Countries Analyzed
North America (US, Canada, Mexico)
Europe (Germany, UK, France, Spain, Italy, Russia, Rest of Europe)
Asia Pacific (China, India, Japan, South Korea, Australia, South East Asia, Rest of Asia)
South America (Brazil, Argentina, Rest of South America)
Middle East and Africa (Saudi Arabia, UAE, Rest of Middle East, South Africa, Egypt, Rest of Africa)
