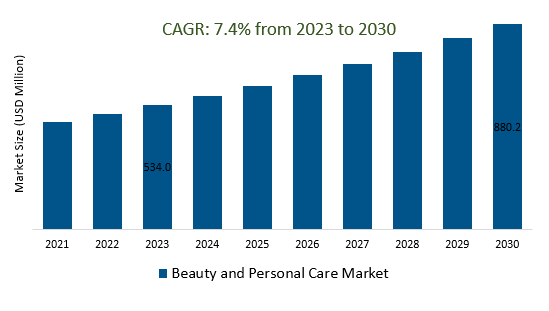
Beauty and Personal Care Market Size is valued at $573.5 Billion in 2024 and is forecast to register a growth rate (CAGR) of 7.4% to reach $1015.2 Billion by 2032..
The market growth is driven predominantly by the increasing beauty and personal care industry was embracing digital technologies, including augmented reality (AR) and virtual reality (VR) tools, to enhance the online shopping experience and allow customers to try products virtually before purchasing. Leading companies are focusing on Technology Integration, Sustainable Beauty, Wellness-Driven Products, Clean Beauty Evolution, Hybrid Products, Biotechnology, and Ingredients, and others to boost market shares in the industry.
Market Overview
The beauty and personal care market is a diverse and expanding industry encompassing skincare, haircare, cosmetics, fragrances, and more. Driven by changing beauty standards, consumer preferences, and technological advancements, the market continues to grow globally. Products cater to individual grooming needs and self-care, with an emphasis on natural ingredients, inclusivity, and sustainability. E-commerce and digital platforms play a crucial role in product distribution and shaping trends, while regional variations highlight cultural influences on consumer choices. The market also reflects a growing interest in men's grooming and ethical considerations, making it a dynamic and evolving sector.
Market Dynamics
Market Trends- Companies are launching Clean and Natural Beauty to attract a consumer base
The Clean and Natural Beauty trend in the beauty and personal care market centers on products made with safe, natural ingredients, responding to consumer concerns about health and the environment. This movement emphasizes transparency, ethical practices, and sustainability, reshaping the industry toward eco-friendly, cruelty-free options that prioritize holistic well-being and personal values.
Market Driver- Hybrid Beauty demand for efficient Beauty and Personal Care Market
The Hybrid Beauty trend in the beauty and personal care market involves
innovative products that blend multiple benefits or functions. This trend capitalizes on consumer demand for efficiency and convenience by combining features like skincare and makeup, SPF protection with cosmetics, or treatments with color. Hybrid beauty products streamline routines and cater to busy lifestyles while offering versatile solutions that address various needs in a single product. This trend exemplifies the industry's adaptation to changing consumer preferences and showcases the convergence of traditionally distinct product categories.
The Personalization trend within the beauty and personal care market involves utilizing technology to offer individualized products and experiences based on factors like skin type and preferences, enhancing customer satisfaction and engagement while adapting to the demand for unique and tailored beauty solutions in the digital era.
Market Share Analysis- skin care Beauty and Personal Care Market will register the fastest growth
The global Beauty and Personal Care Market is analyzed across skin care, Hair Care, Color Cosmetics, Fragrances, and others. Of these, skin care is poised to register the fastest growth. The skincare beauty and personal care market offers products that enhance skin health and appearance, spanning cleansers, moisturizers, treatments, and more. Meeting diverse needs such as acne and aging, it emphasizes natural ingredients and self-care, driven by innovation and scientific advancements.
Market Share Analysis- Organic held a significant market share in 2023
The global Beauty and Personal Care Market is analyzed across a wide range of type including Organic, Conventional, and others. Of these, organic held a significant market share in 2023. The organic trend within the beauty and personal care market involves a focus on products made from natural, non-synthetic ingredients that are grown without the use of pesticides or harmful chemicals. This trend caters to consumers seeking healthier and environmentally-friendly options, emphasizing transparency, sustainability, and ethical sourcing. Organic beauty products often align with a desire for cleaner, safer alternatives that align with personal values and well-being.
Beauty and Personal Care Market Segmentation
By Type
• Conventional
• Organic
By Product
• Skin Care
• Hair Care
• Color Cosmetics
• Fragrances
• Others
By Distribution Channel
• Hypermarkets & Supermarkets
• Specialty Stores
• E-commerce
• Others
By Region
• North America (United States, Canada, Mexico)
• Europe (Germany, France, United Kingdom, Spain, Italy, Others)
• Asia Pacific (China, India, Japan, South Korea, Australia, Others)
• Latin America (Brazil, Argentina, Others)
• Middle East and Africa (Saudi Arabia, UAE, Kuwait, Other Middle East, South Africa, Nigeria, Other Africa)
Beauty and Personal Care Market companies
• Coty Inc.
• Unilever
• Estée Lauder
• L'Oréal S.A.
• Revlon
• Avon Products, Inc
• Procter & Gamble
• Shiseido
• Kao Corporation
• Oriflamme Cosmetics S.A.
* List not exhaustive
Beauty and Personal Care Market Outlook 2023
1 Market Overview
1.1 Introduction to the Beauty and Personal Care Market
1.2 Scope of the Study
1.3 Research Objective
1.3.1 Key Market Scope and Segments
1.3.2 Players Covered
1.3.3 Years Considered
2 Executive Summary
2.1 2023 Beauty and Personal Care Industry- Market Statistics
3 Market Dynamics
3.1 Market Drivers
3.2 Market Challenges
3.3 Market Opportunities
3.4 Market Trends
4 Market Factor Analysis
4.1 Porter’s Five Forces
4.2 Market Entropy
4.2.1 Global Beauty and Personal Care Market Companies with Area Served
4.2.2 Products Offerings Global Beauty and Personal Care Market
5 COVID-19 Impact Analysis and Outlook Scenarios
5.1.1 Covid-19 Impact Analysis
5.1.2 Post-COVID-19 Scenario- Low Growth Case
5.1.3 Post-COVID-19 Scenario- Reference Growth Case
5.1.4 Post-COVID-19 Scenario- Low Growth Case
6 Global Beauty and Personal Care Market Trends
6.1 Global Beauty and Personal Care Revenue (USD Million) and CAGR (%) by Type (2018-2030)
6.2 Global Beauty and Personal Care Revenue (USD Million) and CAGR (%) by Applications (2018-2030)
6.3 Global Beauty and Personal Care Revenue (USD Million) and CAGR (%) by Regions (2018-2030)
7 Global Beauty and Personal Care Market Revenue (USD Million) by Type, and Applications (2018-2022)
7.1 Global Beauty and Personal Care Revenue (USD Million) by Type (2018-2022)
7.1.1 Global Beauty and Personal Care Revenue (USD Million), Market Share (%) by Type (2018-2022)
7.2 Global Beauty and Personal Care Revenue (USD Million) by Applications (2018-2022)
7.2.1 Global Beauty and Personal Care Revenue (USD Million), Market Share (%) by Applications (2018-2022)
8 Global Beauty and Personal Care Development Regional Status and Outlook
8.1 Global Beauty and Personal Care Revenue (USD Million) By Regions (2018-2022)
8.2 North America Beauty and Personal Care Revenue (USD Million) by Type, and Application (2018-2022)
8.2.1 North America Beauty and Personal Care Revenue (USD Million) by Country (2018-2022)
8.2.2 North America Beauty and Personal Care Revenue (USD Million) by Type (2018-2022)
8.2.3 North America Beauty and Personal Care Revenue (USD Million) by Applications (2018-2022)
8.3 Europe Beauty and Personal Care Revenue (USD Million), by Type, and Applications (USD Million) (2018-2022)
8.3.1 Europe Beauty and Personal Care Revenue (USD Million), by Country (2018-2022)
8.3.2 Europe Beauty and Personal Care Revenue (USD Million) by Type (2018-2022)
8.3.3 Europe Beauty and Personal Care Revenue (USD Million) by Applications (2018-2022)
8.4 Asia Pacific Beauty and Personal Care Revenue (USD Million), and Revenue (USD Million) by Type, and Applications (2018-2022)
8.4.1 Asia Pacific Beauty and Personal Care Revenue (USD Million) by Country (2018-2022)
8.4.2 Asia Pacific Beauty and Personal Care Revenue (USD Million) by Type (2018-2022)
8.4.3 Asia Pacific Beauty and Personal Care Revenue (USD Million) by Applications (2018-2022)
8.5 South America Beauty and Personal Care Revenue (USD Million), by Type, and Applications (2018-2022)
8.5.1 South America Beauty and Personal Care Revenue (USD Million), by Country (2018-2022)
8.5.2 South America Beauty and Personal Care Revenue (USD Million) by Type (2018-2022)
8.5.3 South America Beauty and Personal Care Revenue (USD Million) by Applications (2018-2022)
8.6 Middle East and Africa Beauty and Personal Care Revenue (USD Million), by Type, Technology, Application, Thickness (2018-2022)
8.6.1 Middle East and Africa Beauty and Personal Care Revenue (USD Million) by Country (2018-2022)
8.6.2 Middle East and Africa Beauty and Personal Care Revenue (USD Million) by Type (2018-2022)
8.6.3 Middle East and Africa Beauty and Personal Care Revenue (USD Million) by Applications (2018-2022)
9 Company Profiles
10 Global Beauty and Personal Care Market Revenue (USD Million), by Type, and Applications (2023-2030)
10.1 Global Beauty and Personal Care Revenue (USD Million) and Market Share (%) by Type (2023-2030)
10.1.1 Global Beauty and Personal Care Revenue (USD Million), and Market Share (%) by Type (2023-2030)
10.2 Global Beauty and Personal Care Revenue (USD Million) and Market Share (%) by Applications (2023-2030)
10.2.1 Global Beauty and Personal Care Revenue (USD Million), and Market Share (%) by Applications (2023-2030)
11 Global Beauty and Personal Care Development Regional Status and Outlook Forecast
11.1 Global Beauty and Personal Care Revenue (USD Million) By Regions (2023-2030)
11.2 North America Beauty and Personal Care Revenue (USD Million) by Type, and Applications (2023-2030)
11.2.1 North America Beauty and Personal Care Revenue (USD) Million by Country (2023-2030)
11.2.2 North America Beauty and Personal Care Revenue (USD Million), by Type (2023-2030)
11.2.3 North America Beauty and Personal Care Revenue (USD Million), Market Share (%) by Applications (2023-2030)
11.3 Europe Beauty and Personal Care Revenue (USD Million), by Type, and Applications (2023-2030)
11.3.1 Europe Beauty and Personal Care Revenue (USD Million), by Country (2023-2030)
11.3.2 Europe Beauty and Personal Care Revenue (USD Million), by Type (2023-2030)
11.3.3 Europe Beauty and Personal Care Revenue (USD Million), by Applications (2023-2030)
11.4 Asia Pacific Beauty and Personal Care Revenue (USD Million) by Type, and Applications (2023-2030)
11.4.1 Asia Pacific Beauty and Personal Care Revenue (USD Million), by Country (2023-2030)
11.4.2 Asia Pacific Beauty and Personal Care Revenue (USD Million), by Type (2023-2030)
11.4.3 Asia Pacific Beauty and Personal Care Revenue (USD Million), by Applications (2023-2030)
11.5 South America Beauty and Personal Care Revenue (USD Million), by Type, and Applications (2023-2030)
11.5.1 South America Beauty and Personal Care Revenue (USD Million), by Country (2023-2030)
11.5.2 South America Beauty and Personal Care Revenue (USD Million), by Type (2023-2030)
11.5.3 South America Beauty and Personal Care Revenue (USD Million), by Applications (2023-2030)
11.6 Middle East and Africa Beauty and Personal Care Revenue (USD Million), by Type, and Applications (2023-2030)
11.6.1 Middle East and Africa Beauty and Personal Care Revenue (USD Million), by Region (2023-2030)
11.6.2 Middle East and Africa Beauty and Personal Care Revenue (USD Million), by Type (2023-2030)
11.6.3 Middle East and Africa Beauty and Personal Care Revenue (USD Million), by Applications (2023-2030)
12 Methodology and Data Sources
12.1 Methodology/Research Approach
12.1.1 Research Programs/Design
12.1.2 Market Size Estimation
12.1.3 Market Breakdown and Data Triangulation
12.2 Data Sources
12.2.1 Secondary Sources
12.2.2 Primary Sources
12.3 Disclaimer
List of Tables
Table 1 Market Segmentation Analysis
Table 2 Global Beauty and Personal Care Market Companies with Areas Served
Table 3 Products Offerings Global Beauty and Personal Care Market
Table 4 Low Growth Scenario Forecasts
Table 5 Reference Case Growth Scenario
Table 6 High Growth Case Scenario
Table 7 Global Beauty and Personal Care Revenue (USD Million) And CAGR (%) By Type (2018-2030)
Table 8 Global Beauty and Personal Care Revenue (USD Million) And CAGR (%) By Applications (2018-2030)
Table 9 Global Beauty and Personal Care Revenue (USD Million) And CAGR (%) By Regions (2018-2030)
Table 10 Global Beauty and Personal Care Revenue (USD Million) By Type (2018-2022)
Table 11 Global Beauty and Personal Care Revenue Market Share (%) By Type (2018-2022)
Table 12 Global Beauty and Personal Care Revenue (USD Million) By Applications (2018-2022)
Table 13 Global Beauty and Personal Care Revenue Market Share (%) By Applications (2018-2022)
Table 14 Global Beauty and Personal Care Market Revenue (USD Million) By Regions (2018-2022)
Table 15 Global Beauty and Personal Care Market Share (%) By Regions (2018-2022)
Table 16 North America Beauty and Personal Care Revenue (USD Million) By Country (2018-2022)
Table 17 North America Beauty and Personal Care Revenue (USD Million) By Type (2018-2022)
Table 18 North America Beauty and Personal Care Revenue (USD Million) By Applications (2018-2022)
Table 19 Europe Beauty and Personal Care Revenue (USD Million) By Country (2018-2022)
Table 20 Europe Beauty and Personal Care Revenue (USD Million) By Type (2018-2022)
Table 21 Europe Beauty and Personal Care Revenue (USD Million) By Applications (2018-2022)
Table 22 Asia Pacific Beauty and Personal Care Revenue (USD Million) By Country (2018-2022)
Table 23 Asia Pacific Beauty and Personal Care Revenue (USD Million) By Type (2018-2022)
Table 24 Asia Pacific Beauty and Personal Care Revenue (USD Million) By Applications (2018-2022)
Table 25 South America Beauty and Personal Care Revenue (USD Million) By Country (2018-2022)
Table 26 South America Beauty and Personal Care Revenue (USD Million) By Type (2018-2022)
Table 27 South America Beauty and Personal Care Revenue (USD Million) By Applications (2018-2022)
Table 28 Middle East and Africa Beauty and Personal Care Revenue (USD Million) By Region (2018-2022)
Table 29 Middle East and Africa Beauty and Personal Care Revenue (USD Million) By Type (2018-2022)
Table 30 Middle East and Africa Beauty and Personal Care Revenue (USD Million) By Applications (2018-2022)
Table 31 Financial Analysis
Table 32 Global Beauty and Personal Care Revenue (USD Million) By Type (2023-2030)
Table 33 Global Beauty and Personal Care Revenue Market Share (%) By Type (2023-2030)
Table 34 Global Beauty and Personal Care Revenue (USD Million) By Applications (2023-2030)
Table 35 Global Beauty and Personal Care Revenue Market Share (%) By Applications (2023-2030)
Table 36 Global Beauty and Personal Care Market Revenue (USD Million), And Revenue (USD Million) By Regions (2023-2030)
Table 37 North America Beauty and Personal Care Revenue (USD)By Country (2023-2030)
Table 38 North America Beauty and Personal Care Revenue (USD Million) By Type (2023-2030)
Table 39 North America Beauty and Personal Care Revenue (USD Million) By Applications (2023-2030)
Table 40 Europe Beauty and Personal Care Revenue (USD Million) By Country (2023-2030)
Table 41 Europe Beauty and Personal Care Revenue (USD Million) By Type (2023-2030)
Table 42 Europe Beauty and Personal Care Revenue (USD Million) By Applications (2023-2030)
Table 43 Asia Pacific Beauty and Personal Care Revenue (USD Million) By Country (2023-2030)
Table 44 Asia Pacific Beauty and Personal Care Revenue (USD Million) By Type (2023-2030)
Table 45 Asia Pacific Beauty and Personal Care Revenue (USD Million) By Applications (2023-2030)
Table 46 South America Beauty and Personal Care Revenue (USD Million) By Country (2023-2030)
Table 47 South America Beauty and Personal Care Revenue (USD Million) By Type (2023-2030)
Table 48 South America Beauty and Personal Care Revenue (USD Million) By Applications (2023-2030)
Table 49 Middle East and Africa Beauty and Personal Care Revenue (USD Million) By Region (2023-2030)
Table 50 Middle East and Africa Beauty and Personal Care Revenue (USD Million) By Region (2023-2030)
Table 51 Middle East and Africa Beauty and Personal Care Revenue (USD Million) By Type (2023-2030)
Table 52 Middle East and Africa Beauty and Personal Care Revenue (USD Million) By Applications (2023-2030)
Table 53 Research Programs/Design for This Report
Table 54 Key Data Information from Secondary Sources
Table 55 Key Data Information from Primary Sources
List of Figures
Figure 1 Market Scope
Figure 2 Porter’s Five Forces
Figure 3 Global Beauty and Personal Care Revenue (USD Million) By Type (2018-2022)
Figure 4 Global Beauty and Personal Care Revenue Market Share (%) By Type (2022)
Figure 5 Global Beauty and Personal Care Revenue (USD Million) By Applications (2018-2022)
Figure 6 Global Beauty and Personal Care Revenue Market Share (%) By Applications (2022)
Figure 7 Global Beauty and Personal Care Market Revenue (USD Million) By Regions (2018-2022)
Figure 8 Global Beauty and Personal Care Market Share (%) By Regions (2022)
Figure 9 North America Beauty and Personal Care Revenue (USD Million) By Country (2018-2022)
Figure 10 North America Beauty and Personal Care Revenue (USD Million) By Type (2018-2022)
Figure 11 North America Beauty and Personal Care Revenue (USD Million) By Applications (2018-2022)
Figure 12 Europe Beauty and Personal Care Revenue (USD Million) By Country (2018-2022)
Figure 13 Europe Beauty and Personal Care Revenue (USD Million) By Type (2018-2022)
Figure 14 Europe Beauty and Personal Care Revenue (USD Million) By Applications (2018-2022)
Figure 15 Asia Pacific Beauty and Personal Care Revenue (USD Million) By Country (2018-2022)
Figure 16 Asia Pacific Beauty and Personal Care Revenue (USD Million) By Type (2018-2022)
Figure 17 Asia Pacific Beauty and Personal Care Revenue (USD Million) By Applications (2018-2022)
Figure 18 South America Beauty and Personal Care Revenue (USD Million) By Country (2018-2022)
Figure 19 South America Beauty and Personal Care Revenue (USD Million) By Type (2018-2022)
Figure 20 South America Beauty and Personal Care Revenue (USD Million) By Applications (2018-2022)
Figure 21 Middle East and Africa Beauty and Personal Care Revenue (USD Million) By Region (2018-2022)
Figure 22 Middle East and Africa Beauty and Personal Care Revenue (USD Million) By Type (2018-2022)
Figure 23 Middle East and Africa Beauty and Personal Care Revenue (USD Million) By Applications (2018-2022)
Figure 24 Global Beauty and Personal Care Revenue (USD Million) By Type (2023-2030)
Figure 25 Global Beauty and Personal Care Revenue Market Share (%) By Type (2030)
Figure 26 Global Beauty and Personal Care Revenue (USD Million) By Applications (2023-2030)
Figure 27 Global Beauty and Personal Care Revenue Market Share (%) By Applications (2030)
Figure 28 Global Beauty and Personal Care Market Revenue (USD Million) By Regions (2023-2030)
Figure 29 North America Beauty and Personal Care Revenue (USD Million) By Country (2023-2030)
Figure 30 North America Beauty and Personal Care Revenue (USD Million) By Type (2023-2030)
Figure 31 North America Beauty and Personal Care Revenue (USD Million) By Applications (2023-2030)
Figure 32 Europe Beauty and Personal Care Revenue (USD Million) By Country (2023-2030)
Figure 33 Europe Beauty and Personal Care Revenue (USD Million) By Type (2023-2030)
Figure 34 Europe Beauty and Personal Care Revenue (USD Million) By Applications (2023-2030)
Figure 35 Asia Pacific Beauty and Personal Care Revenue (USD Million) By Country (2023-2030)
Figure 36 Asia Pacific Beauty and Personal Care Revenue (USD Million) By Type (2023-2030)
Figure 37 Asia Pacific Beauty and Personal Care Revenue (USD Million) By Applications (2023-2030)
Figure 38 South America Beauty and Personal Care Revenue (USD Million) By Country (2023-2030)
Figure 39 South America Beauty and Personal Care Revenue (USD Million) By Type (2023-2030)
Figure 40 South America Beauty and Personal Care Revenue (USD Million) By Applications (2023-2030)
Figure 41 Middle East and Africa Beauty and Personal Care Revenue (USD Million) By Region (2023-2030)
Figure 42 Middle East and Africa Beauty and Personal Care Revenue (USD Million) By Region (2023-2030)
Figure 43 Middle East and Africa Beauty and Personal Care Revenue (USD Million) By Type (2023-2030)
Figure 44 Middle East and Africa Beauty and Personal Care Revenue (USD Million) By Applications (2023-2030)
Figure 45 Bottom-Up and Top-Down Approaches For This Report
Figure 46 Data Triangulation
